
Morning Briefing Archive (2023)
A Dozen Reasons To Remain Bullish In 2024
December 18 (Monday)
Check out the accompanying pdf and chart collection.
Executive Summary: The bears who still expect a recession base their arguments on historical precedents: At times in the past when economic indicators were flashing the signs they are today, recessions occurred. But we see good reasons not to apply past rules of thumb to the current set of circumstances. Moreover, our Roaring 2020s thesis that widespread adoption of new technologies will set off a productivity boom is unfolding. As a result, we’re bullish on the outlook for the US economy and stock market. Today, we present the bears’ talking points and our rebuttals, including 12 good reasons for optimism as we enter 2024. … Also: Dr. Ed reviews “Archie” (+ +).
YRI Bulletin Board. We have launched our new website. We will be finetuning it in the coming weeks. We appreciate your patience during the transition and welcome your suggestions.
We will be recharging our batteries for the new year from December 19 to January 2. We won’t be publishing the Morning Briefing during that period or broadcasting our usual Monday webcasts. We will keep you connected to our ongoing analysis of economic and market-related events as they happen through our QuickTakes.
Dr. Ed’s next live webcast with Q&A will be at 11:00 a.m. on Monday, January 8. Replays of past weekly webcasts are available here.
Strategy I: Here We Go Again. The Great Debate that started in early 2022 between the stock market’s bulls and the bears continued in 2023 and is set to continue again in 2024. Both sides are marshalling many of the same debating points they have used since early 2022 and a few new ones.
The basic thesis of the bearish debating team is that it isn’t different this time. The Fed raised the federal funds rate by 525bps from March 2020 through August of this year (Fig. 1). That’s the biggest increase since Fed Chair Paul Volcker tightened monetary policy in late 1979. In addition, this time the Fed has been paring the size of its balance sheet through quantitative tightening. This all comes after the Fed provided ultra-easy monetary policies, including ultra-low interest rates and several rounds of quantitative easing, from 2008 through 2021.
Surely such a massive swing from easy to tight monetary policy must cause a credit crunch and a recession, the thinking goes, and probably a severe one! Monetary policy tightening cycles usually have been followed by recessions (Fig. 2). Indeed, each of the past 10 recessions was preceded by such a cycle. Supporting the recession outlook is the yield curve, which has been inverting since the summer of 2022 (Fig. 3). The yield-curve spread is one of the 10 components of the Index of Leading Economic Indicators (LEI), which has been falling since it hit a record high during December 2021 (Fig. 4). It is down 11.8% since then through October. Granted, the Index of Coincident Economic Indicators rose to a record high in October, but it is bound to fall in 2024, according to the bears. Also, an ominous sign for real GDP growth is that real M2 has been falling on a y/y basis since December 2022 (Fig. 5).
Recognizing that consumer spending currently accounts for 68% of nominal GDP, the bears have been attributing the resilience of consumer spending to “excess saving,” which they had expected to run out by now. So now they say that whatever is left will be spent in the coming months, forcing consumers to retrench next year. Meanwhile, another alarming signal, they say, is that consumer credit rose to a record $5.0 trillion, with revolving credit up to a record $1.3 trillion, during October. They’ve also been warning that the resumption of student loan payments during October would depress consumer spending. However, retail sales were surprisingly strong during November, so that is likely to be dropped as a talking point of the bearish squad.
Before we present our rebuttal to the bears’ arguments, here’s some perspective on our stock market outlook and how it compares to the expectations of other Wall Street strategists.
Strategy II: Bullish Targets. The current issue of Barron’s includes the 2024 S&P 500 targets for six investment strategists including yours truly. Our target is the highest at 5400, based on projected S&P 500 earnings per share of $250 next year. Morgan Stanley’s Mike Wilson has the lowest numbers at 4500 for the index’s price target and $229 for earnings per share. In last year’s survey by Barron’s, we had 4800 as our S&P 500 target for last year with earnings at $225. The low comparable readings were 3930 and $199 for 2023.
Along the way, we trimmed our year-end target to a more reasonable 4600. Then, on June 5, we wrote: “Is all the AI euphoria leading the stock market into another ‘MAMU’—‘Mother of All Meltups’? If so, our 4600 target for the S&P 500 by year-end might prove conservative, not controversial.”
On July 19, we wrote: “The S&P 500 is now almost at 4600. It closed at 4556.27 on Tuesday. Rather than raise our year-end target, we are raising our expectations for what the bull market could deliver through the end of 2024 and beyond. We think that 5400 is achievable by the end of next year. If that happens, then 5800 would be our target for the end of 2025. In other words, we think that the bull market has staying power.”
Last week, we raised our 2025 target for the S&P 500 price index to 6000, as our Roaring 2020s scenario is looking not only possible, but also probable.
Strategy III: A Dozen Good Reasons. Now let’s review our talking points on behalf of the bullish team in the Great Debate. Here’s an even dozen:
(1) Interest rates are back to normal. Perhaps the Fed hasn’t been tightening monetary policy so much as normalizing it. Interest rates are back to the Old Normal. They are back to where they were before the New Abnormal period between the Great Financial Crisis and the Great Virus Crisis, during which the Fed pegged interest rates near zero.
The normalization theory implies that the Fed might not lower interest rates next year as much as widely expected. That’s because the economy wouldn’t require as much easing to reverse the tightening. If the economy remains resilient but inflation continues to fall closer to the Fed’s 2.0% target next year—both of which we’re expecting—then the Fed might lower the federal funds rate twice next year, by 25bps each time, instead of four times or more as widely anticipated.
(2) Consumers have purchasing power. Many consumers may soon run out of their excess saving, as the economy’s naysayers are saying. Some consumers could be weighed down by too much consumer debt, especially student loans. Nevertheless, most of them are likely to continue to consume as long as their job security remains high, which it will be as long as there are plenty of job openings and as long as the unemployed and new entrants to the labor force fill those openings. That describes the current state of the labor market.
Indeed, during November, 40% of small business owners reported that they have job openings (Fig. 6). During October, there were 8.7 million job openings overall in the labor market versus 6.5 million unemployed that month. The labor force has increased 3.3 million during the first 11 months of this year. The household measure of employment is up 2.7 million over the same period.
Pandemic-related excess saving certainly helped to boost consumer spending over the previous three years when unemployment was very high and real wages stagnated. But unemployment is low now (i.e., below 4.0% since February 2022), and real average hourly earnings is rising once again along its 1.4% annualized trendline that started in 1993 (Fig. 7).
Both nominal and real wages & salaries in personal income and unearned personal income (including interest income, dividends, rents, and proprietors’ income) rose to record highs during October (Fig. 8). They probably did so again in November.
(3) Households are wealthy and liquid. The net worth of American households totaled a staggering record-high $151.0 trillion at the end of Q3-2023 (Fig. 9). Their portfolios are diversified in various asset holdings that all are at or near record highs (Fig. 10). There are certainly lots of liquid assets that might be sold to buy stocks and bonds when the Fed decides to lower short-term interest rates. A record $5.9 trillion is in money market mutual funds (MMMF) with a record $2.3 trillion in retail MMMFs (Fig. 11). Commercial bank deposits in M2 totaled $17.3 trillion during the December 12 week (Fig. 12).
There are 86 million households who own their own homes, and 40% of them have no mortgages. Many of these homeowners likely are Baby Boomers. They have mostly followed the advice of Star Trek’s Spock, who often said, “Live long and prosper.” Collectively, the generation held $73.1 trillion of net worth at the end of Q3. Boomers are likely to be among the main beneficiaries of record unearned income streams.
(4) Demand for labor is strong. From personal experience, we know that some of the Baby Boomers are providing some financial support to their young adult children. The Boomers are also eating at restaurants and traveling more often. They are visiting their health care providers more frequently to make sure that they live long enough to spend some of their retirement nest eggs.
Not surprisingly, November’s better-than-expected retail sales was led by food services, which rose to yet another record high (Fig. 13). Employment continues to soar in the leisure & hospitality industry as well as in the health care sector.
(5) Onshoring boom is boosting capital spending. American and foreign manufacturing companies clearly are onshoring to the US. Supply-chain disruptions during the pandemic and growing geopolitical tensions between the US and China have stimulated the onshoring rush. So has a shortage of workers in China.
The onshoring boom and the federal government’s increased spending on public infrastructure are boosting new orders for construction machinery, which is up 30.5% over the past 24 months through October (Fig. 14). Onshoring and infrastructure investment also explain why construction employment rose to yet another record high of 8.0 million during November despite the recession in single-family housing starts.
Construction spending on manufacturing facilities is soaring because of the increase in onshoring partly owing to federal incentives. In current dollars, it is up a whopping 71.6% and 136.8% on one-year and two-year bases (Fig. 15).
(6) Housing is all set for a recovery. The plunge in mortgage interest rates since early November undoubtedly will boost new and existing home sales. That should give a boost to housing-related retail sales on appliances, furniture, and furnishings. The rolling recessions in housing and housing-related retailing should turn into rolling recoveries for both.
(7) Corporate cash flow is at a record high. The economy’s resilience can also be attributed to the awesome ability of US corporations to generate cash flow. It totaled a record $3.4 trillion (saar) during Q3-2023. That’s despite the pressure on companies’ profit margins coming from high labor costs and higher interest rates over the past couple of years. Corporate cash flow is up 4.1% y/y, with tax-reported depreciation up 6.9% and undistributed profits down 3.3%. The latter has been relatively flat since Q3-2009.
(8) Inflation is turning out to be transitory. There can be no debate about the transitory nature of goods inflation since H2-2020. It was back down to 0.0 y/y during November (Fig. 16). It turned out to be mostly attributable to the shocks and aftershocks of the pandemic, which have been dissipating since the end of the pandemic.
Almost all the inflationary pressures on durable goods and many nondurable goods stemmed from the pandemic-related supply-chain disruptions, which can be seen in the Global Supply Chain Pressure Index compiled by the Federal Reserve Bank of New York. The index jumped from 0.1 in October 2020 to peak at 4.3 in December 2021. It has plunged since then, returning to 0.1 in November (Fig. 17). The PPI inflation rate for transportation & warehousing has followed suit (Fig. 18).
Now that the goods inflation shock is behind us, the services inflation shock is showing signs of dissipating. We expect it will do just that in 2024.
(9) The High-Tech Revolution is boosting productivity. Companies are allocating more of their capital spending budgets to technology hardware and software to boost their productivity in response to chronic labor shortages. As a result, production of high-tech equipment and spending on software are at all-time highs.
We believe that a major cycle in productivity growth started at the end of 2015, when it bottomed at 0.5% (based on the 20-quarter average) and rose to 1.8% during Q3-2023 (Fig. 19). We expect productivity growth will peak around 4.0% by the end of the decade.
(10) Leading indicators are mostly misleading. What about all those leading indicators that have been signaling an impending recession since last year? We’ve often explained why they are misleading. For example, inverted yield curves in the past have anticipated that the Fed’s tightening would break something in the financial system, causing a credit crunch and a recession, that’s not always the case. There was a mini-banking crisis in March of this year. But it was contained by the Fed so had few systemic ripple effects.
The LEI has misfired its recession signals because its composition is biased toward predicting the goods sector more than the services sector of the economy. There has been a rolling recession in the goods sector, but it has been more than offset by strength in services, nonresidential private and public construction, and high-tech capital spending.
(11) The rest of the world’s challenges should remain contained. Also booming is industrial production of defense, which is likely to continue rising to new record highs given the geopolitical turmoil around the world. The wars between Russia and Ukraine and between Israel and Gaza should remain contained regionally. China’s economic woes reduce the chances that China will invade Taiwan. Nevertheless, these geopolitical hot spots will boost defense spending among the NATO members.
The bursting of China’s property bubble should continue to weigh on global economic growth and commodity prices. China will remain a major source of global deflationary pressures. Europe is in a shallow recession and should recover next year as the European Central Bank lowers interest rates.
(12) The Roaring 2020s will broaden the bull market. At last week’s FOMC meeting, Fed Chair Jerome Powell and his colleagues pivoted toward the soft-landing scenario, which is also known as “immaculate disinflation.” In their Summary of Economic Projections (SEP), they projected three 25bps cuts in the federal funds rate next year, up from September’s two rate cuts. They are starting to recognize that inflation can subside without a recession. We think this is happening because China is having a recession and effectively exporting goods deflation to the US. In addition, technology-driven productivity growth is making a comeback, in our opinion.
The current bull market started on October 12, 2023. It received a big boost when AI-related stocks took off late last year. OpenAI launched ChatGPT on November 30, 2022. We believe that date is when the stock market first started to discount our Roaring 2020s scenario. At first, the bull market was narrowly based, but it since has been broadening to include more sectors and industries. We believe that reflects investors’ realization that the beneficiaries of the Roaring 2020s theme aren’t just the companies that make technology but also those that use it to boost their productivity—i.e., companies generally whatever their industry may be.
Strategy IV: How About All That Government Debt? The bears’ latest and most compelling talking point is that federal government deficits are out of control. Federal government spending is growing rapidly, led by outlays on net interest paid. They totaled a record $716.7 billion over the past 12 months through November. That’s an unsettling development, for sure.
However, keep in mind the flip side of high interest rates: They represent a big windfall for households that receive interest income, which has increased significantly. In addition, the spending bills passed by Congress last year will continue to boost construction spending on public infrastructure, which is at a record high, and continue to stimulate onshore construction of manufacturing facilities. Better-than-expected productivity-led growth would certainly help to reduce the mounting burden of the federal debt.
Nevertheless, the federal government’s need to finance the huge deficit could cause an oversupply of Treasury bonds relative to demand, which could set off a debt crisis. And that certainly could trip up the Roaring 2020s scenario. However, investors realize that nothing will be done to fix the problem in 2024 because it is an election year. Meanwhile, inflation is falling, the Fed is pivoting toward lowering interest rates, and the economy remains resilient.
Movie. “Archie” (+ +) (link) is a British television drama series about actor Cary Grant. He was born into poverty in Bristol in 1904 as Archibald Leach before becoming a star in Hollywood with the new stage name. He was very successful as an actor, playing lead roles in several hit movies. However, his personal life was a mess, as evidenced by his five marriages and four divorces. He suffered greatly from the emotional pain of his childhood. He recognized that he was trapped in the past but couldn’t escape it. However, near the end of his life, he had a baby girl with his fourth wife, Dyan Cannon; it was then that he finally found peace and great satisfaction in the role of good dad.
Drugs, China & AI
December 14 (Thursday)
Check out the accompanying pdf and chart collection.
Executive Summary: The S&P 500 sector with the brightest 2024 earnings growth outlook is none other than Health Care, with a share price index that’s a deep underperformer this year, Jackie reports. One of its component industries accounts for much of both this year’s stock price pain and next year’s projected earnings gains—pharmaceuticals. Three drug makers in particular appear bound for standout earnings next year. … Also: China’s government is not doing what it takes to overcome its formidable economic challenges. … And in today’s Disruptive Technologies segment: one tech veteran’s advice for working with AI, warts and all.
Health Care: Hoping for a 2024 Recovery. The S&P 500 Health Care sector stock price index has been sickly all year, posting negative ytd performance through Tuesday’s close. Tough y/y comparisons to Covid-boosted-earnings in 2022 hurt some drug companies. Others fell off patent cliffs. Pharmacy benefit managers have come under pressure from new competition from the online pharmacy services being offered by Amazon and billionaire entrepreneur Mark Cuban. The makers of weight-loss drugs were among the few pharmaceutical manufacturers to have a banner year.
As the new year begins, analysts are optimistic about the 2024 earnings prospects for companies in the Health Care sector. In fact, the sector’s earnings growth next year is expected to trump that of any other S&P 500 sector—including Technology.
Let’s dive into what hurt Health Care names this year and what stands to help the sector in the year ahead:
(1) A tough 2023. The S&P 500 Health Care sector’s stock price index is one of only four among the 11 S&P 500 sectors to fall this year. Here’s the performance derby for the S&P 500 and its sectors ytd through Tuesday’s close: Information Technology (54.0%), Communication Services (47.8), Consumer Discretionary (36.9), S&P 500 (20.9), Industrials (12.0), Financials (6.6), Materials (6.3), Real Estate (2.3), Health Care (-2.1), Consumer Staples (-4.1), Energy (-8.4), and Utilities (-10.6) (Fig. 1).
The stock price indexes of all but one of the industries within the S&P 500 Health Care sector severely lagged the S&P 500 ytd through Tuesday’s close: Health Care Distributors (23.1%), Health Care Facilities (8.6), Health Care Equipment (3.9), Health Care Supplies (2.7), Managed Health Care (0.4), Biotechnology (-2.9), Pharmaceuticals (-3.7), Life Sciences Tools and Services (-9.9), and Health Care Services (-12.9) (Fig. 2).
(2) Strong earnings growth expected in ’24. Ironically, given the 2023 underperformance of Health Care’s stock price index, this is the S&P 500 sector that analysts see bound for the strongest earnings growth in 2024—of 19.5%, representing a sharp about-face from the sector’s projected earnings drop this year of 20.2%.
Note how much faster the S&P 500 Health Care sector’s earnings are forecast to grow in 2024 relative to the other S&P 500 sectors: Health Care (19.5%), Communication Services (15.9), Information Technology (14.7), Consumer Discretionary (11.7), Industrials (11.1), S&P 500 (11.0), Utilities (8.1), Financials (5.9), Consumer Staples (5.2), Energy (3.7), Materials (2.9), and Real Estate (-0.5).
The Health Care sector’s healthier earnings growth next year owes much to the rebound in the Pharmaceuticals industry’s earnings. In 2022, pharma earnings were boosted by the pandemic, particularly for companies that sold vaccines or needed supplies. This year, earnings for those companies fell sharply as memories of the pandemic faded. Next year, more normal earnings growth is expected to return.
The Pharmaceuticals industry had 18.0% earnings growth in 2022, followed by a projected 41.9% decline in earnings this year; it’s expected to grow earnings by 51.1% in 2024. As a result, the Pharmaceuticals industry’s earnings are expected to be the second fastest growing in the S&P 500 next year, behind only Movies & Entertainment. Notably, though, the Pharmaceutical industry’s earnings estimates will likely be trimmed over the next week as analysts factor in the sharply lower 2024 earnings guidance that Pfizer announced yesterday.
Here are the 2024 earnings growth estimates for the S&P 500 Health Care sector and its component industries: Pharmaceuticals (51.5%), Health Care sector (19.6), Health Care Distributors (13.0), Managed Health Care (11.0), Health Care Supplies (10.7), Biotechnology (9.1), Health Care Facilities (8.2), Health Care Equipment (8.1), Health Care Services (5.1), and Life Sciences Tools & Services (1.0).
(3) Thank Merck, Pfizer & Lilly. Three pharma stocks are expected to post standout earnings growth next year: Eli Lilly, Merck, and Pfizer. Lilly’s results should get a boost from Mounjaro, a diabetes drug that’s now being used for weight loss. A recent analysis of health records and other data showed that those taking Mounjaro lost weight faster than those taking Novo Nordisk’s competing Wegovy and Ozempic drugs, a November 27 Reuters article reported. Lilly’s earnings are expected to rise 86.2% next year, and its shares have climbed 59.8% ytd.
Merck’s earnings growth will jump next year because this year’s earnings are depressed. The drugmaker is facing the patent expiration of blockbuster cancer drug Keytruda later this decade. In preparation for the expiration, Merck has been doing deals to boost its drug pipeline, including a recently announced joint venture with Daiichi Sankyo to commercialize three antibody-drug conjugates that fight cancer. While an upfront payment of $5.5 billion related to the Daiichi joint venture depressed Merck’s earnings this year, it will make Merck earnings growth in 2024 look impressive: 455.6%. Merck’s shares are 5.9% lower ytd.
Pfizer is also facing drug patent expirations and tough comparisons to Covid-boosted earnings in 2022. To help fill its drug pipeline, Pfizer recently announced the acquisition of Seagen, another antibody drug conjugate for fighting cancer. In October, Pfizer slashed its 2023 sales guidance for Paxlovid (a drug to treat Covid) to $1 billion from $8 billion, announcing that the US government returned roughly a third of the Paxlovid doses it had bought from the company.
On Wednesday, Pfizer announced its 2024 earnings estimate of $2.05-$2.25 a share, far below analysts’ consensus forecast of $3.18 a share. Results will be lower than expected because revenue from Covid-related products are forecast to come in well below what analysts had penciled in. Pfizer’s earnings are still expected to bungie from the $5.47 a share it earned in 2022 down to $1.73 this year, then up 24.4% to $2.15 in 2024, using the midpoint of the earnings range the company gave. But the rebound was far lower than expected; that sent the shares tumbling roughly 7% yesterday, bringing its ytd decline to almost 50%.
China: Is Xi Fiddling? It’s been more than two years since China’s most indebted property developer, Evergrande, defaulted on more than $300 billion of debt. Over that time, no restructuring plan has been agreed to, leaving creditors and an estimated 1.5 million retail homebuyers in limbo. Evergrande isn’t alone. Oher Chinese property developers have defaulted as well, and debt restructurings—the kind that really flush out the system and allow it to grow again—are mostly nonexistent. A few developers have restructured their dollar-denominated debt, but they’ve yet to reduce the amount of local debt outstanding.
The status quo has left consumers who purchased apartments in the developers’ unfinished properties unsure of what will happen to their investments and likely wary of spending much on other goods. Most developers aren’t moving forward with new projects, so they’re not buying new parcels of land from municipalities. That’s leaving local municipal coffers low on funds and staring up a mountain of debt.
Earlier this week, the Chinese Communist Party (CCP) held its annual economic conference, but it concluded without news of any large, splashy spending program to save the day. Meanwhile, more signs of deflation have appeared in China’s economy, an ominous development given the amount of debt the country needs to repay. We wouldn’t be surprised to see a cartoon of President Xi fiddling, as Nero purportedly did while Rome burned (though fiddles didn’t exist in the time of Nero).
Let’s take a closer look at these recent developments:
(1) Many goals, no instructions. The CCP aims to promote “high-quality development” and focus on scientific and technological innovation, according to a government statement published by Xinhua News Agency. The government aims to “vigorously promote” new industrialization, develop the digital economy, and accelerate the development of artificial intelligence. The party is targeting the development of industries that include biomanufacturing, commercial aerospace, quantum, and life sciences, while strengthening applied and cutting-edge research and encouraging both entrepreneurial and equity investments. The government also aims to stimulate consumption and expand investments that have proven profitable.
The statement did acknowledge the real estate problem China faces: “It is necessary to coordinate and resolve risks in real estate, local debt, small and medium-sized financial institutions, etc., severely crack down on illegal financial activities, and resolutely maintain the bottom line of preventing systemic risks.” But no solutions to the problem were given.
Chinese shares have fallen sharply this year, with the China MSCI index closing at a 13-month low on Monday and down 13.9% ytd through Tuesday’s close. The broader Shanghai Shenzhen CSI 300 closed at a 58-month low on Wednesday and is down 13.0% ytd (Fig. 3).
(2) Daunting deflation. Both consumer and producer prices have fallen y/y several months this year, indicating that deflation may be on the verge of becoming entrenched. China’s consumer price index (CPI) fell 0.5% y/y in November, its third month of declines. CPI was negative by 0.2% in October and 0.3% in July and unchanged in June and September. China’s core CPI fell 0.6% y/y in June and was flat in May and July. It was at 0.4% y/y in November.
Producer prices have also been in negative territory since last October and most recently fell by 3.0% in November (Fig. 4).
The specter of deflation should keep Chinese central bankers up at night. It certainly worried former Fed Chair Ben Bernanke when deflation was a problem in the US; he once said that if deflation became serious enough, it could warrant dropping money from a helicopter to resolve it. While he wasn’t serious, the implication is that central bankers should do whatever is possible to steer economies clear of or out of deflationary environments.
(3) Lots of can kicking. Since the start of 2020, at least 60 Chinese property developers with more than $140 billion of dollar-denominated bonds collectively have defaulted, according to a December 8 FT article. That doesn’t include the hundreds of billions of dollars of domestic debt these property developers owe.
While it seems clear that debt restructurings are needed, investors continue to let the heavily leveraged property developers off the hook—for now. In the handful of restructurings that have been proposed, it’s the dollar-denominated offshore debt that’s being restructured, while the local debt remains outstanding.
Just this week, most investors in Country Garden Holdings’ yuan-denominated bonds agreed not to exercise a put option that would require the bond be repaid now, before it matures next year. And they were rewarded. Country Garden announced on Wednesday that it repaid the bond in full. Meanwhile, the builder already defaulted on a dollar-denominated bond in October, and its sales fell 77% in November, a December 12 Bloomberg article reported.
Chinese property developer Shimao Group has proposed a restructuring plan that would reduce its $14 billion of offshore debt by as much as half. Some of the debt would be exchanged for new nine-year loans, new senior secured debt, and equity-linked instruments. The company’s $25 billion of local debt does not seem to be impacted by the restructuring proposal. The company has been selling assets to reduce its debt, but it still had to roll over about CNY18.9 billion of local debt during H1-2023 when it posted a net loss that rose 23% to CNY12.1 billion, a December 8 Yicai Global article reported.
Developer Sunac won court approval to restructure about $10 billion of offshore debt, in part by issuing creditors new notes and convertible bonds. The company did not say whether or how its Rmb1trillion of debt would be affected, an October 5 FT article reported.
Bucking this trend are Evergrande’s offshore creditors, who have petitioned a Hong Kong court to liquidate the company. However, the judge in the case postponed a hearing until January to give the property developer more time to propose a restructuring plan, a December 4 FT article reported.
Disruptive Technologies: Riding the AI Wave. Artificial intelligence (AI) definitely captured the public’s attention this year. All of a sudden, ChatGPT and other AI programs were available to the ordinary Joe for free, firing the imaginations of everyone from 13-year-olds with homework to do (or not?) to CEOs focused on using the technology to increase productivity.
Long-time tech watcher and former Andreessen Horowitz partner Benedict Evans made AI the subject of his annual presentation on macro and strategic trends in the tech industry. It’s worth a look, as is the video of a presentation he gave a year ago on the subject.
In the video, he suggests thinking about AI as an intern. If you employed 50 or 100 interns, what would you ask them to do to make work easier, faster, and more efficient? As with many interns, AI’s output needs to be checked given its proclivity to hallucinate, but that won’t eliminate the technology’s usefulness and ability to increase productivity.
In his presentation, Evans quotes Bill Gates: “In my lifetime, I’ve seen two demonstrations of technology that struck me as revolutionary … the [graphic user interface] and ChatGPT.” Graphic user interfaces (GUI) are the symbols on computer screens that allow you to do things, like open email or cut and paste copy, with the click of a mouse instead of having to write lines of code. GUIs made computers accessible to the everyman, eliminating the need for users to have a programing degree.
Now the question is: What will ChatGPT empower the ordinary Joe to do that once required specialized skills? Our kids know ChatGPT can turn them into writers, artists, and videographers. Companies seem to be harnessing the technology in their marketing departments and in chatbots to improve communication with customers. We’re sure that smart folks will continuously think of novel uses, giving us plenty to write about in 2024.
Earnings: Yesterday, Today & Tomorrow
December 13 (Wednesday)
Check out the accompanying pdf and chart collection.
Executive Summary: S&P 500 companies collectively outperformed industry analysts’ Q3 expectations, posting record-high revenues and earnings per share. The profit margin was the highest in four quarters, suggesting that the cost-push inflation pressures that had weighed on margins are easing. … Analysts’ consensus estimates for 2024 and 2025 suggest accelerating growth for both revenues and earnings and rising profit margins. … The earnings outlook together with our projected valuation ranges result in our price targets for the S&P 500 of 4600 by the end of this year, 5400 by the end of next, and 6000 by year-end 2025.
Earnings I: The Past. The Q3 earnings season is over, and the final numbers for S&P 500 companies are in. The results in aggregate were better than analysts had expected, which isn’t surprising when the economy is growing. Worse-than-expected results tend to occur when the economy is falling into a recession. Widespread concerns earlier this year that the economy would fall into a recession—which was not our outlook, as you know—have been largely alleviated.
Today, let’s do some time traveling. We’ll review the recent past—i.e., the Q3 results—then go back to the future by revisiting our forecasts for S&P 500 revenues per share, earnings per share, and the profit margin for 2023, 2024, and 2025. Then let’s conclude with a discussion of the outlook for the S&P 500’s forward earnings per share, forward P/E, and stock price index—including our newly announced S&P 500 target of 6000 for year-end 2025.
Here we go:
(1) Revenues. S&P 500 companies’ collective revenues per share rose to a record high for a second straight quarter in Q3 after dipping in Q1 from Q4-2022’s record, but the y/y gain slowed to an 11-quarter low of 5.0% from 7.1% in Q2 (Fig. 1 and Fig. 2). Inflation continued to boost the growth rate, but less so than in Q2—as the GDP price deflator rose only 1.7% in Q3 compared to 3.5% in Q2—but the inflation-adjusted revenues increase was still a solid gain.
(2) Earnings. S&P 500 earnings per share also rose to a record high in Q3, for the first time since Q2-2022, and its 4.6% y/y increase was its first y/y gain in four quarters (Fig. 3 and Fig. 4).
(3) Profit margin. We can calculate the S&P 500’s profit margin by dividing the index’s earnings by revenues (Fig. 5 and Fig. 6). The margin rose 0.8ppts q/q to a four-quarter high of 12.5%, which is up from 11.5% during Q4-2020. But it was still down from the record high of 13.7% during Q2-2021.
The just-ended earnings recession was very mild, with three back-to-back quarters of modest single-digit percentage declines on a y/y basis. There was no revenues recession. The earnings weakness of recent quarters has been entirely attributable to the decline in the profit margin due to cost-push inflation, and productivity has been weak because of unusually high turnover in the labor market, with record-high quits and job openings earlier in the year. However, the improvement in the profit margin during Q3 suggests those pressures are abating now.
Earnings II: The Present. The S&P 500 companies’ actual Q3 earnings per share turned out to be up 4.6% y/y, which was better than the 0.2% decline expected by industry analysts collectively at the start of the earnings season (Fig. 7).
Currently (as of the December 7 week), industry analysts project that S&P 500 earnings will be up 3.5% y/y during Q4, followed by quarterly gains in 2024 of 7.0% (Q1), 11.2% (Q2), 9.3% (Q3), and 17.8% (Q4) (Fig. 8). At the start of Q4, analysts had been expecting a 9.4% gain in Q4-2023 earnings. Since then, expectations were mostly cut at the drugmakers, auto manufacturers, and commodity-related industries in the S&P 500 Materials sector.
Like the economy, revenues and earnings have been experiencing a soft landing so far, and industry analysts as a group have not been slashing their forecasts. Currently, the analysts’ consensus estimates imply the following y/y revenues and earnings growth rates: for 2023 (2.1%, 0.7%), for 2024 (4.9%,11.2%), and for 2025 (5.4%, 12.4%) (Fig. 9 and Fig. 10).
The S&P 500 profit margin forecasts implied by analysts’ revenues and earnings estimates for 2023, 2024, and 2025 are stabilizing now after dropping at the start of this year. The latest readings for the three years are at 11.8%, 12.5%, and 13.4%. The bottoming of industry analysts’ implied margin estimates suggests they believe that the mini recession in earnings attributable to weakening profit margins is over. They may be right, with margins rising again.
As you know, Joe and I are big fans of weekly S&P 500 forward revenues per share and forward earnings per share as great coincident indicators of the actual quarterly series for S&P 500 revenues per share and earnings per share (Fig. 11 and Fig. 12). (Forward revenues and earnings are the time-weighted average of analysts’ estimates for the current year and the coming year.)
During the November 30 week (the latest data available), forward revenues was just 0.2% below its record high, hit during the November 2 week. But forward earnings has been hitting record highs regularly since the September 14 week—the longest string of successive weekly record highs since the June 16, 2022 week. The forward profit margin edged up during the December 7 week to a 13-month high of 12.7% (Fig. 13).
Earnings III: The Future. Now let’s turn to an update of our outlook for the S&P 500 companies’ collective revenues, earnings, and profit margin.
Since earnings have had a soft landing so far, rather than a hard one, we are expecting a U-shaped, rather than a V-shaped, earnings recovery. If we are surprised, then it’s likely to be because the recovery is more robust than we are projecting. If so, that would be attributable to higher profit margins, boosted by technology-driven productivity gains. Let’s think ahead:
(1) Revenues. We are projecting that revenues per share will increase 4.0% this year to $1,823, 4.0% in 2024 to $1,896, and 4.0% in 2025 to $1,970 (Fig. 14).
(2) Earnings. We project earnings per share will be $225 this year, $245 next year, and $270 in 2025 (Fig. 15). That’s been our forecast since summer 2022. (The final tally for 2022 was $218. We had been projecting $220.) We are now forecasting $300 in 2026.
(3) Profit margin. Our projections imply that the profit margin will fall from 12.4% in 2022 to 12.3% in 2023 and rise back to 13.2% in 2024 and 13.7% in 2025 (Fig. 16).
(4) Forward earnings. We are projecting that S&P 500 forward earnings per share will be $245 at the end of this year (currently $244), $270 at the end of next year and $300 at the end of 2025 (Fig. 17). Those are what we expect the analysts’ consensus earnings expectations then will be for 2024, 2025, and 2026. (At year-ends, forward earnings match the analysts’ projections for the upcoming year.)
(5) Valuation & S&P 500 ranges. Now let’s apply forward P/E ranges of 16.0-20.0 to our forward earnings projections to derive target ranges for the S&P 500 (Fig. 18). The range for 2024 is 4320-5400, and the range for 2025 is 4800-6000 (Fig. 19). Our year-end point estimates are 4600 by the end of this year, 5400 by the end of 2024, and 6000 by year-end 2025.
We acknowledge that our valuation multiple ranges are high historically. However, they reflect our expectations that the MegaCap-8 stocks (i.e., Alphabet, Amazon, Apple, Meta, Microsoft, Netflix, Nvidia, and Tesla) will continue to account for a significant portion of the market cap of the S&P 500, and that they will continue to be highly prized by investors.
We are also seeing more reasons to believe in our Roaring 2020s scenario—the theory that productivity growth will stage a comeback, driven by widely implemented technological solutions to address the US’s chronic labor shortages, and rising productivity will propel economic growth to surprising heights.
Global Economy Still In A Funk
December 12 (Tuesday)
Check out the accompanying pdf and chart collection.
Executive Summary: Recent global indicators show economic growth at a crawl, commodity prices remaining weak, and inflation moderating. Weighing on the pace of growth have been recessions in China and Europe. China’s economic malaise is secular in nature and likely to last for a while given the challenges facing that country. But we expect the ECB to ease in the spring as inflation moderates, and the Eurozone’s shallow recession to lift. US economic growth has been slowing from Q3’s rapid pace, but a comeback in productivity growth could recharge it. … We continue to advise overweighting US stocks in global equity portfolios.
Weekly Webcast. If you missed Monday’s live webcast, you can view a replay here.
Global Economy: Secular or Cyclical Weakness? The global economy is growing, but at a slow pace. Much of the weakness is attributable to the recessions in China and Europe. US economic growth is slowing from Q3’s rapid pace. Much of the weakness is structural in China but cyclical in the US and Europe.
In 2024, China’s economic weakness is likely to persist and weigh on the global economy. But Europe should start to recover, as Melissa and I discussed last Wednesday. The US economy should continue to grow slowly, though we are inclined to anticipate upside surprises if productivity growth continues to make a comeback, as it did during Q2 and Q3 of this year. In our scenario, global inflation should continue to moderate. It might even fall to the 2.0% y/y rate targeted by the Fed for the US and the European Central Bank (ECB) for the Eurozone by the end of next year.
Yesterday, Debbie and I discussed the prospects for the economy over here. Today, let’s look at the outlook over there:
(1) Global growth indicators crawling. According to the Netherlands Bureau for Economic Policy Analysis, global industrial production rose 0.5% y/y through September. However, it has been basically flat since early 2022, though at a record high (Fig. 1). That’s when China was still imposing pandemic lockdowns, Europe’s economy was hit by the shocks from Russia’s invasion of Ukraine, and US consumers pivoted from buying goods to purchasing services. The volume of global exports has also been flat since early 2022, but also at a record high.
Since December 2021, industrial production and the volume of exports among advancing economies are down 1.3% and 1.2% (through September of this year, the latest data available) (Fig. 2). Both have been essentially flat. Over this same period, the production and exports of emerging economies are up 4.9% and only 0.1%. The industrial production index for the members of the Organization for Economic Co-operation and Development (OECD) has also been flat since the end of 2021 (Fig. 3).
(The OECD, with 38 member countries, was founded in 1961 to stimulate economic progress and world trade. The OECD includes the following countries: Australia, Austria, Belgium, Canada, Chile, Colombia, Costa Rica, Czech Republic, Denmark, Estonia, Finland, France, Germany, Greece, Hungary, Iceland, Ireland, Israel, Italy, Japan, South Korea, Latvia, Lithuania, Luxembourg, Mexico, Netherland, New Zealand, Norway, Poland, Portugal, Slovak Republic, Slovenia, Spain, Sweden, Switzerland, Turkey, United Kingdom, and the United States.)
The weakness in both production and exports during 2022 can be attributed largely to global supply-chain disruptions. The New York Fed’s Global Supply Chain Pressure Index soared from 0.11 during October 2020 to 4.33 during December 2021 (Fig. 4). It was back down to 0.11 during October, the first reading above zero since January. Jammed ports and overwhelmed trucking systems depressed global production and exports during 2022. Inbound container traffic soared in US West Coast ports from mid-2020 through mid-2022 to new record highs (Fig. 5). It then dropped sharply during H2-2022 to pandemic lockdown levels. It has started to recover in recent months.
(2) Commodity prices remain weak. Commodity prices, especially those of industrial commodities and crude oil, have been weak, confirming that the global economy is weak. The price of a barrel of Brent crude oil has dropped 20% from September 27 through December 8 (Fig. 6). That’s despite output cuts by Saudi Arabia and Russia since the summer and despite the mounting tensions between the US and Iran because of the Gaza war.
The CRB raw industrials spot price index is down 21% from its most recent peak of 689.0 on April 4, 2022 to 541.4 on December 8, near its lowest level since February 8, 2021. The spot price of copper is included in the CRB index, and it is down 10.5% since January 26 on mounting evidence that China’s property crisis is worsening and weighing on Chinese growth. The price of copper is highly correlated with the China MSCI stock price index, which is down a whopping 56.7% since February 17, 2021 (Fig. 7).
(3) Global inflation moderating. Headline and core inflation rates peaked last October for the 38 member countries of the OECD at 10.7% and 7.8%, respectively (Fig. 8). They were down to 5.6% and 6.5% in October. Energy and food inflation among the OECD, which peaked last year at 40.8% and 16.1%, fell to -4.8% and 7.4% during October (Fig. 9). The headline and core CPI inflation rates for the G-7 countries peaked last summer at 7.8% and 5.5%; they were down to 3.4% and 3.9% in October.
Experience suggests that recessions are necessary to bring down inflation. Yet that’s not necessarily true, as inflation has fallen significantly in the US without a recession. However, inflation is a global phenomenon, especially the recent experience, which was largely triggered by the demand shock that overwhelmed goods markets around the world and their supply chains. That explains why goods inflation has dropped so quickly as soon as the buying binge for goods abated and the supply chains were normalized. Services inflation rates have been stickier, but they also are trending down.
Arguably, the US didn’t need a recession to bring inflation down because the recessions in China and Europe have done that job for it. Let’s turn to those two economies.
(4) China’s challenges. Jackie and I often have discussed the downsides of investing in China. The country prospered from the 1980s through 2013. That was the year that Xi Jinping became the president of China. A few years after assuming office, Xi turned increasingly hostile to the free market entrepreneurial spirit that his predecessors had embraced to stimulate widespread prosperity. The Chinese Communist Party (CCP) took back control of the economy. The problem is that the economy had spun out of control, particularly in the real estate sector.
Provincial governments raised revenues for infrastructure spending by selling land to developers who built ghost cities of empty apartments that were purchased by individuals as investments. The Chinese have a high saving rate and purchased stakes in trusts that are exposed to real estate. They also invested in the stock market. Recently, we’ve noted the significant negative wealth effect that China’s consumers are experiencing. As noted above, the China MSCI stock price index is down 56.7% since February 17, 2021. Apartment prices are falling in an illiquid market for such properties.
Just as China’s property market engine has stalled, so too has its export engine. The CCP’s hostile domestic policies toward entrepreneurs and belligerent foreign policies toward democracies have depressed foreign investments in China and China’s exports. The country is no longer viewed as a dependable business partner nor as a reliable source of goods, especially vital parts.
China’s exports have been flat since December 2021 through November of this year (Fig. 10). That partly reflects slower global economic growth. Imports have also been flat since March 2021. That undoubtedly reflects a weaker domestic Chinese economy.
(5) Europe’s shallow recession. Last week, Melissa and I reviewed the economic outlook for the Eurozone. It’s quite bleak currently, but we expect that more secure sources of energy, lower inflation, and lower interest rates will revive economic growth during H2-2024. The latest data suggest that the region is in a shallow recession currently. Real GDP fell 0.4% (q/q saar) during Q3 (Fig. 11).
The Eurozone’s Economic Sentiment Indicator suggests that GDP might be falling again during Q4. So does the volume of retail sales there, which has been falling since November 2021 (Fig. 12).
Also weighing on the region’s economic growth is the weakness in Germany’s manufacturing sector. Manufacturing orders fell 3.7% m/m and 7.3% y/y during October (Fig. 13). New orders were down in major sectors, including fabricated metal products, electrical equipment, and the key automotive industry. Machinery and equipment manufacturing orders dove 13.5% in October. Manufacturing production fell 0.4% m/m and 3.5% y/y.
As we wrote last week, we are expecting that the ECB will start easing its monetary policy next spring as inflation continues to moderate in the Eurozone. Both the 2-year and 10-year German government note yields dropped sharply in recent days to 2.80% and 2.27%, well below the ECB’s 4.00% deposit rate (Fig. 14).
Global Strategy: Go Home or Go Global? Joe and I continue to recommend overweighting the US in global portfolios. Europe should also be overweighted. We would remain underweighted in the emerging market economies—especially China, even though its stocks look relatively cheap at the current valuation of the China MSCI. On the other hand, India’s MSCI stock price index is at a record high partly because it is a primary beneficiary of China’s woes (Fig. 15). Here are a few related observations:
(1) The Stay-Home versus Go-Global MSCI stock price index ratios in dollars and in local currencies have been trending higher since 2010 (Fig. 16). Both are at or near their record highs during the 2021-22 period.
(2) Contributing to the outperformance of the US MSCI have been the various country indexes’ forward earnings (Fig. 17). The one for the US is up 264.3% since March 9, 2009, to a record high. Meanwhile, the other major market indexes’ forward earnings are up less than 100% over this period and have stalled below their record highs for the past two years. The US tends to have the highest forward profit margin of the major markets around the world (Fig. 18).
(3) The forward P/E of the US MSCI tends to be much higher than those of the other major MSCI markets (Fig. 19). That’s mostly because there are more growth stocks with higher valuation multiples in the former than in the latter. The forward P/E of the All Country World ex-US MSCI tends to track that of the S&P 500 Value index quite closely (Fig. 20). The two have diverged more than usual after the pandemic.
(4) The Emerging Market MSCI (in local currency) is highly correlated with the CRB raw industrials spot price index (in dollars) (Fig. 21). Given the lackluster outlook for global economic activity, industrial commodity prices are likely to remain depressed, suggesting not much upside for the Emerging Markets MSCI.
(5) The EMU MSCI, for the European Monetary Union, has been showing some relative strength in recent days as investors seem to believe that the ECB will be lowering interest rates before the Fed does so in 2024.
Hard Luck For Hard Landers
December 11 (Monday)
Check out the accompanying pdf and chart collection.
Executive Summary: The economy has proven resilient, defying all the reasons it shouldn’t be, to which diehard hard landers still cling. We expect that it will remain resilient and that inflation will continue to fall to the Fed’s target (a.k.a. “immaculate disinflation”). In this scenario, the Fed won’t be rushing to ease and won’t ease by much. The Fed’s policy stance is perhaps better cast as “normalizing” than tightening that requires undoing. … Labor market supply and demand are coming into better balance, as the Fed would like, though November employment data attest to the labor market’s continued strength. … Also: What to make of the fact that GDI is weaker than GDP. … And: Dr. Ed reviews “Reptile” (+).
YRI Bulletin Board. We are planning on launching our new website at the end of this week on December 15. You might have noticed that we already have cut over to a new design for our charts. We think they are more user-friendly and sharper looking.
We will be recharging our batteries for the new year from December 19 to January 2. We won’t be publishing the Morning Briefing during that period, nor will there be Monday webcasts. We do intend to stay connected with our QuickTakes.
Join Dr. Ed’s live webcast with Q&A on Mondays at 11 a.m. EST. You will receive an email with the link one hour before showtime. Replays of the weekly webcasts are available here.
The Fed: Tightening or Merely Normalizing? Based on November’s employment report released on Friday, Debbie and I can safely conclude that there is still no sign of an impending recession. The Godot recession is still a no-show. Our soft-landing (a.k.a. rolling recession) scenario remains intact, as it has since early last year. The diehard hard landers are still expecting a recession, as they have been since the Fed started to tighten in early 2022. But they now expect it in 2024 and mostly think that it will be a shallow recession.
The widely anticipated recession scenario has been based on a very simple and logical premise: The Fed started raising interest rates aggressively last year during May. Short-term and long-term rates have increased by at least 500bps through the summer (Fig. 1). That shocking pivot, following a very long period of ultra-easy monetary policy, must be a terrible shock for the economy, the thinking goes. While the “long and variable lags in monetary policy” have turned out to be longer and more variable this time, a recession will surely occur in 2024, the hard landers figure.
Additionally, the hard landers point out: The yield curve has been inverted since the summer of 2022 (Fig. 2). The Index of Leading Economic Indicators has been falling since it peaked at a record high during December 2021 (Fig. 3). The y/y growth rate of real M2 has been negative since May 2022 (Fig. 4). The real federal funds rate has soared from -8.46% during March 2022 to 2.09% during October (Fig. 5). All of them have been mostly accurate leading indicators of recessions in the past.
Yet contrary to this plausible argument, the economy has remained resilient and avoided a recession so far. Here we are in December 2023, and the unemployment rate remains below 4.0%. Full-time employment is at a record high (Fig. 6). So is payroll employment, which is one of the four components of the Index of Coincident Economic indicators (CEI). It is the first to come out every month and suggests that the CEI rose to yet another new record high in November, confounding the LEI’s followers (Fig. 7).
In recent months, we’ve provided several explanations for why the hard landers and their indicators have been wrong so far. (See, for example, “Captain America,” title of our November 8, 2023 Morning Briefing.) Here’s a new one: Perhaps the Fed hasn’t been tightening monetary policy so much as normalizing it. Interest rates are back to the Old Normal. They are back to where they were before the New Abnormal period between the Great Financial Crisis and the Great Virus Crisis, during which the Fed pegged interest rates near zero.
The normalization theory implies that the Fed might not lower interest rates next year as much as widely expected. That’s because the economy wouldn’t require as much easing to reverse the tightening after the tightening has done its job of bringing down inflation. If the economy remains resilient but inflation continues to fall closer to the Fed’s 2.0% target next year—both of which we’re expecting—then the Fed might lower the federal funds rate twice next year, by 25bps each time, instead of four times or more as widely anticipated. After Friday’s employment report, this was less widely anticipated.
US Labor Market I: Working for a Living. Friday’s employment report was bullish for November’s real personal income, real retail sales, and CEI. Each month when the report is released, Debbie and I calculate our Earned Income Proxy (EIP) for private-sector wages and salaries in personal income. All three of its components registered gains: Payroll employment in the private sector rose 0.1%, average weekly hours increased 0.3%, and average hourly earnings gained 0.4%.
So our EIP rose 0.8% m/m during November (Fig. 8). That undoubtedly well exceeded the month’s inflation rate, boosting the purchasing power of consumers. That should be reflected in a solid increase in the month’s retail sales and CEI.
Here are some other signs of labor market strength in November’s employment report:
(1) The household measure of employment also rose to a record high last month. In fact, it jumped by 747,000 to 162.0 million. Its full-employment component rose 347,000 to a record-high 134.8 million.
(2) The increase in household employment exceeded the 532,000 increase in the labor force. So the number of unemployed workers fell by 215,000 last month to 6.3 million (Fig. 9). The average duration of unemployment fell 10.2% to 19.4 weeks (Fig. 10).
(3) The labor force participation rate rose to 62.8%, matching its highest readings since February 2020 (Fig. 11). Despite the sharp increase in the labor force, the unemployment rate fell to 3.7%. It was down to just 3.4% for adults (Fig. 12).
(4) A closer look at the payroll measure of employment shows that lots of industries reported record payrolls along with the total measure. Particularly strong gains continue to be reported by private education & health services (99,000) and leisure & hospitality (40,000) (Fig. 13). On the other hand, the retail trade payroll count was particularly weak during November (-38,400).
US Labor Market II: Real Pay Gains. In the past, Fed Chair Jerome Powell has indicated that wage inflation would probably have to slow to 3.0% (from 4.0%-5.0% currently) to get to the Fed’s 2.0% target for price inflation. He addressed this issue in a November 30, 2022 speech titled “Inflation and the Labor Market.” Powell observed: “In the labor market, demand for workers far exceeds the supply of available workers, and nominal wages have been growing at a pace well above what would be consistent with 2 percent inflation over time. Thus, another condition we are looking for is the restoration of balance between supply and demand in the labor market.”
That seems to be happening. Consider the following:
(1) Supply and demand. In his speech at the end of last year, Powell presented a clever chart showing the supply of labor as the labor force, and the demand for labor as the sum of employment plus job openings (with the latter pushed ahead by one month) (Fig. 14). It is showing that the demand for labor is down 700,000 since the start of the year, while the supply has increased by 2.5 million. Demand still exceeds supply by 2.4 million workers, but that’s down from a peak of 6.1 million during April 2022.
(2) Wages. Average hourly earnings (AHE) continued to moderate in November. It was down to 4.0% and 4.3% for all private-sector workers and for production and nonsupervisory workers (lower-wage workers), who account for about 80% of payroll employment. The AHE of higher-wage workers has been bouncing around 3.0% y/y since early 2022 (Fig. 15).
US Economy: GDP vs GDI. Then again: USA TODAY Economics and Jobs Reporter Paul Davidson observed in a December 1 story that while Q3’s real GDP was revised up to an annual rate of 5.2%, real gross domestic income (GDI) is up just 1.5%. It “has grown feebly over the past year even while GDP has advanced solidly. Over the past four quarters, GDP has increased 3% while GDI has fallen 0.16%.” Davidson concluded that maybe the economy “isn’t so resilient after all.”
In theory, GDP should equal GDI since the former measures the demand for goods and services, while the latter measures the income available for purchasing those very same goods and services. In practice, there is always a statistical discrepancy. During Q3, real GDP was 2.6% higher than real GDI, the highest discrepancy since 1993 (Fig. 16).
The discrepancy is even greater between nonfarm business output (NFBO), which jumped 6.1% (saar) during Q3, and GDI. The former is the series used to measure productivity.
(Business sector output is a chain-type, current-weighted index constructed after excluding from GDP the following outputs: general government, nonprofit institutions, and households [including owner-occupied housing]. Nonfarm business, which excludes farming, accounted for about 76% of GDP in 2022.)
So which is it? Are the economy and productivity as resilient and strong as suggested by NFBO and GDP, or are they both as weak as suggested by GDI? Economists tend to pick data that support their story. The hard landers love the GDI story. We are prone to that bias, but we do our best to be balanced and tell you both sides of the story, as we are doing now. Some economists simply take the average of GDP and GDI. For now, we see plenty of evidence to stick with our views that the economy is resilient and productivity growth is making a comeback. The stock market seems to agree with us.
Movie. “Reptile” (+) (link) stars Benicio Monserrate Rafael del Toro Sánchez in this crime drama, which is almost as long as his name. The plot is interesting but is a bit too slow paced. Then again, Del Toro is always fun to watch. His understated intensity is ever-present in the roles he plays. This movie is about a murder, real estate agents, drugs, and cops. Alicia Silverstone and Justin Timberlake have parts, but they don’t add much to the movie.
Onshoring, Acquisitions & Octopus
December 07 (Thursday)
Check out the accompanying pdf and chart collection.
Executive Summary: Federal incentives promoting the onshoring of manufacturing plants have certainly hit their mark in Arizona and New York. Both states are sprouting new regional semiconductor manufacturing ecosystems, Jackie reports, dramatically boosting local economic development. … Also: Financial firms with investment banking operations report a pickup in M&A, a trend that should only accelerate when the interest-rate environment stabilizes. … And our Disruptive Technologies focus today is on Octopus Energy, a British company with an innovative business model that rewards green electricity consumption.
Industrials: Onshoring’s Ripple Effects. In phase one of the onshoring wave, many large companies announced plans to take advantage of tax breaks and open new manufacturing facilities in the US. Manufacturers in the solar, semiconductor, and chemical industries have been among the most aggressive in taking advantage of so-called Bidenbucks, the dollars and tax breaks available through the CHIPS and Science Act, the Inflation Reduction Act, and the Infrastructure Investment and Jobs Act.
Now comes phase two. Suppliers are following their large customers and building new manufacturing plants in the US of A as well. The process is well underway in Arizona, where Taiwan Semiconductor Manufacturing is spending $40 billion to build two massive plants, the first of which is expected to open in 2025. In upstate New York, where Micron Technologies has committed to building four plants, the green shoots are visible as well.
The development of these new semiconductor ecosystems as well as manufacturing plants in other industries has contributed to the surge in spending on manufacturing structures. It was up 66.4% y/y during Q3 to a record high; in the first three quarters of 2023, such spending rose 43.3% y/y (Fig. 1). That strength has boosted new orders for construction equipment, which rose 6.7% y/y during October to the fourth highest reading on record (Fig. 2).
All this building has led to more jobs. The number of Americans working in manufacturing has risen to 13.0 million as of October, according to the Labor Department. That’s higher than the prior peak in 2019 and brings manufacturing employment back to a level last seen in 2008 (Fig. 3). Likewise, record numbers of folks are working in heavy and civil engineering construction, 1.1 million in October, and in construction, 8.0 million as of October (Fig. 4 and Fig. 5).
Here’s a look at some of the companies building the semiconductor ecosystems in Arizona and New York:
(1) Arizona’s success story. Taiwan Semiconductor first announced plans to build a $12 billion semiconductor plant in Arizona in 2020. Two years later, it doubled down, expanding that project to two plants costing $40 billion. The project hit some bumps this summer, with squabbles erupting over workers being brought in from Taiwan and the opening pushed back a year to 2025; but otherwise, it’s progressing. Intel is also in the process of building two fabs in Arizona with a $20 billion price tag.
These huge commitments have given suppliers confidence to move to Arizona as well. Since the Taiwan Semi news, 27 semiconductor industry-related companies have announced plans to move to the Phoenix area or have bought or leased property there, a September 10 article on azcentral.com reported. The new businesses have attracted new residents, and builders are building new apartment units to house them.
One semi supplier is Solvay, which announced plans last year to invest in a new facility to produce electronic-grade hydrogen peroxide that cleans silicon wafers, a July 26, 2022 company press release stated. The company, which has other factories in the US, purchased 25 acres of land in Arizona and planned to begin construction this year. Taiwan-based Chang Chun also announced plans in 2022 to produce in Arizona electronic-grade hydrogen peroxide and other solutions for the semiconductor industry. Its first US manufacturing facility is expected to cost $300 million and create 200 jobs.
Yield Engineering Systems develops and manufactures thermal, deposition, and wet process equipment used in semiconductor, life sciences, and display manufacturing. It leased a 123,000-square-foot facility in Arizona in May 2022 to house operations that cater to the semiconductor industry, a May 2022 press release from the local municipality states. The ribbon-cutting was in July 2023.
KPCT Advanced Chemicals, a joint venture between Taiwan-based Kanto Group and Chemtrade Logistics in the US, is building an electronic-grade sulphuric acid manufacturing plant in Arizona over 10 acres. It too will supply the semiconductor industry and is expected to be operational by 2025, a November 2022 press release from the Arizona Commerce Authority states.
Many other industries are building new factories in the state as well. Arizona boasts a $675 million plant being built by Nestle USA to produce creamers. Virgin Galactic is building a manufacturing facility to produce as many as six Delta-class spaceships per year. Proctor & Gamble is building a $500 million manufacturing plant to support its fabric care business by 2025, a January 10 article in Engineering News Record.
(2) Upstate NY bets on semis. Manufacturers like General Electric, Kodak, and Carrier have exited or sharply reduced their operations in the upstate New York area in recent decades, forcing many folks relocate if they want to make a decent living. So it was big news when Micron Technology announced in October 2022 that it would spend $100 billion over the next 20 years to build semiconductor plants in Clay, New York, just north of Syracuse. Construction is expected to begin in 2024 on the first of four plants that should be operational by 2030 and employ 3,000 people directly.
Micron anticipates hiring 9,000 people eventually, when all the fabs are constructed, and 41,000 additional jobs are expected to be created by other businesses supplying the company and its employees with everything from materials to maintenance and restaurants, a July 6 MIT Technology Review article reported.
A handful of other semiconductor businesses have cropped up in upstate New York as well. In November 2022, Edwards Vacuum, a UK-based manufacturer of vacuum and abatement equipment for the semiconductor industry, announced plans to develop a $319 million dry pump manufacturing facility in Genesee County, about two hours west of Clay. That follows the April 2022 opening of Wolfspeed’s $1 billion silicon carbide chip plant north of Utica. The chips initially will be used in electric vehicles (EVs) produced by Lucid and General Motors, a May 2, 2022 article in the Utica Observer-Dispatch reported.
New York State is hopeful that more semi suppliers will brave the New York winters. Governor Kathy Hochul announced $40 million in grants to develop shovel-ready tracks of land on which semiconductor suppliers could build plants. “Employers want to know that the permits are in place, the infrastructure is right, and work can begin almost immediately because time is money," Hochul said according to an August 15 article on WXXI News.
To help meet the region’s future need for qualified labor, Syracuse University plans to expand funding for its College of Engineering and Computer Science by 50% over the next five years or so. Onondaga Community College is also creating two new degree programs.
Time will tell whether New York is as successful as Arizona.
(3) Industrials benefit. All this manufacturing activity has helped boost the S&P 500 Industrial sector’s stock price index by 9.6% ytd through Tuesday’s close. Here’s how Industrials’ ytd performance stacks up against that of the S&P 500 and its other sectors: Information Technology (50.2%), Communication Services (45.3), Consumer Discretionary (34.5), S&P 500 (19.0), Industrials (9.6), Financials (4.7), Materials (4.1), Real Estate (2.5), Health Care (-3.3), Consumer Staples (-4.8), Energy (-6.2), and Utilities (-11.7) (Fig. 6).
The Industrials sector would have performed even more admirably had it not been dragged down by some of the defense contractors, airlines, and air freight & logistics industries. Here’s how some of the best performing industries within Industrials have fared ytd through Tuesday’s close: Industrial Machinery (16.0%), Electrical Components & Equipment (15.9), Industrial Conglomerates (14.1), Construction Machinery & Heavy Trucks (11.5), and Aerospace & Defense (0.4) (Fig. 7).
The S&P 500 Industrials sector is expected to grow revenue by 4.3% this year and 4.8% in 2024, while earnings for the sector are projected to increase 14.2% in 2023 and 11.1% next year (Fig. 8 and Fig. 9). The sector’s forward P/E, at 18.4, is toward the upper end of its range of 11 to 26 over the last decade (Fig. 10).
Financials: A Glimmer of Hope. In recent days and weeks, we’ve noticed that reports of large mergers and acquisitions (M&A) seem to have picked up. Executives at some of the largest banks, while still couching their comments, sounded just a touch more optimistic about the M&A deal environment as well.
“M&A deals are coming a little faster," Bank of America CEO Brian Moynihan told a Goldman Sachs conference, a Reuters article reported on Tuesday. As the interest-rate environment stabilizes, there will be more scope for dealmaking, he added. The bank’s investment banking fees of about $1 billion in the current quarter will be down y/y at percentages in the low single digits but are still expected to outperform the industry average.
Goldman Sachs CFO Denis Coleman said that a lot of clients have appetites for strategic deals but that the high cost of funding has kept private equity firms cautious about undertaking them, Reuters reported.
Here are some of the deals that caught our attention in a wide array of industries:
(1) Health care. Cigna is in merger talks with Humana to create a $140 billion giant that combines a huge pharmacy benefit management operation with the second largest Medicare Advantage business. Roche agreed earlier this month to buy Carmot Therapeutics, an obesity drug developer, for $2.7 billion. Meanwhile, AbbVie is paying $10.1 billion in cash to buy ImmuoGen, which has an antibody drug that fights ovarian cancer.
(2) Oil patch. Occidental Petroleum is reportedly in talks to buy shale company CrownRock. Meanwhile, ExxonMobil has offered to acquire Pioneer Natural Resources for $59.5 billion in stock, but the deal could face a bumpy road if the Federal Trade Commission’s recent request for additional information is any indication.
(3) Airlines. Alaska Air Group has offered $1.9 billion to acquire Hawaiian Airlines. The offer was made even as the Justice Department sued to block JetBlue Airways’ $3.8 billion offer to buy Spirit Airlines. The parties are awaiting a judge’s decision.
(4) Odds ’n ends. Steel manufacturer Cleveland-Cliffs is in negotiations to buy US Steel, while Neiman Marcus has turned down Saks Fifth Avenue’s $3 billion acquisition offer after months of negotiations. Talks between the two retailers reportedly continue.
Disruptive Technologies: Introducing Octopus. Windmills always seem to be painted white, so pictures of several purple and hot pink windmills towering outside of the Dubai venue of the big international climate change conference COP28 demanded further attention. They were installed by Octopus Energy, a privately held British company that’s trying to turn the electric industry on its head. It’s attempting to manage the intermittency of solar and wind energy by deploying storage solutions, incentivizing consumers to use electricity when renewable energy is at peak production, and rolling out smart software to manage it all.
The company has its tentacles in many different areas. Here’s a quick look at some of them:
(1) Green production. Octopus owns wind and solar projects in 15 countries, including the UK, France, Finland, Sweeden, and Australia. On Monday, it announced an agreement to develop up to five wind turbines and solar panels with batteries in Sierra Leone in partnership with actor Idris Elba and Siaka Steven’s development company, Sherbro Alliance Partners.
(2) Electricity provider. Octopus sells electricity to consumers and to businesses. It installs heat pumps, EV chargers, smart meters, and other hardware in residential homes. Consumers get the opportunity to invest in that local green energy generation; and if they live near a wind turbine, consumers can receive a 20% discount on electricity used when the wind is blowing most actively. The same goes for solar. The model incentivizes consumers to use electricity when it’s the most available and cheapest for Octopus to provide it.
The company is working with British property developers, telling them how many solar panels to put on a home and what sizes of battery, heat pump, and water heater are necessary to install. The company provides homeowners with a license to consume the solar energy provided and guarantees that they won’t receive an electric bill for 10 years.
(3) EV lessor. Another program Octopus offers gets EVs into consumers’ driveways. Companies can lease EVs from Octopus to offer as employee perks; employees can buy the EVs they’re using over time with a portion of their gross salary. As part of the deal, they receive a free home charger, insurance, car maintenance, and free home charging on the first 4,000 miles driven. The payroll deductions allow employees to save on National Insurance (the UK’s social security system) and income tax, the company’s website explains.
(4) Software manages it all. Perhaps Octopus’ most valuable arm is Kraken Technologies. It offers a software operating system that utilities use to manage and optimize energy production and consumption. Its software also manages customer information, billing, meter data management and offers AI-powered communication and automation.
Intelligent Octopus is a Kraken-powered retail offering that helps British customers max out their renewable electricity use when power is abundant and cheap. “Speaking on a panel at COP28, [Octopus Energy’s founder and CEO Greg Jackson] said that the previous day more than half a million Octopus customers were paid to use less electricity at peak times, which was ‘the equivalent of turning off the entire energy consumption of two cities,’” according to a December 4 article in the Australian Financial Review. As a result, Octopus doesn’t have to buy expensive coal-generated electricity during peak periods. It creates a “virtual power plant” that’s growing 24% m/m in the UK.
The company is selling the Kraken software internationally. On Tuesday, Octopus announced a trial with Abu Dhabi National Energy Company; and last June, the company struck its first US deal with Tenaska Power Services.
Over There & Over Here
December 06 (Wednesday)
Check out the accompanying pdf and chart collection.
Executive Summary: Europe’s economic outlook is brightening, Melissa reports, perhaps presenting investment opportunities. The ECB’s monetary tightening has corralled inflation but also trampled GDP growth; this spring may bring monetary easing that enables revived growth. … Earlier fears of inadequate energy supplies for winter now appear ill-founded. … However, challenges remain in the form of higher energy costs and discord among EU nations over fiscal rules. … Also: Joe notes that the stock market’s post-October 27 rally has taken a turn for the broader since November 13, with more sectors participating in gains and the S&P 500 Value and Equal Weight indexes way outperforming their counterparts.
Europe I: Winter Advisory Lifted. Melissa and I foresee brighter days on the horizon for Europe. Our expectation of a resurgence in economic growth as early as spring 2024—contingent on inflation receding and the European Central Bank (ECB) halting its monetary policy tightening—may be starting to materialize.
Earlier, we had advised caution, suggesting that it might be wise to weather the chilly season in European markets, as we were concerned about potential challenges to the region’s energy resilience. However, our optimism has increased along with the gas in the region’s storage facilities.
Our primary concern now shifts to how well the European economy will adapt as fiscal support diminishes, which we’ll continue to monitor. Energy subsidies played a crucial role during the early stages of the Russian-Ukraine conflict, and pandemic-related supports prevented a severe recession. However, the energy shortages and fiscal supports also sparked inflation. The ECB’s tight monetary policy since has cooled inflation but also has slowed economic growth. We anticipate a reversal of the ECB’s tightening measures in the spring, providing the necessary momentum for an economic upswing.
For forward-thinking investors, now seems to be an opportune time to reenter the European equities market. Despite a surge in Europe’s MSCI Index by 8.5% in euro terms during H1-2023, investor enthusiasm waned during the summer, with a slip of 8.5% from the peak on April 21 to a recent low on October 27 (Fig. 1). Yet there has been a 7.4% rebound since then through Monday’s close.
Despite the upturn, the MSCI price index remains reasonably valued. The forward P/E has hovered around 12 since early this year. This is notably lower than in 2021 when the multiple was near 16 before European equities dropped, reflecting uncertainties during Russia’s invasion of Ukraine and concerns about energy stability. We anticipate further valuation increases as Europe’s energy situation stabilizes and interest rates begin to fall.
Europe II: ECB Tames Inflation. In Europe, both growth and inflation are in retreat—an outcome of the ECB’s ten consecutive interest-rate hikes since July 2022, culminating in a pause at a 4.0% main deposit rate in its October 26 meeting. If the current inflation trend persists, Melissa and I think the ECB could initiate rate cuts as early as spring, setting the stage for later-year growth. While we are not banking on that yet, we are willing to bet that the most recent season of ECB hikes is over. Key points:
(1) Growth stalls. The Eurozone’s real GDP growth contracted by 0.1% q/q Q3, influenced by headwinds from high inflation, elevated interest rates, and a less supportive fiscal environment (Fig. 2). This raises the likelihood of a technical recession if the weakness extends into Q4. Germany recorded a notable 0.1% quarterly decline, while France, Spain, and Italy narrowly escaped contraction.
(2) Inflation eases. The Eurozone’s inflation continued its descent in November, marking the seventh consecutive month moving toward the ECB’s 2.0% y/y target from levels above 10.0% a year ago (Fig. 3). Headline consumer price inflation dropped to 2.4% y/y from October’s 2.9%, with nearly all items declining except for processed foods. Core inflation—excluding food, energy, alcohol, and tobacco—eased faster than expected, dipping to 3.6% y/y from 4.2%, driven by a significant drop in services prices.
(3) ECB assesses. Last week, ECB President Christine Lagarde argued that victory over high inflation could not yet be declared, as inflation could stage a comeback owing partly to rapid nominal wage growth. Indeed, despite economic contraction, unemployment remains at a record low (Fig. 4).
However, inflation appears to be falling more rapidly than anticipated by the ECB. Yesterday, Isabel Schnabel, ECB board member and formerly hawkish, informed Reuters that further interest-rate hikes are off the table due to a “remarkable” fall in inflation. However, she cautioned that surprises could occur in either direction and said that forecasting a cut several months out might be premature.
Europe III: Competing Developments. Europe has encountered contrasting economic developments, marked by resilience in addressing the recent gas crisis contrasted with fiscal challenges. Here’s more:
(1) Full capacity. Europe has managed to overcome the feared gas shortages that had been expected to spill over from the Russian-Ukrainian war. In fact, inventories peaked at 99.6% full on November 6, reported Reuters. This exceeds the 89.0% average of the previous decade by over 10ppts, positioning the region well for winter. Even under extreme conditions, projections suggest that inventories will remain substantial—at a minimum of 35% full—which is testament to the effectiveness of Europe’s strategic gas management.
However, this success is tempered by the challenge of coping with higher gas prices over the medium term. Europe faces a shift from relatively inexpensive Russian pipeline gas to costlier liquefied natural gas from diverse sources, including Asia.
(2) Fiscal quandary. On the fiscal front, the European Union (EU) is grappling with divergent views on new fiscal rules, with a consensus unlikely in 2023 and negotiations extending into 2024, reported Reuters. Germany, traditionally fiscally prudent, faces its own crisis due to recent legal rulings threatening €60 billion ($66 billion) in climate spending, as recently discussed in The Economist. This jeopardizes domestic demand, the energy transition, and geopolitical goals.
Germany’s insistence on stringent fiscal guidelines for all EU members further complicates the situation, as other countries seek a more flexible approach. The EU’s Stability and Growth Pact, suspended since 2020, is set to be reinstated in 2024, reflecting the post-pandemic reality of higher public debt and the imperative for increased climate-related investments.
The pact imposes limits on budget deficits (3% of GDP) and debt (60% of GDP), with potential disciplinary action for noncompliance. Many European governments currently exceed those thresholds.
Strategy: The Growth Versus Value Gap. The S&P 500 has rallied sharply since its bottom on October 27, leaving behind the summer swoon on fears of a “higher for longer” interest-rate policy. The index’s surge since October 27 began as those interest-rate fears waned, with the initial phase led by Growth stocks, primarily the MegaCap-8 (i.e., Alphabet, Amazon, Apple, Meta, Microsoft, Netflix, Nvidia, and Tesla). That rally has broadened out since November 13 following the release of October’s CPI. Higher-for-longer fears have given way to rising expectations of an economic soft landing, and various jobs-related data releases have even stoked hopes of interest-rate cutting in 2024.
The S&P 500 Value and Equal Weight indexes are benefitting from those changes in perception. So are more of the S&P 500’s sectors. The increasing breadth is welcome news for investors who were left behind when the MegaCap-8 dominated the S&P 500’s performance for much of 2023 following last year’s bottom on October 12 (Fig. 5).
(1) Value now leads Growth following CPI’s release. Since November 13, the S&P 500 Value index has risen 5.4%, more than double Growth’s 2.1% gain. Value’s strong performance has vaulted the index into the top spot for performance during the rally since October 27: Value’s gain has improved to 12.5% from a 9.8% rise for the now-lagging Growth index. In fact, the S&P 500 Value index closed at a record high on Friday
(Fig. 6)!
In contrast, the S&P 500 stands (as of Monday’s close) 4.7% below its January 3, 2022 record high of 4796.56. The Growth index has fared worse by this measurement: It remains mired in a 14.9% correction from its record high on December 27, 2021.
(2) Equal Weight index surging now. Since November 13, the S&P 500 Equal Weight index has jumped 6.9%, nearly double the 3.6% rise for the S&P 500’s market-weighted index (Fig. 7). Comparing the two indexes’ gains since October 27, Equal Weight still beats the market-weighted index but not by nearly as much: Its 12.3% rise compares with the latter’s 11.0% rise (Fig. 8).
(3) Sector breadth is improving too. Prior to the release of the October CPI on November 14, 10 of the S&P 500’s 11 sectors were up from the index’s October 27 low through November 13. However, just four sectors were ahead of the index then: Communication Services, Consumer Discretionary, Financials, and Information Technology. Three of these sectors, all but Financials, are home to the MegaCap-8 group of stocks.
The release of the October CPI upset that order. While the number of sectors rallying since October 27 has dropped to nine as of Monday’s close, five are now ahead of the S&P 500. Some of LargeCap’s traditional Value sectors—e.g., Financials, Real Estate, and Industrials—have surged since then, while Growth-oriented Communication Services and Information Technology have faltered.
Here's how the S&P 500’s 11 sectors have performed since November 13: Real Estate (12.0), Financials (6.7), Materials (6.3), Industrials (6.0), Utilities (5.8), Consumer Discretionary (4.9), Health Care (3.9), S&P 500 (3.6), Consumer Staples (2.3), Information Technology (1.9), Energy (-0.2), and Communication Services (-0.2).
That strong performance since November 13 has increased the number of sectors outperforming the S&P 500 since October 27 to five. Here’s their performance ranking since October 27: Real Estate (18.0), Financials (14.6), Consumer Discretionary (13.9), Information Technology (13.4), Industrials (12.6), S&P 500 (11.0), Materials (9.5), Communication Services (8.5), Health Care (7.1), Utilities (7.0), Consumer Staples (6.3), and Energy (-1.1) (Fig. 9).
A Remarkably Resilient Economy
December 05 (Tuesday)
Check out the accompanying pdf and chart collection.
Executive Summary: Interest rates have been ascending and the tight labor market has been a problem for companies this year and last, but the US economy has been robust regardless. Today, we look at what accounts for its unusual resilience. … Hoisting the economy has been strength in the construction industry, especially multi-family, home improvement, and nonresidential building. … Also contributing to the economy’s resilience has been US corporations’ awesome cash generating capability. … And good news for next year: Signs are mounting that the rolling recession in the goods producing sector of the economy is bottoming and should give way to a rolling recovery in 2024.
Weekly Webcast. If you missed Monday’s live webcast, you can view a replay here.
US Economy I: Construction Is Booming. The US economy has been remarkably resilient in the face of the Fed’s aggressive tightening of monetary policy since early last year. One of the sectors that accounts for that resilience is the construction industry. In the past, rising interest rates always depressed construction, which exacerbated the resulting recessions (Fig. 1 and Fig. 2). This time, the weakness in residential construction has been offset by relatively strong private nonresidential and public construction (Fig. 3 and Fig. 4). Here’s more:
(1) Private residential construction. While single-family housing construction has been weak, that weakness has partially been offset by record spending on multi-family construction and near-record spending on home improvements, which are almost as large as spending on single-family construction (Fig. 5 and Fig. 6).
(2) Private nonresidential construction. Many of the components of nonresidential construction spending are at or near their record highs, including education, highway & street, amusement & recreation, commercial, and office (Fig. 7 and Fig. 8). The strength of the last two categories is surprising. They might weaken with a lag (maybe in 2024) in response to the tightening of credit conditions during 2022 and 2023. But for now, they are a source of economic strength.
Off the charts is construction spending on manufacturing facilities because of the increase in onshoring owing to federal incentives (Fig. 9). In current dollars, it is up a whopping 71.6% and 136.8% on one-year and two-year bases.
(3) Public construction. Most of the major categories of public construction spending are also at or near their record highs (Fig. 10). Here are their y/y growth rates through October: power (55.9%), sewage & waste disposal (27.2), office (18.1), education (16.5), water supply (15.3), highway & street (12.7), and transportation (8.6).
(4) Construction employment. Payroll employment in the construction industry occasionally has been a leading economic indicator and often has been a coincident indicator of the business cycle. So it tends to fall during recessions. There’s no sign of a recession in construction employment currently. It has been rising to fresh record highs since May 2022 (Fig. 11). Employment is strong across all the major building trades, including residential, nonresidential, and heavy & civil engineering (Fig. 12).
(5) Related stock indexes. Since the October 27 low in the S&P 500, the stock price index of its Real Estate sector has recovered nicely. So have the stock price indexes of the various S&P 500 REITs (Fig. 13). Here is their performance derby since then through Friday’s close: Office (26.1%), Telecom Tower (25.1), Industrial (21.5), Single-Family Residential (18.2), Self-Storage (17.9), Hotel & Resort (17.7), Real Estate sector (17.3), Retail (16.5), Broadline (15.1), and Data Center (15.1).
US Economy II: Surveys Suggest Goods Recession Is Bottoming. The rolling recession in the goods producing sector of the economy shows signs of bottoming and should transition into a rolling recovery next year. For now, the latest data suggest that the sector may be bottoming:
(1) M-PMI composite. November’s national composite M-PMI remained below 50.0 for the 13th month in a row (Fig. 14). However, it bottomed at 46.0 in June and has remained slightly above that low through November. The regional M-PMI bottomed in May at -16.5 and rose to -4.7 in November.
(2) M-PMI orders. A V-shaped recovery is more discernible in the national and regional orders sub-components of the M-PMI surveys (Fig. 15). Both bottomed in May. They’ve recovered since then and should be back in growth territory early next year, in our opinion.
(3) Supply-chain index. The rolling recession in the goods producing sector has been the pause that refreshes. It has taken the kinks out of global supply chains. The New York Fed’s Global Supply Chain Pressure Index, which starts with 1998 data, fell from a record high of 4.3 at the end of 2021 to a record low of -1.7 during October (Fig. 16). That’s helped significantly to lower goods inflation over the period.
US Economy III: Record Corporate Cash Flow. The economy’s resilience can also be attributed to the awesome ability of US corporations to generate cash flow. It totaled a record $3.4 trillion (saar) during Q3-2023 (Fig. 17). That’s despite the pressure on companies’ profit margins coming from high labor costs and higher interest rates over the past couple of years. Here are a few related stats:
(1) Corporate cash flow is up 4.1% y/y, with tax-reported depreciation up 6.9% and undistributed profits down 3.3%. The latter has been relatively flat since Q3-2009.
(2) After-tax corporate profits from current production was down 1.7% during Q3, with dividends down 0.9% and undistributed profits down 3.3% (Fig. 18).
(3) The dividend payout ratio using after-tax profits from current production was 67.9% during Q3 (Fig. 19).
Ho! Ho! Ho!
December 04 (Monday)
Check out the accompanying pdf and chart collection.
Executive Summary: The stock market’s Santa Claus rally has been turbocharged by a rallying bond market, subsiding inflation, lower oil and gasoline prices—in turn fueling consumers’ purchasing power—diminished fear of the Fed, and China’s economic weakness, which lowers the prices Americans pay for goods imported from there. … Jamie Dimon is right to warn that geopolitical dangers are great, but we don’t ascribe to his view that inflation remains troublesome, the Fed might tighten more, and the consumer’s strength likely isn’t sustainable. We think the economic evidence suggest otherwise on each score. … More good news: The sticky services inflation rates that have concerned the Fed are coming unstuck. ... Dr. Ed’s movie review: “The Holdovers” (+).
YRI Bulletin Board. We will be recharging our batteries for the new year from December 19 to January 2. We won’t be publishing the Morning Briefing during that period, nor will there be Monday webcasts. We do intend to stay connected with our QuickTakes.
We are also planning on launching our new website before the end of this year. You might have noticed that we already have cut over to a new design for our charts. We think they are more user-friendly and sharper looking.
YRI Weekly Webcast. Join Dr. Ed’s live webcast with Q&A on Mondays at 11 a.m. EST. You will receive an email with the link one hour before showtime. Replays of the weekly webcasts are available here.
Strategy: It’s Starting To Look a Lot Like a Santa Claus Rally. Our Wednesday, November 1 QuickTakes was titled “Halloween Is Over. Is Santa Here Already?” Joe and I wrote: “It’s possible that the S&P 500 bottomed today.” In fact, it bottomed a few days earlier on Friday, October 27. On November 5, we wrote: “We are seeing reindeer, so Santa may not be far behind. We may be back on track to hit 4600 by the end of this year.”
The S&P 500 closed at 4594.63 on Friday, up 11.6% since then and only 4.2% below its record high on January 3, 2022 (Fig. 1). Joe observes that the S&P 500 Value stock market index rose to a new record high on Friday (Fig. 2)! Breadth improved dramatically on Friday, as the S&P 500 equal-weighted index rose 1.5% while the market-cap weighted index rose 0.6% (Fig. 3 and Fig. 4).
The rally in stocks has been fueled by the rally in the fixed-income markets. The 2-year Treasury note yield peaked at 5.19% on October 18 and fell to 4.56% on Friday. Over this same period, the 10-year yield fell from 4.91% to 4.22% (Fig. 5).
What changed since October 27? The price of crude oil has been falling since September 27, reducing anxiety about inflation and decreasing the price of gasoline, which has increased consumers’ purchasing power. The broad measures of inflation have continued to moderate. Economic indicators have been weaker than expected, as evidenced by the fall in the Citibank Economic Surprise Index in recent weeks, increasing the odds of a soft-landing following the blowout 5.2% jump in Q3’s real GDP (Fig. 6).
Nevertheless, labor market indicators have remained strong, with plenty of job openings amidst a chronic labor shortage. That keeps consumers spending but companies paying up for workers or making do with fewer of them (and seeking technological solutions to doing so). Industry analysts are expecting that S&P 500 earnings will increase 11.3% in 2024 and 12.0% in 2025 (Fig. 7). S&P 500 forward earnings per share—i.e., the time-weighted average of analysts’ consensus estimates for the current and following years—has been rising to new record highs since the September 14 week.
Also different since October 27: Market participants have gained more confidence that the Fed is done raising interest rates, so much so that their focus now is on when and by how much the Fed might cut rates next year. The 12-month federal funds rate futures fell sharply on Friday to 4.21% (Fig. 8). Also: China’s economic woes are reducing the prices of US imports from China and reducing the likelihood that China will invade Taiwan for a while. The Gaza war hasn’t turned into a major regional war so far.
US Economy I: A Third Year of Living (Not So) Dangerously. So why is Jamie Dimon still so pessimistic? The economy got strong marks from JP Morgan’s CEO in a January 10, 2022 CNBC interview: “The consumer balance sheet has never been in better shape,” said the banking industry giant. Stock prices, home prices, and wages are up. Debt balances are down, savings are up, and job openings are plentiful. Business confidence is high, and balance sheets are solid. The market may be volatile, he noted, but the underlying economy is strong, and if we’re lucky the Fed will engineer a soft landing.
Then on June 1, 2023, CNBC’s Hugh Son reported that Dimon had these words of warning for analysts and investors attending a financial conference in New York: “You know, I said there’s storm clouds, but I’m going to change it … it’s a hurricane.” Son wrote that Dimon went on to say that “[w]hile conditions seem ‘fine’ at the moment, nobody knows if the hurricane is ‘a minor one or Superstorm Sandy,’ … ‘You’d better brace yourself. … JPMorgan is bracing ourselves, and we’re going to be very conservative with our balance sheet.’”
On October 2 of this year, Dimon told Bloomberg TV it’s possible that the central bank will continue hiking rates by another 1.5 percentage points, to 7%. Dimon stressed that this may be the most dangerous time the world has seen in decades and that the wars between Ukraine and Russia and between Israel and Gaza could have far-reaching impacts on energy and food supply, trade, and geopolitical relationships. They could even, he said, lead to “nuclear blackmail.”
Now Dimon seems to be ignoring all the reasons to be optimistic. Last Wednesday, he said, “A lot of things out there are dangerous and inflationary. Be prepared.” He said so at the 2023 New York Times DealBook Summit in New York. “Interest rates may go up and that might lead to recession,” he added.
US Economy II: Consumer Spending at Record High. Since last year, Dimon has been saying that consumer spending was boosted by excess saving accumulated during the pandemic. He has been saying that they soon will run out of that purchasing power and be forced to retrench, causing a consumer-led recession.
At the DealBook Summit, Dimon said that stimulus money handed out during Covid shutdowns and quantitative easing by the Federal Reserve had injected “drugs directly into our system” and caused an economic “sugar high.” But that’s fading, in his opinion.
October’s stats on consumer incomes, saving, spending, and saving were released last Thursday. In our opinion, they show a consumer who continues to enjoy increases in real income and to spend it. Consider the following:
(1) Consumer spending in real GDP. The Atlanta Fed's GDPNow tracking model shows that real consumer spending growth has fallen from Q3's 3.6% to 2.7% saar during Q4. That’s still a solid growth rate.
(2) Sources of income. In real personal income, wages and salaries as well as unearned income (interest, dividends, rent, and proprietors’ income) rose to record highs in October (Fig. 9). During the second half of last year, real average hourly earnings resumed its upward trend that started during the mid-1990s (Fig. 10). Payroll employment rose to yet another record high in October (Fig. 11).
(3) Personal saving and net worth. The personal saving rate remained relatively low at 3.8% during October (Fig. 12). That’s down from a recent peak of 5.3% during May, and 7.7% during February 2020, just before the pandemic. Consumers may still be depleting their excess saving as Dimon contends. Or else, we may see an extended period with a low saving rate because household net worth rose to a record high of $154.3 trillion during Q3, up $37.6 trillion since Q4-2019, just before the pandemic (Fig. 13). The values of the various asset classes held by households are either at or near recent record highs (Fig. 14).
(4) Record spending on. Americans continue to spend lots of money on services. Either at or near recent record highs are outlays on health care ($3.1 trillion saar), food services ($1.2 trillion), air transportation and hotels & motels ($0.4 trillion), and fun-related services ($0.4 trillion) (Fig. 15, Fig. 16, Fig. 17, and Fig. 18). Job openings and hirings remain elevated in these booming service-providing industries.
On the other hand, housing-related purchases on furniture & furnishings and household appliances have weakened since early last year (Fig. 19).
US Economy III: Inflation Recedes. Stocks rallied last Thursday on the news that October's PCED inflation rate continued to moderate. The headline and core rates fell to 3.0% and 3.5% y/y (Fig. 20). Most importantly, the inflation rate of PCED services excluding energy and housing is falling. It has been stuck around 5.0% in 2022 and earlier this year. But it was down to 3.9% y/y in October (Fig. 21). Even rent inflation, its stickiest component, is moderating (Fig. 22).
Fed Chair Jerome Powell and his colleagues have said that they are concerned about the stickiness of this “super-core” measure of inflation. Now they should be less concerned, as it seems to be coming unstuck.
Movie. “The Holdovers” (+) (link) is about a curmudgeonly instructor of ancient history at a New England all-boys prep school. Much to his chagrin, he is picked by the school’s headmaster to watch over a few of the students who have nowhere to go during the Christmas break. The teacher, played to perfection by Paul Giamatti, and one of the students get to know and understand one another and themselves better. The message is that some people aren’t as bad as they seem once you are forced to spend some time with them.
MegaCap-8, AI & Gates On Climate Change
November 30 (Thursday)
Check out the accompanying pdf and chart collection.
Executive Summary: The MegaCap-8 stocks are approaching their highest collective market capitalization ever, having already hit a record high in terms of their share of the S&P 500’s capitalization. … Also: Jackie discusses Google’s AI initiatives and election-year challenges. … And: Our Disruptive Technologies segment recaps Bill Gates’ practical and innovative approach to climate-related investments as the annual COP28 climate change conference kicks off in the UAE. Three innovations seem particularly promising.
Technology I: MegaCap-8 Closing in on Record. Don’t look now, but the MegaCap-8’s capitalization is within spitting distance of a new record high. The group of eight stocks (i.e., Alphabet, Amazon, Apple, Meta, Microsoft, Netflix, Nvidia, and Tesla) collectively is up 78.7% from its 18-month low on January 5 through Tuesday’s close. That leaves its capitalization only 1.7% below its previous record set in December 2021, Joe calculates (Fig. 1). And in terms of the percentage of the S&P 500’s total capitalization the MegaCap-8 represents, it has never been higher, at 27.9% (Fig. 2).
Some of the individual stocks’ ytd price gains are even more remarkable than the group’s aggregate advance. Here are how the members of the MegaCap-8 have performed ytd through Tuesday’s close: Nvidia (227.2%), Meta (181.7), Tesla (100.3), Amazon (75.0), Neflix (62.4), Microsoft (59.6), Alphabet (56.2), and Apple (46.5).
The MegaCap-8’s forecasted long-term earnings growth rate (LTEG) has also risen this year, to 41.0%, up from 13.5% at the start of 2023 (Fig. 3). The LTEG estimate owes most of its surge to Nvidia’s booming AI chip sales. Nvidia’s LTEG estimate is 112.8%, up from 21.3% earlier this year and 6.7% before the pandemic.
Despite the surge in stock prices, the growing optimism about future earnings growth has meant the group’s forward P/E has increased only modestly this year. It stands at 27.9, well above the low of 21.1 at the start of this year but well below the high of 38.5 in August 2020 (Fig. 4).
Here are the forward P/Es for the members of the MegaCap-8: Tesla (64.9), Amazon (42.3), Microsoft (32.0), Netflix (30.9), Apple (28.6), Nvidia (25.0), Alphabet (20.7), and Meta (19.8) (Fig. 5). (FYI: “Forward P/Es” are the multiple based on forward earnings, or the time-weighted average of analysts’ consensus operating earnings-per-share estimates for this year and next.)
Technology II: Checking in with Google. The executive drama at ChatGPT has captured headlines in recent weeks, keeping the spotlight off other artificial intelligence (AI) providers. But that doesn’t mean that Alphabet—a.k.a. Google—isn’t making progress with its AI offerings. Here’s a look at some of the new ways the company is using AI and some of the steps it’s taking ahead of the 2024 elections.
(1) Google’s AI learns new tricks. Google’s interest in AI dates back at least to 2014 when it acquired DeepMind Technologies reportedly for around $600 million. The company’s most recent investment is in Anthropic, which was founded by former ChatGPT employees. After investing $500 million in the startup earlier this year, Google invested another $500 million into the firm and may add another $1.5 billion over time, a WSJ article reported on October 27.
Alphabet is expanding the use of AI throughout its offerings. It’s using AI to make it easier for users to search their email inboxes, a June 2 CNBC article reported. Users will see “top results” above the “all results” section. Top results will be picked by Google’s AI to display the most relevant emails. The company also plans to use AI to automate advertising and ad-supported customer services, a May 17 CNBC article reported.
Google’s DeepMind researchers believe they have found a more efficient and automated method of designing computer chips using AI. They’ve also announced an AI vision-language-action model that can help train robots to do things like throw out the trash. And their protein-structure-prediction AI can hunt for the genetic mutations in a person’s proteins that are likely to cause health problems, a September 21 Scientific American article reported.
Most recently, DeepMind AI has made strides in materials science. It has discovered 2.2 million new crystal structures that may be used in areas that range from renewable energy to advanced computation. Researchers will winnow the structures down to 381,000 of the most promising for further testing, a November 29 FT article reported. The news illustrates how much faster AI was able to make successful discoveries.
(2) Google preps for the elections. AI will face a large test next year during the campaigns for the presidential and congressional elections. The technology’s ability to create and distribute false ads will face off against Internet providers’ abilities to detect and identify or eliminate those ads. Google announced that election ads running on its platforms created with or altered by AI will have to carry a clear disclosure.
“Election ads that have been digitally created or altered must include a disclosure such as, ‘This audio was computer-generated,’ or ‘This image does not depict real events,’” a September 7 CNBC article reported. Minor changes do not require disclosure. The article did not state how Google will know if the ad is AI created if it is not voluntarily disclosed.
Google’s former CEO Eric Schmidt is concerned. “The 2024 elections are going to be a mess because social media is not protecting us from false generated AI,” he told CNBC on June 26. “They’re working on it, but they haven’t solved it yet.” Free speech should be allowed on social media for humans, not computers, he noted. And social media companies should mark all their content accordingly, as either human or computer generated.
Disruptive Technologies: Bill Gates on Climate Change. COP28, the world’s annual climate conference, kicks off today, with politicians, scientists, and executives gathering in the United Arab Emirates (UAE). Despite the surge in renewable energy projects, the world is on track to miss the Paris Agreement’s goals of reducing greenhouse gases by roughly 50% by 2030 to limit global warming to 1.5 degrees Celsius.
While Rome burns, expect COP28 attendees to squabble over whether the world should phase out all fossil fuels and whether it should aim for zero emission of carbon dioxide (CO2). Arguments also are expected to revolve around how much funding rich countries should give poor countries to reduce their CO2 emissions.
There’s also controversy surrounding the meeting’s President-Designate Sultan al-Jaber, who also happens to be the head of the Abu Dhabi National Oil Company and chair of the state-owned renewable energy company, Masdar. Papers reportedly indicate that UAE officials planned to pitch the country’s oil and gas business to foreign government officials attending the event, a November 27 BBC article reported.
While President Joe Biden plans to skip the meeting, tech mogul Bill Gates will attend with many of the companies that the Bill & Melinda Gates Foundation has helped to fund and develop. His investment vehicle, Breakthrough Energy, has invested about $2 billion in 100 companies focused on reducing CO2 emissions, and it’s raising another $1 billion of funding.
As you’d expect, Gates approaches climate change like a tech businessman. He assumes that most consumers will not pay more to buy products that are environmentally friendly. Nor does he believe that consumers will buy less or travel less in order to reduce emissions.
As a result, he aims to develop technologies that allow consumers and companies to continue to operate as they do today, while reducing or eliminating their CO2 emissions at no additional cost. When consumers can buy an electric vehicle for less than a gas vehicle, you’ll see mass adoption. “[W]e really do have to acknowledge that this is a world of finite resources. And the one thing that’s magic in this world is … innovation,” he said in a wide ranging interview with the FT on November 3.
Breakthrough Energy recently published State of the Transition 2023, which touches on industry trends in many areas of green energy. In his forward, Gates highlights three that he believes could accelerate efforts to reduce greenhouse gasses: harnessing hydrogen, preparing the grid for surging electricity demand, and carbon sequestration. Here’s a brief look at each area:
(1) Harnessing hydrogen. Lots of work is being done to determine how hydrogen can be used in many areas of the fuel ecosystem. For example, it would be ideal if extra wind or solar power could be used to make hydrogen, which then could be stored in fuel cell batteries until the electricity is needed. Unfortunately, the process is costly.
Breakthrough Energy has invested in a number of companies that are developing alternatives for storing electricity. Malta takes electricity from the grid and uses a heat pump to convert it to thermal energy. The heat is stored in molten salt, and the cold is stored in a chilled liquid antifreeze coolant. The process can be reversed when the grid needs electricity. Form Energy, a company we’ve mentioned in past Morning Briefings, approaches the problem by storing electricity for up to 100 hours in an iron-air battery that converts iron into rust and then reverses the process. Antora stores electricity as heat in solid carbon blocks.
Because of its energy intensity, hydrogen might also be the cost-effective alternative fuel for trucks, ships, and planes. However, scientists need to determine how it can safely be transported and stored and then to develop a distribution system. Engineers are also creating electrofuels, or e-fuels, by pulling carbon out of the air with direct capture technology and combining it with hydrogen. The process, however, is far more expensive than traditional fuel production processes.
(2) Fortifying the grid. In a zero-carbon world, people in 2050 may use triple the amount of electricity used today, the report states. Gas- and coal-fired electric plants that power our homes, offices, and factories will be replaced by green electric power production. Additional capacity will also be needed to charge electric vehicles. Storing and transmitting intermittent solar- and wind-generated electricity “will require big, modernized, and interconnected electric grids. Right now those don’t exist.”
The report contends that if the grid isn’t updated, 80% of the green investments being made by the Inflation Reduction Act will go unrealized. The grid’s transmission capacity needs to be increased by 60% by 2030 and by 200%-300% by 2050. A grid update needs to include the addition of more high-voltage lines that can carry electricity long distances to connect regions and communities. Digital systems will need to be added to make the grid smart, adaptable, and efficient. Fortunately, the technology exists. Unfortunately, no one wants high transmission lines in their backyards, so permitting hurdles may stand in the way of modernization.
(3) Seizing the carbon. Gates and Breakthrough seem skeptical about capturing carbon from the air and pumping it underground because doing so requires energy and is very expensive. Unless the cost is reduced dramatically, companies won’t pay up for that unless new taxes compel them to do so.
Until the price of carbon capture falls, it’s more effective not to emit CO2 in the first place. Even then, carbon capture will have a roll. It will be needed to reduce the CO2 that has been emitted for a century and remains trapped in the atmosphere. It may also be used in industrial activities that can’t go green economically. In that case, governments theoretically would tax any CO2 emissions at a rate high enough to push the companies to pay for the carbon capture needed.
Breakthrough is invested in Heirloom, which uses carbon mineralization to take carbon out of the air at a lower cost. The company places ground-up limestone on trays, and the limestone passively pulls CO2 out of the air. Fully CO2-saturated limestone is put inside an electric kiln to separate the CO2 and pump it underground. The process uses “significantly” less heat and power than direct air carbon capture technologies.
Breaking Good
November 29 (Wednesday)
Check out the accompanying pdf and chart collection.
Executive Summary: Many of investors’ fears in 2023 turned out to be unfounded; all they really had to fear was fear itself. Now that investor sentiment has improved as investors have cast some fears aside, will undue fearlessness be a concern for the stock market in 2024? … Also improved from a year ago has been the consensus outlook of Wall Street strategists for S&P 500 operating earnings per share; our own estimates for this year and next have been and are still higher than the consensus. … Also: Joe shares the latest net estimate revisions data, showing more estimate cutting than hiking over the past three months. But analysts still expect positive y/y growth in both revenues and earnings next year.
Strategy I: From Fear to Less Fear. Investors were very fearful near the end of last year. They mostly feared that inflation would be persistent, forcing the Fed to raise interest rates still higher until a credit crunch and recession occurred. Wouldn’t you know it? These fears were most intense when the stock market bottomed on October 12, 2022.
One metric we use to assess investor fear is the Investor Intelligence Bull/Bear Ratio. It bottomed last year at 0.57 during the October 17 week (Fig. 1). This past summer, it rebounded to 3.06 during the July 10 week, just in time for a 10% correction in the S&P 500 that occurred from July 31 through October 27. During the November 21 week, it was at 2.36, which is a relatively neutral reading. The comparable AAII Bull/Bear Ratio followed the same script (Fig. 2).
Another interesting sentiment index is the stock-prices-lower-in-12-months series included in the monthly consumer confidence survey conducted by The Conference Board. From a contrarian perspective, it is a bit more bullish, with 36.1% of respondents expecting stock prices to be lower in 12 months according to the latest November survey (Fig. 3).
The current consensus outlook is less fearful than it was a year ago. The widespread view is that the Fed is done raising interest rates because inflation is heading in the right direction (i.e., down toward 2.0%) and that this could continue to happen without a credit crunch and recession. The drop in gasoline prices since September has been a welcome development that will help to moderate inflation and avert a recession (Fig. 4).
Geopolitical fears have also abated somewhat. Last Wednesday, China’s President Jinping Xi delivered a very dovish speech in San Francisco, as we discussed yesterday. China’s economy is a mess, reducing the risk that Xi and his comrades will invade Taiwan anytime soon. Israel and Hamas would like to destroy one another but were able to negotiate a truce for a few days to exchange Israeli hostages for Palestinian prisoners. So far, Hezbollah hasn’t joined the war.
The big debate now seems to be when and by how much the Fed will lower interest rates. The federal funds rate peaked just before eight of the past 10 recessions (Fig. 5). It plunged during all of them. The optimists (including yours truly) aren’t expecting a recession through the end of 2024, so we expect that any rate cutting by the Fed next year will be limited, maybe to two to four cuts of 25bps each. The diehard hard-landers expect that a recession in 2024 will force the Fed to cut the federal funds rate significantly. Russia’s war against Ukraine hasn’t been as threatening to the global economic outlook as it was last year.
With the benefit of hindsight, 2023 has been a year of nothing to fear but fear itself. In 2024, we may have to worry that there isn’t enough fear to temper investor optimism.
As noted above, the consumer confidence survey for November was released on Tuesday morning. The Consumer Confidence Index (CCI) was up slightly at 102.0 (Fig. 6). The percentage of respondents reporting “jobs plentiful” remained relatively high at 39.3% (Fig. 7). The “jobs hard to get” response rose to 15.4% in November from a recent February 2023 low of 10.5%, suggesting that the unemployment rate may continue to edge up as in recent months (Fig. 8).
Strategy II: Earnings Heading Our Way. Also breaking good since the end of 2022 has been the outlook for S&P 500 operating earnings per share. There was lots of pessimism over the past year, with a few influential Wall Street strategists predicting that this year’s result could break bad, i.e., below $200. We stuck with our projections of $225 for this year and $250 for 2024, which seemed farfetched (if not delusional) late last year. But then again, we were in the soft-landing camp, not the hard-landing one.
Let’s compare our forecasts to the latest consensus of industry analysts:
(1) 2023 & 2024 quarterly consensus. There was another earnings hook during Q3’s earnings reporting season. S&P 500 earnings per share turned out to be 4.1% better than expected at the start of the season (Fig. 9). However, Q4’s estimate was cut by more in response to cautious guidance by company managements as well as to the impact of the United Auto Workers’ strike. The quarterly consensus estimates for 2024 have been mixed recently (Fig. 10).
(2) 2023 & 2024 annual consensus estimates. The annual consensus estimates for 2023 and 2024 have been relatively stable so far this year. They were $220.85 and $245.98 during the November 23 week (Fig. 11). Both are about $4.00 below our forecasts (Fig. 12). Joe and I are sticking with our projections for now.
Strategy III: Estimate Revisions Activity Turns Negative. Last week, LSEG released its November snapshot of industry analysts’ consensus estimate revisions activity over the past month. While the company provides raw data for all its polled measures, we focus primarily on the revenues and earnings forecasts. We use these data to create our Net Revenues Revisions Index (NRRI) and Net Earnings Revisions Index (NERI), captured in our S&P 500 NRRI & NERI chart book.
There, the analysts’ estimate revisions activity is indexed by the number of upward revisions in forward earnings less the number of downward ones, expressed as a percentage of total forward earnings estimates. A zero reading indicates that an equal number of estimates were raised as were lowered over the past three months. We capture this activity over the past three months because that timespan encompasses an entire quarterly reporting cycle. Since analysts tend to revise their estimates to different degrees at different points in the three-month cycle, the three-month data are less volatile—and misleading—than a weekly or monthly series would be.
November’s NRRI and NERI readings come at the end of the quarterly reporting cycle, when analysts typically adjust their financial models to take into account management’s future guidance along with the just-released results. The indexes show that more analysts now are cutting than raising their revenues and earnings forecasts. That’s an about-face from earlier in 2023 when the majority were raising their revenues forecasts following the Q4-2022 season and their earnings forecasts after Q2-2023.
While that may seem to be bad news, the current readings reflect a return to normal revision activity following the extended period of abnormally high positive revisions resulting from the recovery from the pandemic shutdowns.
Furthermore, NRRI and NERI measure the net percentage of estimates raised or lowered without regard for how much those estimates were changed. While the greater cutting than raising indicates that analysts are a bit less bullish than they had been before the Q3 earnings season, that’s not to say they aren’t bullish: Their consensus y/y growth rate forecasts for revenues and earnings remain solidly positive for all of the quarters through the end of 2024.
Joe highlights what’s most notable about the November crop of revisions data below:
(1) S&P 500 NERI turns negative again. The S&P 500’s NERI index was negative in November for the first time in seven months as it weakened to a seven-month low of -5.3% from 0.6% in October (Fig. 13). November’s release is up from a 30-month low of -15.6% in December 2022 and is below the average reading of -2.2% seen since March 1985, when the data first were calculated. Looking at recent trends since the pandemic, NERI had been positive for 23 straight months from August 2020 to June 2022, and was then negative for the next 10 months through April 2023 as analysts posited that the Fed’s aggressive monetary policy would hurt earnings.
(2) Nearly all sectors now have negative NERI. There was just one S&P 500 sector with positive NERI in November, Energy (Fig. 14). That’s down from five sectors with a positive reading in October and September and down from a 13-month high of seven sectors during July. November marked the lowest count of sectors with positive NERI since April, when all 11 sectors were negative.
Looking at November versus October NERI data, all 11 sectors’ NERI weakened. The last time that all 11 sectors’ NERIs weakened on a m/m basis was in October 2022. This compares with eight sectors posting a NERI that declined m/m in October 2023.
(Such broad-based deterioration is a far cry from all 11 sectors’ NERIs improving m/m in May; but that month was unusual, as analysts then were scrambling to raise forecasts after Q1 earnings reports revealed broad-based strength. In fact, May’s revisions activity marked the broadest earnings improvement among the sectors in two and a half years, since September 2020.)
To highlight the good news about the S&P 500 sectors’ November NERI readings, nearly all remained above their lowest levels earlier in 2023. Only the Consumer Staples sector bucked that trend, with its NERI at a 13-month low.
Here’s how NERI ranked for the 11 sectors in November: Energy (11.4%, two-month low), Information Technology (-1.0, seven-month low), Communication Services (-2.6, seven-month low), Consumer Discretionary (-5.0, eight-month low), Financials (-5.1, four-month low), S&P 500 (-5.3, seven-month low), Utilities (-5.6, seven-month low), Industrials (-5.6, 10-month low), Consumer Staples (-10.1, 13-month low), Real Estate (-10.7, seven-month low), Materials (-11.2, three-month low), and Health Care (-12.5, 10-month low).
(3) S&P 500 NRRI index for revenues is negative again and at 11-month low. The NRRI index dropped for the S&P 500 to an 11-month low of -7.5% in November from -0.1% in October and is down from a 12-month high of 5.0% in July (Fig. 15). November’s negative reading is the second straight one after eight positive monthly readings through September. It comes on the heels of six straight negative readings from August 2022 to January 2023. The S&P 500’s NRRI now is below the average -0.2% reading since the index was first compiled in March 2004.
(4) NRRI index now negative for 10 sectors. NRRI’s m/m performance was about the same as that of the NERI index by all measures but one: Energy’s NRRI improved m/m versus none with improving NERI (Fig. 16).
Looking at the 11 sectors’ NRRI levels, slightly more than half remained above their 2023 lows. Among those that sank below their 2023 lows, Consumer Staples’ November NRRI reading was at a 43-month low, followed by Financials (41-month low), Real Estate (36-month low), and Utilities (30-month low).
Here’s how the sectors’ NRRIs ranked in November: Energy (14.1%, 13-month high), Utilities (-0.6, 30-month low), Industrials (-2.3, 10-month low), Real Estate (-4.6, 36-month low), Financials (-5.0, 41-month low), Health Care (-7.1, 10-month low), S&P 500 (-7.5, 11-month low), Information Technology (-8.3, 10-month low), Consumer Discretionary (-9.3, 11-month low), Communication Services (-12.4, seven-month low), Consumer Staples (-19.1, 42-month low), and Materials (-20.2, three-month low).
(5) Less Energy in S&P 500’s NRRI and NERI. Since the Energy sector can be especially volatile in terms of revisions activity, hiding trends in the broad S&P 500 index, we also like to look at the data with Energy’s data sliced out. Without the Energy sector, the S&P 500’s November NRRI reading falls to an 11-month low of -8.3% from -0.4% in October and its November NERI is negative for a second month, dropping to a six-month low of -6.3% from -0.1% in October.
As we discussed in the October 25 Morning Briefing, there are several possible reasons for the recent weakness in the revisions data. The impact of higher interest rates is now starting to be reflected in estimate revisions. Also, waning inflation may be lowering revenues as well as impacting companies’ pricing power and ultimately their earnings.
October’s NRRI and NERI readings were very close to the zero mark that indicates equal numbers of estimates rising and falling, and the index’s m/m comparisons were down only slightly; they weren’t collapsing. That suggested to us then that analysts collectively were generally satisfied with their forecasts. That takeaway had all the earmarks of a nice, gentle soft-landing, as we wrote on October 25. Now with a second month of higher net estimate cuts than increases, has our opinion changed? No. While November’s large drop could be seen as worrisome, it’s not cause for alarm, since earnings and revenue growth rates are expected to remain positive through the end of 2024.
Xi’s New Open-Door Policy
November 28 (Tuesday)
Check out the accompanying pdf and chart collection.
Executive Summary: China’s economy is hurting, and the government’s recent attempt to cozy up to the US—on display in President Xi’s recent speech—reflects a dire need for more foreign direct investment. But to get it, the government may need to change its aggressive ways. … China’s consumers are feeling the economic pain firsthand, with declining net worths affecting their spending. Two major crises led China to this juncture, one related to its flailing property market and the other to its aging and shrinking population. … US consumers, on the other hand, are flush with substantial net worth, especially the Baby Boomers.
Weekly Webcast. If you missed Monday’s live webcast, you can view a replay here.
China I: Gee, Why Does Xi Want To Play Nice? China’s economy is in a property-led and fertility-led depression. That’s bad news for China’s people and for the Chinese Communist Party (CCP) but benefits countries that import Chinese goods at depressed prices. China’s bad news is good news for the US in particular, helping to moderate goods inflation. It would be in China’s interest to attract more foreign direct investment to shore up its economy. To achieve that, the Chinese government may have to become less confrontational in matters of foreign affairs, especially vis-vis Taiwan.
That backdrop might explain why Chinese President Xi Jinping delivered a very dovish speech in San Francisco on Wednesday, November 15 at the “Welcome Dinner by Friendly Organizations in the United States” that was framed to curry favor with America and not very subtly. He started by expressing his “sincere thanks to the National Committee on U.S.-China Relations, the U.S.-China Business Council, the Asia Society, the Council on Foreign Relations, the U.S. Chamber of Commerce and other friendly organizations for hosting this event. I also want to express my warm greetings to all American friends who have long committed to growing China-U.S. relations and my best wishes to the friendly American people.”
The tone of the speech remained warm and fuzzy to the end. Xi nostalgically recalled how General Claire Lee Chennault led a group of American volunteers, known as the “Flying Tigers,” to the battlefield in China against Japan during World War II. He mentioned the word “door” twice:
(1) “I am convinced that once opened, the door of China-U.S. relations cannot be shut again. Once started, the cause of China-U.S. friendship cannot be derailed halfway. The tree of our peoples’ friendship has grown tall and strong; and it can surely withstand the assault of any wind or storm.”
(2) “The door of China-U.S. relations was opened by our peoples. For 22 years, there were estrangement and antagonism between our two countries. But the trend of the times brought us together, converging interests enabled us to rise above differences, and the people’s longing broke the ice between the two countries.”
His comments harken back to the “Open Door Policy” statement of principles initiated by the United States in 1899 and 1900 for the protection of equal privileges among countries trading with China and in support of Chinese territorial and administrative integrity.
Xi declared: “China is ready to be a partner and friend of the United States. The fundamental principles that we follow in handling China-U.S. relations are mutual respect, peaceful coexistence and win-win cooperation.”
That’s all fine. However, what about China’s island-building in the South China Sea, threats to invade Taiwan, systematic repression of ethnic minorities in Xinjiang and Tibet, and unfair business and trade practices? They weren’t mentioned. Nor was the Law on Foreign Relations of the People’s Republic of China and the Anti-Espionage Law of the People’s Republic of China, both of which went into effect in July. The former increases the risk of prosecution for complying with sanctions against China imposed by other countries—like the US—if China believes the sanctions are counter to international law. The latter grants broad powers to the state to demand information from businesses operating in China and expands the definition of activities the government considers espionage.
With rising tensions between China and most other developed nations, it’s no wonder that foreign direct investment in China has come to a screeching halt. According to a November 17 article by VOA’s Rob Garver, in Q3-2023, direct investment liabilities in China’s balance of payments—a figure that tracks the movement of money connected to foreign companies—was a negative $11.8 billion. It was the first time since data collection began in 1998 that the figure was not in positive territory.
Obviously, Xi would like American capitalists to invest in China. As discussed in the next section, China’s economy is in deep trouble. The good news is that might deter Xi and his CCP comrades from invading Taiwan anytime soon. Prices are falling in China’s depressed economy, which is helping to bring inflation down in the US and other countries that still import lots of Chinese goods. This partly explains why inflation is moderating in the US without a recession (what we call “immaculate disinflation”).
Xi even resorted to panda diplomacy during his November 15 speech. He said, “Pandas have long been envoys of friendship between the Chinese and American peoples. We are ready to continue our cooperation with the United States on panda conservation.” If relations improve between China and the US, he might send back a few pandas that were recently returned to China.
China II: Big Negative Wealth Effect. The collapse of China’s property market continues. According to a November 15 Bloomberg post, new-home prices (excluding state-subsidized housing) in 70 cities declined 0.4% m/m in October and 0.3% m/m in September, National Bureau of Statistics figures showed. October’s decrease was the steepest since February 2015. The Bloomberg data show that new and second-hand home prices are down 3.4% and 9.3% at the end of October from their August 31, 2021 peaks.
The problems for the property market—which along with related industries accounts for about 20% of China’s economy—began in 2020 when authorities laid out “three red lines.” Those rules set leverage benchmarks that builders had to meet if they wanted to borrow more money. China’s property crisis has engulfed almost all the largest developers. They have been struggling to repay debts and complete projects since a credit crunch emerged three years ago.
Such policies were intended to help curb years of excessive debt-fueled expansion by builders and property speculation by homebuyers. But they wound up tipping a record number of developers into default as refinancing costs surged.
The Shenzhen Real Estate stock price index peaked during 2020 on July 6. It is down 52.5% since then through Friday (Fig. 1). The China MSCI is down 54.5% since February 17, 2021 (Fig. 2).
Now there are signs of cracks in China’s shadow banking system. On Monday, several employees of Zhongzhi Enterprise were arrested. The privately held conglomerate operates several businesses that sold investment products to many wealthy individuals and companies in China; it has struggled for months to make promised payments to investors.
With home prices and stock prices falling, China’s consumers are experiencing a significant negative wealth effect on their spending. That is a particularly painful experience for China’s older population.
China III: Rapidly Aging Population. The Chinese economy is also weighed down by its rapidly aging population. Chinese consumers are likely to spend less and save more to offset the erosion of their wealth as their holdings in real estate and stocks depreciate. Here are a few updates on China’s demographic profile:
(1) In 2022, there were 956,000 births in China, the lowest on record (Fig. 3). That’s down 50% from 10 years ago.
(2) The fertility rate (births per woman) has been below 2.00 since 1991. It was down to only 1.16 in 2021 (Fig. 4). The Chinese aren’t having enough babies to replace themselves.
(3) As a result, the population is shrinking (Fig. 5 and Fig. 6). It peaked during 2021 at 1.41 billion. It declined by 850,000 during 2022, the first decline since 1961.
US Consumers: Mortgage-Free & Shopping. Since early 2022, the diehard hard-landers have been predicting that consumers will retrench once they run out of the excess saving that they accumulated during the pandemic. We’ve countered that there are lots of people with substantial net worth saved for retirement. Now many of them are retiring.
There has never been a generation with as much in their retirement nest eggs as the Baby Boomers. Indeed, this cohort holds about half the $154.3 trillion in US household net worth (Fig. 7).
The Baby Boomers and other households have lots of their net worth in their houses. During Q2-2023, household residential real estate totaled $44.5 trillion, matching the Q2-2022 record high (Fig. 8). Household mortgages totaled $12.8 trillion, resulting in a near-record $31.6 trillion in owners’ equity.
Since the Great Financial Crisis, the value of homes has increased faster than mortgage debt. As a result, on average, homeowners own 71.1% of their homes, up from 45.9% in Q1-2012.
Now here is the punch line: According to a November 17 Bloomberg post,” The share of US homes that are mortgage-free jumped 5 percentage points from 2012 to 2022, to a record just shy of 40%, or 35 million households. More than half of these owners have reached retirement age. Freedom from mortgage debt gives them the option to age in place—or uproot to sunnier climes.”
They also have the freedom to spend more of their earned and unearned income (such as interest and dividends) since they are free from having to pay a monthly mortgage fee. And of course, many of the 50 million homeowners with mortgages refinanced them at record-low rates during the pandemic. So their monthly payments are low.
Update: Another Roaring Twenties May Still Be Ahead
November 27 (Monday)
Check out the accompanying pdf and chart collection.
Executive Summary: Our Roaring 2020s outlook for this decade centers on the idea that technological innovations such as the so-called BRAIN technologies will be widely adopted by companies, fueling productivity growth that minimizes the economy’s major problem of a tight labor market and drives widespread prosperity. The pandemic derailed a productivity boom that started gathering steam in late 2015 and is just this year getting back on track. … We think the stock market rally that began a year ago reflects the technological revolution at the core of our Roaring 2020s scenario. … Of course, there are doubters; we address each of their main points below.
YRI Weekly Webcast. Join Dr. Ed’s live webcast with Q&A on Mondays at 11 a.m. EST. You will receive an email with the link one hour before showtime. Replays of the weekly webcasts are available here.
Productivity I: The Doubters. Is the stock market starting to discount our Roaring 2020s scenario? We think so, though we are biased, as that scenario has been our longer-term outlook since August 11, 2020, when we first outlined it in our Morning Briefing titled “Another Roaring Twenties May Still Be Ahead.” In our opinion, our upbeat scenario seems more credible now than it did in 2020 when the pandemic was disrupting all our lives.
Nevertheless, we continue to receive pushback from lots of doubters:
(1) Disrupting productivity. The doubters claim that the data have yet to convincingly confirm our underlying thesis that technological innovation is already boosting productivity growth and real incomes much as it did during the Roaring 1920s. They note that disruptive technologies often take a while to boost productivity. At first, such technologies perversely may disrupt productivity growth as they’re just starting to proliferate. In other words, the transition from old to new technologies may not be a smooth one. The doubters rightly observe that the previous productivity growth boom, during the second half of the 1990s, was also attributable to a technology revolution, yet productivity growth fizzled out during the 2000s through the mid-2010s.
(2) Hard-to-solve labor shortage problem. Our basic premise is that technology solves economic problems, particularly shortages. The latest (19th) edition of Economics (2010) by Paul Samuelson and William Nordhaus teaches students that economics “is the study of how societies use scarce resources to produce valuable goods and services and distribute them among different individuals.” This definition hasn’t changed since the first edition of this classic textbook was published in 1948.
In my Predicting the Markets (2018), I countered: “I’ve learned that economics isn’t a zero-sum game, as implied by the definition. Economics is about using technology to increase everyone’s standard of living. Technological innovations are driven by the profits that can be earned by solving the problems posed by scarce resources. Free markets provide the profit incentives to motivate innovators to solve this problem. As they do so, consumer prices tend to fall, driven by their innovations. The market distributes the resulting benefits to all consumers. From my perspective, economics is about creating and spreading abundance, not about distributing scarcity. In other words, don’t worry, be happy!”
Our basic assumption is that technology is solving the biggest economic problem we are facing, i.e., a chronic global shortage of labor, by boosting productivity. The doubters doubt that it is doing so or will. The shortage of skilled workers is particularly acute. Currently available technologies aren’t up to the challenge of replacing workers or augmenting the skills of available workers. Besides, there are lots of hyped up claims about what new technologies such as artificial intelligence (AI) can do. So say the doubters.
Meanwhile, the labor shortage may be about to be solved by the tsunami of illegal immigrants. However, they are mostly unskilled and straining the resources of state and local governments. While immigration was a source of economic growth in the past (including during the 1920s), this time it might be more disruptive than stimulative.
(3) The coming debt crisis. The doubters tend to believe that a much bigger economic problem than the shortage of labor is the looming debt crisis attributable to ballooning federal deficits. They have a good point. US fiscal policy is on a recklessly unsustainable path. However, that’s mostly a political problem, which can be solved easily enough if there is enough political will to do so. Unfortunately, it’s hard to find any such willingness currently.
Part of the solution to mounting deficits is better-than-expected economic growth with lower-than-expected inflation. A productivity growth boom can accomplish that remarkable feat. In the not-too-distant future, AI, automation, and robotics will produce more and more of the goods and services currently produced by workers. That may very well generate enough profits to pay for a basic universal income scheme and provide enough tax revenues to put fiscal policy on a more sustainable path.
(4) Messy climate change transition. Another major challenge for productivity is the bumpy transition from fossil fuels to renewable sources of energy. The federal government is implementing subsidies and penalties to force the reallocation of capital investments from the former to the latter. Governments have a poor record of allocating resources, especially compared to free markets.
For example, Detroit has responded to the government’s pressure by spending lots of capital on EVs only to find that consumers aren’t widely embracing this new technology. Government subsidies have stimulated most of the sales of these relatively expensive alternatives to gasoline-powered vehicles (GVs). Perversely, there are enough EVs on the road today to reduce the demand for gasoline, which lowers the price of gasoline and makes EVs an even less compelling alternative to GVs!
Productivity II: Is Tech Ready for Primetime? Jackie and I have been writing about disruptive technologies for some time, usually in our Thursday Morning Briefing commentaries. (See our archive of Disruptive Technologies Briefings.) The awesome range of futuristic “BRAIN” technological innovations includes biotechnology, robotics and automation, artificial intelligence, and nanotechnology. There are also significant innovations underway in 3-D manufacturing, EVs, battery storage, blockchain, and quantum computing.
Consider the following stats on technology capital spending in the US: High-tech spending on IT equipment, software, and R&D rose to a record $1.84 trillion (saar) during Q3-2023 (Fig. 1). It has hovered around a record 50% of total capital spending in nominal GDP since the pandemic, up from about 25% during 1980 (Fig. 2). During Q3-2023, R&D accounted for 20.2% of capital spending in nominal GDP, while software represented 17.2% and information processing equipment 12.1% (Fig. 3 and Fig. 4).
I first started to write about the High-Tech Revolution in 1993. In 1995, I wrote a Topical Study titled “The High-Tech Revolution in the US of @.” I argued that technology capital spending was another reason to believe that the productivity growth trend was likely to rise, which implied that inflation could continue to fall even as the unemployment rate fell below levels that many traditional macroeconomists believed might revive inflation. During the second half of the 1990s, productivity growth did increase significantly. However, much of that was attributable to the boom in the output of computers and communications equipment (Fig. 5). Of course, spending on software also boomed.
The first wave of the High-Tech Revolution boosted the productivity of the tech sector, which experienced booming demand for hardware and software. However, it had a limited impact on the productivity of other businesses. That’s because the gains applied mostly to companies that could replace lots of secretaries on IBM Selectric typewriters with Microsoft Word and lots of bookkeepers with Microsoft Excel spreadsheets. On the other hand, companies using the new technologies needed large IT departments to install and maintain their new PCs and software programs.
In Predicting the Markets, I observed: “In the past, technology disrupted animal and manual labor. It sped up activities that were too slow when done by horses, such as pulling a plow or a stagecoach. It automated activities that required lots of workers. Assembly lines required fewer workers and increased their productivity. It allowed for a greater division of labor, but the focus was on brawn. Today’s ‘Great Disruption,’ as I like to call it, is increasingly about technology doing what the brain can do, but faster and with greater focus.” That’s what the BRAIN technologies do.
As a result, the second wave of the Great Disruption is much more widespread because the associated new technologies available are more powerful, cheaper, more user friendly, and require fewer IT personnel to install and maintain than those of the first wave. For example, thanks to cloud computing, software updates happen automatically without the need to physically install them on each user’s computer.
The bottom line is that today’s technologies can be used by every sort of business to boost productivity. In this sense, every company is now a technology company no matter whether they supply the technologies or just use them.
Productivity III: The Growth Cycle. In our opinion, the latest productivity growth boom cycle started well before the pandemic, at the end of 2015. During Q4 of that year, the 20-quarter annual average growth rate of productivity was only 0.6%, the slowest pace since the end of 1982 (Fig. 6). It almost tripled, rising to 1.6%, through Q4-2019, just before the pandemic. The pandemic at first boosted productivity growth (when layoffs soared), but then depressed it (when quits soared).
During Q3-2023, this measure of productivity growth was back up to 1.8%. We think it is heading to 3.5%-4.5% by the end of the decade. That might seem far-fetched (maybe even delusional), but our heady targets are consistent with the comparable peak growth rates of the past three productivity boom cycles. And this one has more going for it, in our opinion, as noted above.
The doubters point out that productivity is volatile and prone to significant revisions. They are right about the q/q and even the y/y comparisons, which is why we focus on the 20-quarter annual average growth rate in this variable (Fig. 7).
Of course, productivity can be revised either up or down. During the late 1990s, it was revised higher, confirming our optimistic view back then. During Q2-2023, it was revised up a tad from 3.5% to 3.6% (saar). During Q3-2023, the initial estimate showed increases of 4.7% q/q (saar) and 2.2% y/y. In other words, the latest two quarters are consistent with the Roaring 2020s scenario.
Productivity IV: Driving Prosperity. Often in the past, we’ve shown in the past that the data on productivity and real hourly compensation compiled by the Bureau of Labor Statistics (BLS), both measured at a 20-quarter average annual rate, track one another closely (Fig. 8). That’s because the former drives the latter, as every student of microeconomics knows: Real wages are determined by productivity, i.e., W/P = Z. That’s both in theory and in practice, based on our analysis of the data.
Often forgotten is that the price deflator should be the one that reflects the prices received by business employers rather than the one that measures prices paid by consumers. Accordingly, we use the nonfarm business deflator to inflation-adjust hourly compensation; we have long disagreed with BLS’s practice of reporting real hourly compensation using the CPI. That measure shows a widening gap between productivity and real hourly compensation starting in the early 1970s (Fig. 9). The gap has been widening at a slower pace using the personal consumption expenditures deflator and even less so using the nonfarm business deflator.
By the way, while real hourly compensation growth did stagnate from the early 1970s through the mid-1990s, especially when deflated by the CPI; it mostly has been rising since then to record highs. The claim made by progressives that real wages of workers have stagnated for decades simply is not supported by the data.
In any event, if our Roaring 2020s productivity growth boom unfolds as we predict, then real hourly compensation’s growth will also experience a growth boom. The latter is among the best measures of consumers’ purchasing power, i.e., the standard of living. A chronic labor shortage that is offset by productivity gains means that real incomes will be driven more by real wages than by labor force growth. That’s bullish for real GDP growth.
It also means that wages will rise faster than prices without triggering a wage-price spiral. The Phillips Curve model is wrong because it fails to recognize the importance of productivity. Consumer prices can disinflate and even deflate in a tight labor market if the labor shortages cause business to boost productivity rather than prices. That’s what is happening now. There doesn’t have to be an inverse relationship between inflation and unemployment. That’s because there is a stronger negative relationship between the unemployment-rate cycle and the productivity-growth cycle (Fig. 10). A tight labor market can boost productivity, which allows nominal and real wages to increase while keeping a lid on price inflation.
There is also a strong positive correlation between unit labor costs (ULC), which is the ratio of hourly compensation to productivity, and the CPI headline inflation rate on a y/y basis (Fig. 11). That makes sense since P = W/Z = ULC is the simple variation on the equation above. ULC inflation was down to 1.9% y/y during Q3, suggesting that the CPI inflation could fall from 3.2% closer to 2.0%—i.e., the Fed’s inflation target—sooner than widely expected.
The bottom line: Productivity drives prosperity and should do so during the Roaring 2020s.
Consumers: They Should Be Less Miserable. So why is the Consumer Sentiment Index so depressed (Fig. 12)? It fell to 61.3 in November, well below its average of 82.9 since January 1978. In the past, it was inversely correlated with the Misery Index, which is simply the sum of the unemployment rate and the CPI inflation rate on a y/y basis. The latter was down to a relatively low reading of 7.1% in October, well below its average of 9.5%.
Consumers may be suffering from money illusion. They realize that inflation is moderating, but consumer prices remain much higher than before the pandemic. What they aren’t realizing is that their wages have also risen, though not as quickly as prices until this year. Since the start of this year, their wages on the whole have been rising faster than prices. Real wages seem to be back on their uptrend that started in 1995 (Fig. 13).
Perhaps the drop in consumers’ outlays on gasoline since the summer will cheer them up. The average household’s spending on gasoline was about $1,000 less at an annual rate during September than during June partly; that’s because they drove less and partly because the price of gasoline has been falling and continued to do so in October and November (Fig. 14).
Strategy: Roaring 2020s Is Buoying Stocks Already. We think our Roaring 2020s scenario explains the stock market rally since October of last year. In our November 3, 2022 Morning Briefing, Jackie and I wrote that “AI is gaining momentum” and that “it will lead to a new surge in corporate productivity.
We observed: “Microsoft reportedly is considering adding to the $1 billion investment it made in OpenAI in 2019, an October 20 WSJ article reported. The two companies have preexisting relationships.” Microsoft was trading at $227 per share when we wrote about AI back then. It closed at $377 on Friday. The AI-related stocks, especially the MegaCap-8—i.e., Alphabet (Google), Amazon, Apple, Meta (Facebook), Microsoft, Netflix, NVIDIA, and Tesla—have been leading the bull market ever since.
By the way, the S&P 500’s forward P/E is inversely correlated with the Misery Index (Fig. 15). The plunge in the latter from 12.7 in June 2022 to 7.1 during October helps to explain why the forward P/E rebounded from 15.3 on October 12, 2022 to 19.0 on Friday. So the stock market also has been rising on the realization that inflation can come down without requiring a significant increase of the unemployment rate.
Oil, Stocks & 3-D Hand Printing
November 21 (Tuesday)
Check out the accompanying pdf and chart collection.
Executive Summary: In the spirit of the season, Jackie reflects on two sources of US investors’ gratitude—lower fuel prices and the stock market rally. … A confluence of factors has driven down fuel prices as Americans set out on their Thanksgiving travels, including record-high US oil production and lower-than-expected demand from China. … Interest-rate-sensitive industries have outperformed in recent weeks’ stock-market rally as investors lay bets that the Fed is done tightening. The rally has bumped three S&P 500 sectors to ytd gains above 30%. … And our Disruptive Technologies focus: hand-softening technology for robots, courtesy of 3-D printing.
Energy: Thankful for the Low Price of Gas. Many of us will be hitting the road—or the sky—this week to celebrate the Thanksgiving holiday with friends and family. We’ll be joining the 49.1 million Americans planning to travel by car to their Thanksgiving celebrations this year and another 4.7 million planning to travel by plane, according to AAA estimates.
If those estimates are on target, travel by car will still be 1.6% lower than just before the pandemic during Thanksgiving 2019, while air travel will be 2.5% higher. Those traveling by car will benefit from the decline in the price of gasoline to a recent $3.47 per gallon, down from a 2023 high of $4.00 and a 2022 peak of $5.11 (Fig. 1).
Gasoline prices have fallen in step with the price of Brent crude oil futures, which at $80.61 per barrel have fallen from a high of $96.55 this year and $127.98 in 2022 (Fig. 2). Supplies never got as tight as expected earlier this year, in part because the Chinese economy never recovered as strongly as was once expected. Now the market is waiting to see if OPEC+ will announce additional production cuts at its meeting on Sunday, November 26.
Until then, let’s take a look at some of the variables impacting the oil market:
(1) US production at record levels. The US fracking miracle continues. US production of crude oil hit record levels in October, extending into November, with 13.2 mbd produced, surpassing the 12.9 mbd produced at the pre-pandemic peak in 2019. The amazing thing about the surge of production is that it has occurred using far fewer drilling rigs: 500 as of the November 17 week, compared to 877 in January 2019 (Fig. 3).
With production booming, US crude oil & petroleum product imports are flat and exports have grown to 10.9 mbd, up from 10.1 mbd at the 2019 peak (Fig. 4). In addition, the level of US crude oil and petroleum product inventories is running higher than it has in the past two years by 34.8 mbd (Fig. 5).
Putting a floor under the price of oil is the Biden administration’s desire to refill the Strategic Petroleum Reserve. The administration aims to buy six million barrels of crude oil for delivery in December and January at prices of $79 per barrel or less, an increase from the $70 a barrel the agency previously was willing to pay, according to an October 19 Reuters article quoting the US Department of Energy.
(2) China demand underwhelms. The Chinese economic rebound from the pandemic hasn’t been nearly as strong as expected. Economic growth continues to be limited by excess leverage and a real estate crisis that has left millions of unfinished apartments weighing on the market.
The country’s demand for oil hasn’t met bullish expectations. The International Energy Agency expected China’s demand for oil would rise by 1.8mbd this year, but in the first 10 months of 2023 demand has only risen by 1.2mbd to 11.4mbd, a November 20 Reuters article reported. The latest bearish sign comes from Chinese refiners, which began building inventory by more than half a million barrels a day in October. The inventory build was a reversal from September’s inventory drawdown.
(3) Small surpluses forecast. The amount of excess global supply of oil isn’t very far above demand, according to the EIA data. Between now and the end of next year, global oil supply is expected to exceed demand by a total of 0.57mbd on world consumption that exceeds 101mbd.
Here’s the EIA’s forecast for the change in global oil stocks: Q3-2023 (-0.9mbd drawdown), Q4-2023 (0.20mbd build), Q1-2024 (-0.13mbd drawdown), Q2-2024 (0.16mbd build), Q3-2024 (0.16mbd build), and Q4-2024 (0.27mbd build).
(4) All eyes on OPEC+. Hopes that OPEC will cut production at its meeting later this month helped the price of Brent crude oil futures bounce off the low of $77.42 last Thursday to $82.35 on Monday. OPEC+ has already pledged to cut oil production by 3.66mbd, and Saudi Arabia and Russia have a voluntary agreement to cut an additional 1.5mbd of production.
A frequently cited Reuters article quoted a mixture of opinions about what will happen at the meeting from anonymous OPEC+ sources. “One OPEC+ source, who declined to be named, said the existing curbs might be not enough and the group will likely analyse if more could be implemented when it meets. Two other OPEC+ sources said deeper cuts could be discussed … [T]wo other OPEC+ sources said it was too early to say whether further cuts will be discussed, while another said he did not think it was likely with the caveat to ‘wait and see,’” the November 17 Reuters article reported.
(5) Global uncertainties. The price of crude is surprisingly subdued given all the geopolitical uncertainties that potentially threaten the market.
The US and EU are still trying to determine how to enforce the price cap placed on Russian oil after Russia invaded Ukraine. The US Treasury Department took a step in that direction by imposing sanctions on three Emirati shipping companies for transporting Russian oil sold at prices above the $60-per-barrel limit. Meanwhile, Russia has lifted its restrictions on the export of gasoline because it has excess supplies. The ban was initially put in place on September 21 to reduce high domestic prices and shortages.
The US government is considering tightening Iranian sanctions in response to Iran’s support of Hamas in its war with Israel. The US may target Iran’s oil industry with the goal of removing about 1mbd of Iranian oil exports. The Israel/Hamas war may also impact the outcome of the OPEC+ meeting. “An additional OPEC+ cut of up to 1mbd could be on the table, one informed person said, describing the cartel as ‘galvanized’ by the conflict,” a November 17 FT article reported.
Strategy: Thankful for the Rebound. The S&P 500 has bounced almost 10% from its October 27 low through Friday’s close, giving us something to be thankful for as the market approaches its highest levels of 2023. While technology-related names continue to outperform, interest-rate sensitive areas are also showing signs of life, reflecting growing hopes that the Federal Reserve is finished raising interest rates.
Here’s the performance derby for the S&P 500 and its 11 sectors, from the October 27 low through Friday’s close: Information Technology (13.8%), Consumer Discretionary (11.9), Communication Services (11.4), Financials (11.2), Real Estate (11.0), S&P 500 (9.6), Industrials (9.2), Materials (7.0), Utilities (5.5), Consumer Staples (4.1), Health Care (4.1), and Energy (-0.8) (Fig. 6).
Some of the themes that stand out from the performances of various S&P 500 industries’ price indexes during the bounce and so far this year include:
(1) Bets on lower rates pay off. Two interest-rate sensitive sectors have been jolted to life since the market hit its October lows: Financials and Real Estate. Some of the S&P 500 Financials industries with the best performance since October 27 include: Regional Banks (17.2%), Asset Management & Custody Banks (15.7), Diversified Banks (15.1), and Investment Banking & Brokerage (14.6). In the Real Estate sector, outperformance came from Real Estate Services (17.6%), Single-Family Residential REITs (16.4), Telecom Tower REITs (15.1), Hotel & Resort REITs (14.1) Self Storage REITs (13.5), and Industrial REITs (13.1).
The improved interest-rate outlook undoubtedly helped the S&P 500 Homebuilding industry rise 22.7% since October 27, making it the top performing industry in the S&P 500 over that time period. The Home Building Products industry also performed well, rising 15.7%.
Conversely, the recent subdued readings on inflation hurt the S&P 500 Gold industry’s stock price index, which has fallen 6.7% from the October low, making it the worst performing industry in the bunch. Other weak performances were turned in by oil-related industries, including Oil & Gas Equipment & Services (-4.5%), Oil & Gas Exploration & Production (-2.3), and Integrated Oil & Gas (-0.4).
(2) 2023 on verge of being a great year. The gains over the past month have lifted the ytd performances of several sectors to truly impressive heights—north of 30%—as the year draws to a close. Here’s where the S&P 500 and its sectors stand on a ytd basis with just a few more weeks left to go in the year: Information Technology (49.5%), Communication Services (48.9), Consumer Discretionary (31.7), S&P 500 (17.6), Industrials (7.2), Materials (3.1), Financials (2.0), Real Estate (-3.2), Energy (-4.3), Health Care (-5.9), Consumer Staples (-6.0), and Utilities (-12.2) (Fig. 7).
There is a huge chasm between the ytd winners and the losers. The industry indexes with the best ytd performances through Friday’s close are: Semiconductors (92.8%), Interactive Media & Services (79.5), Broadline Retail (68.5), Automobile Manufacturers (67.3), and Application Software (52.2). Each of those industries is very tech-related, including Automobile Manufacturers, which is dominated by Tesla, and Broadline Retail, which includes Amazon.
Meanwhile, the worst performing industries ytd are Personal Care Products (-49.8), Drug Retail (-43.2), Independent Power Producers & Energy Traders (-40.9), Regional Banks (-35.4), and Leisure Products (-26.0). Fortunately, the tech-related industries—with member companies that include Amazon, Alphabet, Meta, Nvidia, and Tesla—have a much larger market cap and impact on the S&P 500 than the underperforming industries, which hold the much smaller stocks of Estee Lauder and Hasbro (Fig. 8).
Disruptive Technologies: 3D Printing Gives Flexible Robotics a Hand. A new method of 3-D printing can create flexible products, including for use in robotics. Human-like robotic hands and artificial organs can be built using this new method, according to researchers at ETH Zurich, a Swiss university; MIT; and Inkbit, a startup company spun out of MIT.
Traditional 3-D inkjet printing uses a material that dries quickly and is then scraped to eliminate any imperfections before the next layer of material is deposited. The end product is stiff, and that’s not useful when it comes to developing something like a robotic hand.
Inkbit developed the new 3-D printing method, called “vision-controlled jetting” (VCJ) technology. Instead of scraping away imperfections, the printer includes “an AI-enabled 3D computer vision scanning system” that visually checks the item being produced for imperfections. When it notices an imperfection, the machine calculates how the next layer of material needs to be deposited to correct the imperfection. “This means that instead of smoothing out uneven layers, the new technology simply takes the unevenness into account when printing the next layer,” a November 15 article on ETH Zurich’s website.
The new printer doesn’t need to use fast-drying materials when building an object because there’s no scraping involved. VCJ can use slow-drying polymers that are more flexible, which dramatically increases the types of objects that can be 3-D printed. The new method also allows hard and soft elements to be printed in an object simultaneously. Researchers used the new printing method to create a 3-D printed robotic hand, with bones, ligaments, and tendons each made of different materials. The slow-drying materials used in the hand allow it to curl when grabbing an object and then uncurl, returning to its original shape. Here’s a video explaining and demonstrating the technology.
The ability to print using different materials has made the assembly process less “hands on”: No human needs to assemble the various pieces of the artificial hand. More details about the hand and other products built using VCJ—including a walking robot and a pump mimicking a heart—appear in a November 15 study in Nature.
Thanksgiving
November 20 (Monday)
Check out the accompanying pdf and chart collection.
Executive Summary: Americans have many blessings to count this week: Real GDP is at a record high; so are real consumption per household, real wages, and household net worth. Thanks to our Founding Fathers, no other country cultivates entrepreneurial capitalism as well as America. … Also: Joe finds that the leadership of the stock market rally has shifted away from large-cap and Growth stocks since last Monday. That follows the script of stock market rallies generally: They get off the ground with the strongest leaders, then broaden out to include other capitalization sizes and investment styles.
YRI Weekly Webcast Will Be Back Next Week. Join Dr. Ed’s live webcast with Q&A next Monday, November 27, at 11 a.m. EST. You will receive an email with the link one hour before showtime. Replays of the weekly webcasts are available here.
Giving Thanks. My team and I wish you a very happy Thanksgiving Day with your family and friends. It’s a great holiday for sure. We eat and drink and go into food shock. Turkey contains tryptophan, which promotes “good sleep and a good mood,” according to Healthline.com. “Tryptophan is one of several essential amino acids, which are considered the building blocks of proteins in animals and plants. Specifically, tryptophan is involved in the production of serotonin (a hormone that helps regulate mood) and melatonin (a hormone that helps regulate your sleep cycle).” Healthline cites research published in Neuroscience and Biobehavioral Reviews and a study published in the journal Nutrients.
The day after Thanksgiving, we recharge by going shopping on Black Friday. Shopping releases dopamine in our brains, which makes us feel good. Studies have shown that it is actually the anticipation of buying things that gives us the high. Many people get a bigger charge from ordering online than from going to stores. (See the Psychology Today article “Shopping, Dopamine, and Anticipation: What monkeys have to teach us about shopping.”)
We will be recharging by publishing the Morning Briefing on Monday and Tuesday and taking the rest of the week off. Dr. Ed’s webcast will be back on Monday, November 27.
We would like to thank you for your interest in our research service and look forward to working with you in 2024. We suggest avoiding controversial subjects at the dinner table on Thursday. Instead, talk about Yardeni Research and our spot-on forecasts in 2023 with your families and friends. Tell them how they can sign up for a four-week trial. Thank you.
We also would like to thank our Founding Fathers for founding this great country. There’s no better place for entrepreneurial capitalists to flourish in a free-market economic system with checks and balances on the political system. As they flourish, they increase the standard of living of most Americans by providing better goods and services at lower prices. Various measures of national prosperity confirm this conclusion. Real GDP is at a record high (Fig. 1). Real consumption per household is at a record high (Fig. 2). Measures of real wages are at record highs (Fig. 3). Household net worth is at a record high. Thank goodness.
Share our upbeat view of the American economy with your family and friends by giving them Dr. Ed’s In Praise of Profits for Hannukah, Christmas, or Kwanzaa. They will thank you for it.
Strategy: SMidCaps Are Showing Signs of Life, Finally. The S&P 500 peaked at 4888.96 on July 31. In the three months that followed, many S&P indexes experienced double-digit percentage declines. This includes the indexes grouped by stocks’ market-capitalization size and those defined by investment style (Growth or Value). On October 27, they and their associated equal-weighted S&P indexes all bottomed.
Initially, the rally off that bottom was powered largely by the S&P 500 LargeCap index; that continued through the close of trading last Monday, November 13. The next morning, October’s CPI was released showing continued moderation of inflation and buoying the odds that the Fed is done tightening monetary policy. Since then, investors have poured into the SmallCap and MidCap indexes (a.k.a. the “SMidCaps”), with a preference for Value over Growth:
(1) SMidCaps outperformed LargeCap following CPI release. The S&P SmallCap 600 has risen 5.2% since last Monday, ahead of the 4.1% and 2.3% gains for the S&P MidCap 400 and S&P LargeCap 500 (Fig. 4). On an equal-weighted basis, SmallCap’s 5.4% advance beat those of MidCap (4.6%) and LargeCap (3.4%). The MegaCap-8 index (composed of Alphabet, Amazon, Apple, Meta, Microsoft, Netflix, Nvidia, and Tesla)—which led the initial rally from October 27 until November 13—since has trailed the three market-capitalization indexes with a gain of only 2.1%.
(2) Investors favoring Value over Growth? The SMidCap’s Value and Growth style indexes also outperformed those of LargeCap, with Growth getting the nod ahead of Value across all three market-capitalization styles. SmallCap Value rose 5.6%, ahead of SmallCap Growth’s 4.6% rise. Within the MidCap index, Value’s 5.1% rise beat Growth’s 3.3% gain. LargeCap Growth gained 1.8% but lagged the 3.0% rise for its Value counterpart (Fig. 5).
(3) Rising tide lifting all boats now. We’re not too concerned about the recent relative weakness in the performance for the S&P LargeCap 500 and its Growth index. That’s because a typical market rally begins with the strongest leaders—i.e., the MegaCap-8—and later broadens to include companies in other investment-style spectrums.
With investors cheering the rapid decline in the inflation rate and slightly weaker employment readings, they’re now surmising that the Fed’s next step will be to lower interest rates in 2024. The hope is that lower interest rates will help keep the economy out of a recession. That’s bullish for all stocks.
Whether the recent market leadership shifts mark an end to Growth’s domination over Value remains to be seen, so it’s more important now than ever to watch how the two styles perform in terms of earnings expectations and reported results over the next several years. We will be doing so.
Retailers, Semis & Quantum Computing
November 16 (Thursday)
Check out the accompanying pdf and chart collection.
Executive Summary: With consumers employed and feeling flush, the holiday selling season is starting off well. The recent quarterly earnings reports of a few big retailers were mixed, with TJX reporting good customer traffic while Home Depot and Target beat expectations. ... Also: The S&P 500 Semiconductor industry’s price index has nearly doubled this ytd! But while some of its member stocks have posted outsized ytd gains, others have ytd drops. Jackie explores what’s fueling the price action. … And: Quantum computing is advancing by leaps and bounds. So is AI. Combine the two, as some companies are doing, and the innovation potential is astronomical.
Consumer Discretionary: Still Shopping. The US consumer continued to spend at a healthy clip last month, helped by plentiful jobs, a drop in the price of gasoline, and moderating inflation. While high interest rates may restrain spending on expensive goods requiring financing, October’s sales levels represent a solid launch to the holiday shopping season.
US retail sales fell by 0.1% in October, the first decline in seven months. However, the picture is brighter viewed against the backdrop of surprisingly strong spending in September, when sales increased 0.9% (Fig. 1). Core retail sales—which excludes the sales of automobiles, gasoline, building materials, and food services—rose 0.2% in October following an upwardly revised 0.7% increase in September (Fig. 2).
The latest data show consumers continued to spend at clips higher than a year ago in restaurants (up 8.6% y/y), online (9.3), in pharmacies (8.4), and at warehouse clubs (2.7). Conversely, sales continued to fall in home-related areas like furniture and home furnishing stores (-11.8) and building materials and garden equipment (-5.6) (Fig. 3, Fig. 4, and Fig. 5). (Percent changes for restaurants, furniture & home furnishing, and building materials & garden equipment are through October; online, warehouse clubs, and pharmacies are through September.)
In recent days, Home Depot and Target reported declining revenue but results that beat analysts’ expectations, while TJX—the strongest of the three retailers—reported a strong increase in quarterly results and signaled optimism about the holiday selling season. Here’s a look at what their managements had to say on their recent earnings reporting conference calls:
(1) TJX’s outperformance continues. TJX reported strong results for its fiscal Q3 (ended October 28). Marshall’s and TJ Maxx stores in the US collectively posted a 7% jump in same-store sales and US HomeGoods stores a 9% increase, with all the gains resulting from higher customer traffic, not price increases. TJX’s total sales rose 9.0% y/y to $13.3 billion, and adjusted earnings per share rose 20% y/y, both better than expected. Margins improved from the year-earlier quarter’s, and inventories were flat y/y
TJX management said the current quarter is off to a “strong start” but gave fiscal Q4 (ending January 31) earnings guidance of $1.07-$1.10 a share, shy of analysts’ $1.13 a share consensus estimate. TXJ raised its fiscal 2024 guidance for the third time this year, a November 15 CNBC article reported, to earnings per share of $3.71-$3.74, up from the previous $3.66-$3.72 range. Analysts already had been expecting EPS in the new range, with a consensus of $3.73, CNBC relayed.
TJX shares, which were up 16.2% ytd through Tuesday’s close, fell by a bit more than 2% on Wednesday after the earnings report.
(2) Home Depot & Target EPS: gloomy but better than expected. Shares of Home Depot and Target both rallied after they reported earnings that beat analysts’ consensus estimates but signaled that both retailers face headwinds.
Home Depot reported earnings per share of $3.81 for the quarter ended October 28, better than analysts’ consensus estimate of $3.76 but lower than the $4.24 a share reported a year ago. Likewise, revenue of $37.7 billion was a touch higher than the $37.6 billion expected but still down from the $38.9 billion last year. Same-store sales declined 3.1% y/y, better than the 3.6% expected but still down sharply, a November 14 CNBC article reported.
High interest rates and rising inflation have put a dent in home sales and renovations, hurting the home improvement retailer’s results. Perhaps new competitors, like Floor & Décor and UK-based Wren Kitchens, have weighed on sales as well? Home Depot shares have risen roughly 7% since reporting results on Tuesday, but remain in negative territory ytd, down 2.4%.
Target’s earnings improved dramatically from the year-earlier level, thanks to easy comparisons. In the year-ago quarter, the company held large sales to move bloated inventories. The retailer’s earnings for Q3 (ended October 28) came in at $2.10 a share, better than analysts’ expectations for $1.48 a share and up sharply from $1.54 earned in the year-ago quarter.
However, in a sign that all isn’t well, Target’s total Q3 revenue was $25.4 billion, a bit better than the $25.3 billion analysts expected but below the $26.5 billion in revenue reported in the year-ago period. Q3 same-store sales fell 4.9% y/y, and digital sales fell 6% y/y. The current quarter’s results aren’t expected to be much better, with Q4 same-store sales expected to drop in the mid-single-digits. Investors opted to look on the bright side of the earnings report and sent Target’s shares higher by almost 18% on Tuesday; but even after those gains, shares remain 12.5% lower ytd.
Technology: Semis Making New Highs. The S&P 500 Semiconductors stock price index hit an all-time high on Tuesday, bringing its ytd gain to a shocking 90.9% through Tuesday’s close (Fig. 6). But the ytd performances of the industry’s members vary widely, from Texas Instruments’ 9.3% decline to Nvidia’s gain of 239.8%, driven by the company’s industry-leading position in chips for artificial intelligence (AI).
Here’s a quick look at what’s been fueling investor optimism:
(1) Industry recovery underway. Investors began the year fretting about an industry downturn but are ending 2023 optimistic that industry sales are recovering. Global semiconductor sales rose 1.9% m/m in September, marking the seventh month in a row of m/m sales increases, the Semiconductor Industry Association reported on November 1. On a y/y basis, September’s sales declined by 4.5% (Fig. 7). (Data reflect a three-month moving average.) Geographically, m/m sales rose in all regions except for Japan: Asia Pacific/All Other (3.4%), Europe (3.0), Americas (2.4), China (0.5), and Japan (-0.2).
(2) Earnings on the upswing. As sales have improved, analysts’ expectations for the industry’s financial results have grown increasingly optimistic (Fig. 8). Consensus expectations for revenues and profits reflect declines this year, of 1.8% and 6.3%, but resumed growth in 2024, of 16.9% and 32.2% (Fig. 9 and Fig. 10). The industry’s forward P/E of 24.9 remains elevated but should fall as earnings recover (Fig. 11).
(3) Some positive news to boot. Investors were heartened last week by the earnings report of Taiwan Semiconductor Manufacturing. The contract manufacturer reported that October sales climbed 15.7% y/y and 34.8% m/m. It was the company’s first month of y/y growth since February, a November 14 Barron’s article reported.
Investors were also glad to see that Nvidia has developed three chips for AI that it should be able to sell into the Chinese market. The US government has restricted the sale of some of Nvidia’s most sophisticated chips into Chinese markets to prevent China’s AI development. The performance of Nvidia’s new chips “has been moderated compared with those that Nvidia had previously sold in China … Nonetheless, the new graphics processing units were expected to remain competitive in the Chinese market,” a November 9 FT article reported.
Disruptive Technologies: Quantum Computing Developments. While AI has become the tech world’s darling, the progress in quantum computing continues. Quantum computers are growing more powerful, and scientists have begun musing about what amazing things quantum computing and AI can produce together. Meanwhile, there have been some disconcerting claims that quantum computing power has managed to crack the security algorithm that keeps our data safe.
Here’s a look at some of the recent headlines:
(1) The power of quantum & AI. The combination of quantum computers with AI software should allow us to tackle problems that aren’t solvable using today’s systems. “It involves the development of algorithms that take advantage of quantum properties to solve AI-related tasks,” explains an October 9 essay at Medium.com. Quantum computers can handle “large datasets and [perform] complex optimizations. This allows AI systems to learn and adapt more quickly, making them more proficient in tasks like image recognition and natural language processing.”
AI often is used to solve optimization problems, like route planning and resource allocation. And those are problems that are efficiently handled by quantum computers, as well. As one recent headline quipped: “If you think AI is terrifying, wait until it has a quantum computer brain.”
Moderna and IBM are already combining the two powerful technologies. They announced earlier this year that they’ll work together using quantum computing and AI to design mRNA medicines. “We are aiming for breakthrough advances with quantum computing, so we are investing now in building a quantum-ready workforce, to be fully prepared to harness the power of this technology,” said Moderna CEO Stéphane Bancel.
(2) Never too many quibits. Quantum computers use quibits to store and process information. Simply put, the more quibits the better. Quantum computers have made quibit-maximizing strides in recent years. Just last month, startup company Atom Computing claimed to have developed a quantum computer with 1,180 quibits, far surpassing IBM’s Osprey machine’s 433 quibits, according to an October 24 article in New Scientist.
Atom’s computer uses neutral atoms trapped by lasers in a two-dimensional grid instead of the super conducting wires cooled to extremely low temperatures used by companies like IBM and Google. Atom’s system lets it add many more quibits. Atom CEO Rob Hays said the company aims to multiply by 10 the number of quibits in its machine every couple of years. Its system also can run error-free for longer than others. Atom aims to have the computer available for customers to use via the cloud by next year.
IBM is working on Condor, a quantum computer with 1,121 quibits. It’s also partnering with the University of Tokyo and the University of Chicago to develop a “quantum-centric” supercomputer powered by 100,000 quibits. The 10-year, $100 million program is expected to include the Argonne National Laboratory and Fermilab National Accelerator Laboratory, according to a May 21 press release.
Separately, Google and PsiQuantum are looking to build 1 million quibit computers. With that many quibits, the computer could still be extraordinarily powerful even if some quibits are out of service because of errors. To build machines with this many quibits, the systems will need to become far more energy efficient, a May 25 article in MIT Technology Review reported.
(3) Cracking the code. A quantum computing developer claims that he’s broken RSA, the security code that keeps some of our most important information safe. Ed Gerck, who works for his own firm, claimed on LinkedIn that he used a cell phone and a commercial Linux desktop computer to break the code at a cost of less than $1,000, a November 1 article in Bankinfo Security reported.
Many are skeptical. Gerck develops cryptography, which he says can be used to replace RSA, a November 3 Tom’s Hardware article reported. “This would be handy if his RSA-2048 cracking claims are correct. Naturally, that also raises the question of whether this ‘crack’ is merely a publicity stunt for his product.”
It’s expected that in the future those with quantum computers more powerful than today’s will be able to break RSA code. In anticipation of that day, a more robust security system, called “CNSA 2.0,” is being rolled out throughout the government starting in 2025 and continuing through 2030. Cloud computing giants already have started transitioning to the more robust security protocol. They may need to move faster given how fast quantum computing power is advancing.
Transitory After All
November 15 (Wednesday)
Check out the accompanying pdf and chart collection.
Executive Summary: It’s no longer debatable: October’s headline and core CPI excluding shelter reveal that inflation has turned out to be a transitory rather than persistent problem. Rent-of-shelter inflation and nonhousing services inflation are coming back down to Earth more slowly but surely too, as the pandemic effects lifting them all are finally dissipating. … Treasury Secretary Yellen said that the supply of Treasuries didn’t push yields up in October, yet her actions easing supply concerns speak louder. … Also: Small business owners have plenty of job openings but not enough qualified job applicants. …. And: Joe finds just a handful of big companies account for lowered S&P 500 Q4 earnings expectations.
Inflation: Back to 2.0%. You read that right: Inflation is back to 2.0%. That’s based on October’s CPI less food, energy, and shelter on a y/y basis (Fig. 1). Excluding only shelter, the CPI inflation rate was even lower at just 1.5%. You might be thinking: “Why are economists always taking out what doesn’t support their story? After all, the headline and core CPI inflation rates were 3.2% and 4.0% in October” (Fig. 2).
Good point, but there is good reason for taking out shelter at least. Here it is as explained by Fed Chair Jerome Powell in his Jackson Hole speech on August 25:
Because leases turn over slowly, it takes time for a decline in market rent growth to work its way into the overall inflation measure. The market rent slowdown has only recently begun to show through to that measure. The slowing growth in rents for new leases over roughly the past year can be thought of as “in the pipeline” and will affect measured housing services inflation over the coming year. Going forward, if market rent growth settles near pre-pandemic levels, housing services inflation should decline toward its pre-pandemic level as well.
Sure enough, CPI rent inflation is coming down but more slowly than the headline and core CPI inflation rates since last summer. The CPI rent of shelter index peaked at 8.3% y/y this March (Fig. 3). It was down to 6.8% in October, which is still a high reading. However, the Zillow current rent index was down to 3.2% y/y in October. It reflects new leases (Fig. 4). As Powell observed, it should be a leading indicator for the CPI shelter inflation rate.
Now consider the following related observations about the latest CPI report:
(1) Nonhousing services CPI. In his Jackson Hole speech, Powell reiterated his concern about the stickiness of inflation in the nonhousing services sector:
The final category, nonhousing services, accounts for over half of the core PCE index and includes a broad range of services, such as health care, food services, transportation, and accommodations. Twelve-month inflation in this sector has moved sideways since liftoff. Inflation measured over the past three and six months has declined, however, which is encouraging. Part of the reason for the modest decline of nonhousing services inflation so far is that many of these services were less affected by global supply chain bottlenecks and are generally thought to be less interest sensitive than other sectors such as housing or durable goods. Production of these services is also relatively labor intensive, and the labor market remains tight. Given the size of this sector, some further progress here will be essential to restoring price stability. Over time, restrictive monetary policy will help bring aggregate supply and demand back into better balance, reducing inflationary pressures in this key sector.
This “supercore” component of the PCED inflation rate has been stuck around 5.0% since October 2021 (Fig. 5). It was down to 4.3% in September. So it may finally be turning less sticky. In any event, the Fed’s job isn’t to finetune the components of the CPI, as Melissa and I have observed recently; what matters is that the overall inflation rate is heading downward, which it is.
By the way, the CPI’s version of supercore inflation (i.e., CPI services less rent of shelter) fell to 3.0% during October, down from last year’s peak of 8.2%. That should be a good harbinger of further declines in the PCED supercore inflation rate.
(2) Durable goods CPI. Inflation has turned out to be transitory for the goods components of the CPI (Fig. 6). This index edged up just 0.4% y/y through October, the lowest reading since December. The CPI for durable goods fell 2.1%. It is deflating again, which is what it has tended to do since the second half of the 1990s until the end of the pandemic lockdown.
(3) Nondurable goods CPI. The nondurable goods CPI inflation rate was well over 10% last summer. Now it is back down to just 1.7%. The most volatile components of this index, of course, are food and energy (Fig. 7). Food inflation peaked last year at 11.4% during August and was back down to 3.3% in October. Energy inflation peaked at 41.6% last year during June and was -4.5% in October. Food and energy prices were boosted by the initial supply shocks caused by Russia’s invasion of Ukraine in late February of last year. Now, weak global economic growth is moderating food and energy inflation.
(4) Transitory after all. There can be no debate about the transitory nature of goods inflation since H2-2020. It turned out to be mostly attributable to the shocks and aftershocks of the pandemic, which have been dissipating since the end of the pandemic.
Almost all the inflationary pressures on durable goods and many nondurable goods stemmed from the pandemic-related supply-chain disruptions, which can be seen in the Global Supply Chain Pressure Index compiled by the Federal Reserve Bank of New York (Fig. 8). The index jumped from 0.1 during October 2020 to peak at 4.3 during December 2021. It has plunged since then to -1.7, the lowest reading in the series, which started in September 1997.
As Debbie and I have often observed, the end of the pandemic lockdown during March and April 2020 led to a goods buying binge. We all had cabin fever and saved some money for a couple of months, then Washington provided three rounds of pandemic relief checks to millions of Americans. To relieve our cabin fever, we all went shopping. The buying binge overwhelmed supply chains, which were also disrupted by labor shortages. Consumers then pivoted away from goods toward purchasing services as they became more available starting around March 2021 (Fig. 9).
That’s all behind us now, as is the goods inflation shock. Now the services inflation shock is showing signs of dissipating.
Fiscal Policy: In Yellen We Trust. When Janet Yellen was Fed chair from October 2010 through February 2014, I often fondly (and respectfully) referred to her as the “Fairy Godmother of the Bull Market.” I noticed that almost every time she spoke publicly about the outlook for monetary policy and the economy, the stock market moved higher.
She hasn’t been as bullish for the stock market since January 2021, when she became the secretary of the US Treasury in the Biden administration. Under her watch so far, the federal budget deficit rose to the pre-pandemic record high of $1.7 trillion over the 12 months through October (Fig. 10). The same can be said about the $2.3 trillion increase over this same period in marketable US Treasury securities, which are up to a staggering $5.0 trillion since Yellen joined the Biden administration.
The deficit outlook has been exacerbated by the record $26 trillion in marketable debt held by the public that the Treasury must refund at higher interest rates than when Yellen took charge at the Treasury. Over the past 12 months through October, the Treasury’s net interest outlays rose to a record $692.2 billion (Fig. 11).
Under Yellen’s watch so far, the debt that the Treasury department issues has been downgraded by Fitch Ratings in August and Moody’s this past Friday. Yet on Monday, Yellen said she disagrees with Moody’s decision and countered that the Biden administration is “completely committed to a credible and sustainable fiscal path.”
On October 26 at an event in Bloomberg’s Washington office, Yellen dismissed the notion that bond yields were rising just because the Treasury’s financing needs have swelled. She stated: “I don’t think much of that is connected.” She blamed higher interest rates on the strong economy: “The economy is continuing to show tremendous robustness, and that suggests that interest rates are likely to stay higher for longer,” she said.
Nevertheless, the Treasury helped to spark a significant bond rally on November 1 by announcing that the next round of auctions would have more bills and fewer notes and bonds. In other words, Yellen in effect admitted that supply does matter.
US Economy: Still Lots of Jobs But Few Qualified Applicants. Our main takeaway from October’s small business owners survey conducted by the National Federation of Independent Business is that there are still plenty of job openings. Indeed, 43% of respondents said they have unfilled positions. This series is highly correlated with the JOLTS job openings series, which Fed Chair Powell often mentions in his remarks about the labor market (Fig. 12).
Fewer small business owners are expecting to hire. The percentage saying so fell from a record 32% during August 2021 to 17% in October 2023 (Fig. 13). That’s partly because the percentage who say that there are no qualified applicants rose from 51% at the end of 2022 to 55% in October.
Strategy: Q4’s Weaker Growth Outlook Narrowly Based. Last week, we discussed the strong Q3 results reported so far by the S&P 500 companies and noted that industry analysts’ estimates for Q4-2023 have been falling at the fastest rate since the end of 2022. Today, we’re taking another look at the S&P 500’s Q4 expectations and uncovering where the hits to earnings are taking place.
Here are our main takeaways:
(1) Brief pause ahead for record-high S&P 500 quarterly EPS. The S&P 500’s blended EPS for Q3-2023 has come in at a record-high $58.20, exceeding its prior record of $57.62 during Q2-2022. Looking ahead, the consensus forecast for S&P 500 earnings in Q4-2023 has dropped 4.7% to $55.36 in the six weeks since the start of the quarter. The consensus is expecting below-record-high quarterly EPS of $56.85 in Q1-2024, before rising to new record highs of $60.31 and $63.73 in Q3- and Q4-2024.
According to LSEG, the S&P 500’s expected Q4-2023 growth rate is now down to 5.8% y/y from 11.0% at the start of the quarter. That growth forecast represents a deceleration from the blended 6.3% y/y rate recorded so far for Q3-2023. On its face, the weaker Q4 growth rate appears to be a new worry for investors and provides ammo for those expecting a recession shortly. We disagree.
(2) A transitory “auto-immune deficiency” in Q4. A deeper dig into where expectations primarily have been falling leads us to believe that Q4’s earnings deterioration is transitory too. More than half of the decline in expectations is attributable to just six big companies in two industries: three automakers and three drug companies.
Q4 earnings expectations for Ford and General Motors have deflated due to the impact of the recently ended United Auto Workers strike. Non-unionized Tesla is seeing the effects of reduced prices for its line of electric vehicles as well as high startup production costs for its unprofitable Cybertruck.
The total expected Q4 earnings for these three automakers has fallen 33% since the start of the quarter to a still profitable $4.1 billion. While large, their collective decline in Q4 earnings expectations accounts for just 9% of the overall S&P 500’s $24 billion drop.
The three drug companies (Merck, Moderna, and Pfizer) have accounted for the bulk of the drop in the S&P 500’s total Q4 earnings expectations. Their income statements are experiencing withdrawal symptoms, as demand has evaporated quickly for Covid vaccines and other drugs. All three companies are expected to report a loss in Q4. Altogether, their $11.1 billion drop in expected earnings since the quarter started accounts for 80% of meltdown in the S&P 500 Health Care sector’s anticipated Q4 earnings and 46% of the drop in the overall S&P 500’s.
Relevant Matters
November 14 (Tuesday)
Check out the accompanying pdf and chart collection.
Executive Summary: Today, we focus our observations on earnings, valuation, and inflation. … S&P 500 companies’ collective Q3 earnings, forward earnings, and forward revenues all stand at record highs. But analysts’ earnings estimates for future quarters have been dropping. … There’s not always a neat inverse correlation between stock market valuations and bond yields. One reason: The MegaCap-8 stocks represent an outsized chunk of the S&P 500’s P/E; but with less leverage than most companies, interest rates affect them less. … Our moderating inflation outlook suggests no more federal funds rate hikes this tightening round; we examine some of the data it reflects.
Weekly Webcast. If you missed Monday’s live webcast, you can view a replay here.
Strategy I: Record Earnings. As of Friday’s close, the S&P 500 was 7.9% below its record high of 4796.56 on January 3, 2022. However, the composite’s earnings per share is back at its previous record high.
Joe reports that the Q3-2023 earnings reporting season for the S&P 500 firms is over 91% complete. The quarter’s blend of the actual and the remaining expected earnings results rose to $58.20 per share during the November 9 week, above its record high of $57.95 during Q2-2022 (Fig. 1 and Fig. 2).
Here are a few more relevant observations on the recent performance of earnings and the outlook for them:
(1) The latest earnings recession lasted just three quarters, from Q2-2022 through Q1-2023. S&P 500 earnings per share fell 7.9% over that time. That compares to declines of 33.3%, 77.0%, and 28.4% during the earnings recessions of the Great Virus Crisis, the Great Financial Crisis, and the Tech Wreck from Q2-2000 through Q4-2001.
(2) The bad news is that industry analysts have been cutting their Q4-2023 earnings estimates since the start of the current reporting season for Q3 in response to cautious forward guidance provided by managements. During the week of November 9, analysts’ consensus Q4 earnings-per-share estimate for the S&P 500 companies was down to $55.39 from $58.14 the week of September 28.
(3) The analysts have also been lowering their Q1, Q2, and Q4 estimates for 2024 (Fig. 3). So the Q1 estimate is now $56.85, i.e., a bit below the record high. However, the final three quarters of 2024 are all still in record-high territory at $60.31, $63.73, and $64.48.
(4) The 2023 and 2024 analysts’ consensus estimates for S&P 500 earnings per share are now $220.62 and $245.31. We are still using $225.00 and $250.00.
In our opinion, the stock market discounts the time-weighted average of consensus expected earnings per share during the current year and coming year. This weekly measure, a.k.a. “forward earnings,” rose to a record $241.99 per share during the November 9 week, as it is converging toward the 2024 consensus estimate (Fig. 4).
(5) S&P 500 forward earnings per share tends to be a very good 52-week leading indicator of actual earnings per share (Fig. 5). The same can be said about the relationship between the weekly S&P 500 forward revenues series and the actual quarterly results (Fig. 6). Forward revenues rose to yet another record high during the November 2 week.
The S&P 500 forward profit margin bottomed during the week of April 7 at 12.4% (Fig. 7). It edged up to 12.5% during the November 2 week.
Strategy II: The Valuation Question. There tends to be an inverse relationship between the 10-year US Treasury bond yield and the forward P/E of the S&P 500 (Fig. 8). That’s a well-known relationship. However, it doesn’t always work as expected. The simple theory is that the higher interest rates are, the better alternative to stocks fixed-income securities become.
That inverse relationship might also be attributable to the fact that rising interest rates often lead to recessions, which have always been bad for stock valuations and earnings. If inflation is high and interest rates aren’t high enough to bring it down, stocks might beat bonds because earnings tend to rise in that environment, while the purchasing power of interest payments is eroded by inflation.
In recent years, the MegaCap-8 stocks (i.e., Alphabet, Amazon, Apple, Meta, Microsoft, Netflix, Nvidia, and Tesla) have been dominating the performance of the S&P 500, including its valuation multiple. They currently account for 27.5% of the market capitalization of the S&P 500 index and 51.4% of its Growth sub-index.
The collective forward P/E of the MegaCap-8 is currently 27.6. The S&P 500’s forward P/E is 17.6 and 15.4 with and without the MegaCap-8. (FYI: Forward P/Es are simply the P/E calculated with forward earnings.)
In theory, the forward P/E of the MegaCap-8 stocks should be inversely correlated with the bond yield because the valuations of these and other Growth stocks tend to be even more sensitive to higher interest rates than those of the Value stocks. However, the MegaCap-8 stocks may be less vulnerable to high interest rates because these eight companies are less dependent on debt than most and have substantial cash flow.
In other words, the relationship between valuation multiples in the stock market and interest rates is a complicated one.
Inflation: Expectations & Oil Prices. The outlook for the economy and the financial markets in 2024 will depend largely on the path of inflation. In our projected scenario, the core PCED inflation rate falls to 2.0%-3.0% next year. It was 3.4% y/y through September.
That’s a reasonable forecast, in our opinion. It is consistent with the FOMC’s September Summary of Economic Projections (SEP) showing the core PCED inflation rate at 2.6% at the end of 2024, 2.3% at the end of 2025, and 2.0% at the end of 2026. According to the SEP, that would be consistent with the federal funds rate remaining at the current level through early 2024 with perhaps two 25bps cuts in the federal funds rate later next year.
Now consider the following relevant developments on the inflation front:
(1) CPI. The next big event on the inflation front is Tuesday’s October CPI report. The Cleveland Fed’s Inflation Nowcasting shows that the CPI headline and core inflation rates rose 0.1% and 0.3% m/m, respectively, during October. That puts the two up 3.3% and 4.2% on a y/y basis. These numbers confirm that inflation remains on a moderating trend.
(2) Expectations. Fed officials often have said that they also want to make sure that inflation is “well anchored.” In other words, they want to see that inflationary expectations are low. So it was a bit unsettling that Friday’s release of the consumer sentiment survey for the first half of November showed the one-year expected inflation rate jumped from 3.2% in September to 4.2% in October and 4.4% in early November (Fig. 9). The survey’s five-years-ahead inflationary expectations rose from 2.8% to 3.2% over this same interval (Fig. 10).
On the other hand, on Monday, we learned that the comparable readings for October’s consumer survey conducted by the Federal Reserve Bank of New York were 3.6% over the coming year and 2.7% over the next five years.
(3) Oil. The increase in the November consumer survey’s inflationary expectations seems odd given that its year-ahead response tends to be highly influenced by the price of gasoline, which has been falling since early October. The recent weakness in gasoline prices reflects record-high crude oil field production in the US (Fig. 11).
Furthermore, Debbie and I seasonally adjusted the four-week moving average of gasoline consumed in the US (Fig. 12). It peaked this year at 9.7 million barrels per day (mbd) through May 1 and plunged to 8.4 mbd at the end of October.
Since the pandemic, consumer demand for gasoline has been more price elastic. That’s because more people are working from home. With less need to commute to work, more driving is discretionary now. So when gas prices go up, people have the option of consuming less gas by driving less around their neighborhoods.
Stock Investors Back In The Saddle Again
November 13 (Monday)
Check out the accompanying pdf and chart collection.
Executive Summary: The stock market has a good track record as a business-cycle indicator, even though last year’s bear market was a false alarm, as investors expected a recession that never came. Since that bear market ended, in October 2022, the stock market has been in a bull market, with its August-through-October weakness simply a correction. Now the Bond Vigilantes and their concerns have retreated, clearing the way for the S&P 500 to rise to our targets of 4600 by year-end 2023 and 5400 by year-end 2024. … Such expected stock market strength jibes with our economic outlook, which presumes that a recession isn’t likely before the end of 2024. ... And: Dr. Ed reviews “NYAD” (+).
YRI Weekly Webcast. Join Dr. Ed’s live webcast with Q&A on Mondays at 11 a.m. EST. You will receive an email with the link one hour before showtime. Replays of the weekly webcasts are available here.
Strategy I: False Alarm. The S&P 500 bottomed last year on October 12 at 3577.03 (Fig. 1). At that point, it was down 25.4% from the January 3, 2022 record high of 4796.56. Those endpoints marked a relatively classic, but short, bear market—short because it was attributable to the most widely anticipated recession that didn’t happen since the end of WWII (when a depression was widely expected but didn’t happen). Excessive bearishness along with mounting evidence showing that a recession might not be coming after all helped lift the index off its bottom.
The S&P 500 does correlate with the business cycle; that’s why it’s one of the 10 components of the Index of Leading Economic Indicators (LEI) (Fig. 2). The S&P 500 peaked either just prior to or contemporaneously with the previous eight peaks in the business cycle. It bottomed just before seven of the troughs during the past eight business cycles. This time, the latest bear market in the S&P 500 has sounded a false alarm, so far.
Of course, the S&P 500 will still be viewed as a remarkably prescient leading indicator of the business cycle if a recession happens in 2024, as some pessimistic prognosticators never stopped expecting. They’ll say that the S&P 500 was a bit early but right after all (as they were).
However, since bottoming last year on October 12, the S&P 500 rose 28.3% through July 31 of this year. That’s a classic bull market. It also (like the bear market before it) would be relatively short—if it were over. We think it’s not: Indeed, we are still expecting the S&P 500 to rise just above its July 31 peak to 4600 by year-end and proceed to 5400 by the end of 2024. The index’s 10.3% drop to 4117.37 from July 31 through October 27 was a classic correction within a bull market, we believe. Since October 27, the S&P 500 is up 7.2% through Friday’s close of 4415.24.
So the bull market since October 12, 2022 is still going on, in our view, with the S&P 500 up 23.4% since then through Friday’s close.
Last year’s bear market was attributable to widespread fears that soaring inflation would force the Fed to raise interest rates to levels that would cause a credit crunch and a recession. Sure enough, the Fed raised the federal funds rate by 300bps from March through October of last year, and by another 225bps through July of this year (Fig. 3). Yet the S&P 500 bottomed on October 12 because the widely anticipated recession was a no-show. The stock market rally since then suggests that the S&P 500 is back on track as a leading indicator if indeed there’s no recession through 2024, which happens to be our outlook.
The strength of the economy, in the face of the dramatic increase in the federal funds and other interest rates since early last year, has surprised even optimistic prognosticators, including Debbie and me. The past 10 recessions were all preceded by significant increases in the federal funds rate (Fig. 4). Last week, in Wednesday’s Morning Briefing, we reviewed our five explanations for the resilience of the economy.
Strategy II: Santa Rally Started Before Halloween. The stock market seems to be following the classic pattern of a bullish year that started with a very positive January Barometer. The S&P 500 was up 6.2% this year during that month. It is also the third year of the presidential cycle, which tends to be the best of the four years of a presidential term. Even the seasonal script is back in play after the last two weeks’ epic rally. September and October tend to be tough months for the stock market, setting the stage for Santa Claus rallies during the final two months of the year.
This year, the Santa Claus rally might have started just before Halloween. Fears that the bond yield might continue to surge above 5.00% evaporated during the first week of this month in response to weaker-than-expected employment indicators and a broadening consensus that the Fed is done raising the federal funds rate. The 10-year US Treasury bond yield plunged 41bps from last month's peak of 4.98% on October 19 to 4.57% on Friday, November 3 (Fig. 5).
The stock market rose sharply on Friday, November 10 even though the 10-year Treasury bond yield ticked back up to 4.61%. Stock investors have learned that the economy can live with a 4.50%-5.00% long-term bond yield. If the yield stabilizes in this range, as we expect, then stock prices can move to new record highs through next year, if there’s no recession. Stable bond yields would help to stabilize valuation multiples. The forward P/E of the S&P 500 was 18.2 on Friday (Fig. 6).
The yield-curve spread, which is also a component of the LEI, is now -43bps (Fig. 7). That’s indicative of recession territory, but less so than on June 30, when the spread was -106bps. The yield-curve spread has a good record of calling recessions when it turns negative. This time has been different so far, so stock investors seem to be less concerned about that than they were during H2-2022.
By the way, also helping to boost stock prices on Friday was the uptick in the price of a barrel of Brent crude oil (Fig. 8). Investors have become increasingly concerned that the $15.12 drop since September 27 might reflect a rapidly weakening global economy.
We are expecting that both the bond yield and the oil price will stabilize around current levels. If so, then the Santa Claus rally may proceed through year-end as we project. During the latest stock market correction, the Bond Vigilantes saddled up and were riding high. Now stock investors may be back in the saddle again.
Strategy III: Recession Scare Ahead? So what could possibly go wrong? If Santa is early this year, might Halloween be late? Investors could still get spooked by weaker-than-expected economic indicators and higher-than-expected inflation. Of course, the geopolitical situation remains perilous. Domestic political partisanship remains unsettling. Mounting government debt could push bond yields higher to equilibrate supply with demand. The odds of a recession before the end of next year aren’t insignificant, at 35%, in our opinion.
For now, let’s focus on October’s business and inflation indicators that are coming out this week:
(1) Federal budget (Monday). Every month, the Bond Vigilantes will be incited to riot again by the Monthly Treasury Statement (MTS), showing US government receipts and outlays. In addition to the widening gap between receipts and outlays, they’ll be focusing on the fastest growing outlays category, namely net interest paid by the federal government. Over the past 12 months, it totaled a record $659.2 billion (Fig. 9). It has doubled since May 2021.
Marketable Treasury securities held by the public totaled $26 trillion during October (Fig. 10). So the Treasury paid an average interest rate of 2.50%, according to the latest data. The current 2-year Treasury yield is close to 5.00%.
(2) CPI (Tuesday). October’s headline CPI is expected to be around zero or even slightly negative on a m/m basis because of the drop in gasoline prices during the month (Fig. 11). The Cleveland Fed’s Inflation Nowcasting shows that the CPI headline and core inflation rates rose 0.07% and 0.34% m/m, respectively, during October. That puts the two up 3.3% and 4.2% on a y/y basis.
(3) Retail sales (Wednesday). October’s retail sales excluding gasoline might have been on the weak side. That’s because our Earned Income Proxy for private-sector wages and salaries in personal income was flat during the month (Fig. 12). Retail sales were strong in September, rising 0.7% m/m even though consumer revolving credit rose just $3.1 billion during the month (Fig. 13).
(4) Industrial production (Thursday). October’s employment report showed that aggregate weekly hours in manufacturing fell 0.3% m/m. That decline undoubtedly reflected the United Auto Workers strike (Fig. 14).
Movie. “NYAD” (+) (link) is a Netflix biopic about 64-year-old marathon swimmer Diana Nyad, who became the first person ever to swim from Cuba to Florida without the aid of a shark cage. After several tries during her career, she finally succeeds in 2013, completing the 110-mile swim in 53 hours. The only problem is that her feat wasn’t independently verified. So her controversial achievement was not ratified by the World Open Water Swimming Association or the Guinness World Book of Records. The movie stars Annette Bening as the eponymous American swimmer, while Jodie Foster plays her coach.
Global Growth Fears Hit Industrials & Materials
November 9 (Thursday)
Check out the accompanying pdf and chart collection.
Executive Summary: Low hopes for the global economy have been weighing on the share price indexes of the S&P 500 Industrials and Materials sectors, especially this week. Today, Jackie examines some counterintuitive stock price action among select industries and companies within the two sectors. For example, automating factories should be a promising business these days, but investors have punished two players in this space, Emerson and Rockwell, for disappointing recent quarters. Conversely, the S&P 500 Steel industry’s share price index has been performing well despite analysts’ low earnings expectations, lifted by a legal win for continued US tariffs on steel imports and the end of the UAW strike.
Industrials: Halloween Arrives Late. China’s declining exports and the drop in the price of oil futures spooked many commodity markets on Tuesday. The news amplified fears that the global economy is slowing under the weight of an overleveraged Chinese economy, higher interest rates, and a stronger US dollar. Truth be told, these fears have been festering and nicking away at commodities prices since many of them peaked earlier this year; they’ve been sliding ever since.
The price of Brent crude futures is $81.61 a barrel, down 11.7% from its recent high on October 19 and down 6.6% over just the past week (Fig. 1). The CRB Industrials metals spot price index has declined 12.0% from its 2023 high (Fig. 2). Within that index, copper futures have been weak for most of this year, declining 14.0% from its January 26, 2023 high (Fig. 3).
Meanwhile, most S&P 500 sectors were amazingly resilient to the global growth scare on Tuesday. Here’s the performance derby for the S&P 500 for Tuesday’s markets: Consumer Discretionary (1.2%), Information Technology (1.1), Communication Services (0.6), S&P 500 (0.3), Consumer Staples (0.2), Health Care (0.0), Financials (-0.1), Industrials (-0.3), Utilities (-0.7), Real Estate (-0.9), Materials (-1.9), and Energy (-2.2) (Table 1).
The S&P 500 Industrials and Materials sectors’ poor performances on Tuesday furthered the downward trajectory they’ve been on since peaking on August 1 and July 31. Industrials have fallen 11.3%, and Materials have dropped 9.3% since the sectors peaked (Fig. 4).
Here’s a closer look at what’s been ailing the Industrials sector’s stocks:
(1) Some winners, some losers. This should be a great time for companies in the Industrials sector, with new factories sprouting up around the US and internationally as companies look to diversify their operations outside of China and meet the huge demand for defense equipment. But instead, the sector’s price index performance is being weighed down by operational issues at Boeing and weakness in the transportation-related industries.
Here are some of the Industrials industries with positive ytd performances through Tuesday’s close: Electrical Components & Equipment (9.8%), Industrial Machinery (8.4), Industrial Conglomerates (6.7), and Construction Machinery & Heavy Trucks (3.3).
Conversely, these industries have been weighing down the Industrials sector’s ytd performance: Air Freight & Logistics (-3.4%), Rail Transportation (-4.2), Aerospace & Defense (-5.5), and Passenger Airlines (-11.5).
(2) Emerson disappoints. Companies catering to the automation of factories should be prospering given all the new factories being built for offshoring, nearshoring, and friend shoring. But the recent quarterly results of Emerson Electric and Rockwell Automation underwhelmed. Emerson shares fell 7.4% on Tuesday to $84.94 due to its fiscal Q4 (ended September 30) earnings report. The shares are down 15.2% from their 2023 high on September 11.
Emerson has been undergoing a transformation, selling slower growing businesses and buying faster growing ones. Adjusted fiscal Q4 earnings per share grew 20.6% to $1.29, but that was below analysts’ consensus estimate of $1.31 and failed to offset investors’ disappointment about recent quarters’ declining orders in the Discrete Automation and Test & Measurement units.
Emerson’s fiscal Q4 sales were up in each of its divisions except Discrete Automation, where they fell 7% y/y due to softer-than-expected demand and weakness in Europe and China, reported CFO Mike Baughman. Management expects the segment’s sales to recover to flat-to-low-single-digit y/y comparisons by H2-2024.
(3) Rockwell disappoints too. Rockwell Automation’s share price has fallen by one-fourth since its peak on July 18. The company attributed its lower-than-expected earnings forecast for fiscal 2024 (ending September 30) to distributors’ inventory destocking and, to a lesser extent, to a slowdown in its business in China. More optimistically, the company confirmed that US stimulus spending to encourage building factories domestically will keep Rockwell’s US business growing for many years.
The company posted strong fiscal Q4 (ended September 30) organic sales growth of 17.7% y/y and adjusted EPS growth of 20% y/y. However, management’s guidance for fiscal 2024 adjusted EPS was less than analysts were expecting: $12.00-$13.50 with a midpoint of $12.75, compared to the consensus estimate of $12.94 for next year and adjusted earnings of $12.12 in full-year fiscal 2023. The consensus estimate for next fiscal year has declined from $13.31 three months ago.
Rockwell noted that its distributors’ excess inventory led to a decline in orders in fiscal Q4 and that inventory right-sizing may continue through fiscal Q1 (ending December 31).
The company’s fiscal 2024 EPS will also be weighed down by $0.25 dilution from last month’s acquisition of Clearpath Robotics, which makes autonomous mobile robots. But over the long run, the acquisition should be a homerun because the market for industrial mobile robots in factory floor applications is expected to grow more than 30% for each of the next five years.
Finally, next year’s results will be weighed down by weakness in the company’s China business, which represents about 6% of its worldwide sales. “While we saw strong sales growth in China in fiscal year ’23, we continue to see high order deferrals and cancellations in China,” said CEO Blake Moret on the company’s earnings conference call. As a result of China’s weakness, orders from Asia are expected to fall y/y in 2024; order growth is expected to be the highest in the Americas. Projects funded by US government stimulus spending are still in the “early innings,” with decisions on what automation equipment to purchase not yet made.
Emerson and Rockwell are members of the S&P 500 Electrical Components & Equipment industry, which was up by 23.9% at its September 1 peak this year but now is up only 9.8% ytd (Fig. 5). The industry is coming off strong results in 2021 and 2022, when earnings grew 26.2% and 14.8%, respectively. The industry’s earnings growth is expected to be tepid this year, at 6.3%, before strengthening to 12.4% in 2024 (Fig. 6). The industry has benefitted from a record forward profit margin of 16.4%, up from around 13% in 2019, and positive net earnings revisions (Fig. 7). The industry’s forward P/E ratio has fallen to a more reasonable 19.5, down from 26.3 in July 2021 (Fig. 8).
Materials: Steel Enjoys a Cushion. Investing in steel has not been for the faint of heart. The commodity’s price rose 64.0% from the start of this year through April 12; it then fell 42% through October 3 and since has risen 30% to $890 per metric ton. On a ytd basis, steel has risen 20%, far outperforming the 4% decline in the copper price (Fig. 9).
The share prices of the two companies in the S&P 500 Steel industry, Nucor and Steel Dynamics, are up 14.9% and 12.9% ytd through Tuesday’s close. Both stocks have fallen since March, when both were up by more than 35% (Fig. 10).
These stocks’ appreciation this year is out of step with analysts’ expectations that their earnings will fall sharply. The S&P 500 Steel industry’s aggregate earnings rose 610.6% in 2021 and 28.1% in 2022. This year, they’re expected to fall 36.9%, followed by a 33.8% decline in 2024 (Fig. 11).
Nucor CFO Steve Laxton acknowledged that the steel market had softened in the company’s Q3 earnings conference call on October 24: “We attribute this to uncertainty arising from the United Auto Workers Strike, higher interest rates, credit tightening, elevated geopolitical risk and concern about another potential US government shutdown.” As a result, the company expects Q4 results to decline y/y for the second quarter.
The company’s utilization rate fell to 77% in Q3, down from 84% in Q2, and Q3 EPS of $4.57 fell from $5.81 in Q2 and $6.50 in Q3-2022. Earnings in Q4 are expected to decline from Q3 levels, primarily due to lower prices. Nucor shares are up 14.9% ytd through Tuesday’s close, but they have deflated from gains north of 30% in August.
Let’s take a look at what might be keeping steel stocks in positive territory this year:
(1) Tariffs help. The industry continues to benefit from tariffs that former President Trump placed on imports of steel, arguing that it was important to the US’s national security to have a strong steel industry. At the end of last month, the US Supreme Court declined to hear an American steel importer’s case arguing that tariffs on certain steel products should be invalidated, an October 30 Reuters article reported. The Biden administration urged the Supreme Court not to take up the appeal.
(2) Auto production set to rev up after UAW strike. On October 30, General Motors and the United Auto Workers (UAW) agreed to a tentative deal to end the workers’ six-week strike. Their deal followed deals between Ford Motor and Stellantis and the workers. Workers began walking off the job at specific factories on September 15, and by the strike’s end, one third of United Auto Workers’ 150,000 members were striking, an October 30 Reuters article reported.
With workers back on the job, car manufacturing by the Big Three automakers is no longer imperiled, so US demand for steel should remain strong. US auto sales came in at 15.7mu (saar) in October, down a smidge from their recent high of 16.2mu but well off the lows of 12.7mu in 2022 (Fig. 12). US auto inventories remain near historical lows, with the inventory-to-sales ratio of 1.1 months well below the 2.5 norm (Fig. 13).
Captain America
November 8 (Wednesday)
Check out the accompanying pdf and chart collection.
Executive Summary: The US economy has remained remarkably strong in the face of the Fed’s attempts to tame inflation at the economy’s expense. So far, so good: Inflation has been moderating nicely but not bringing the economy down with it. Today, we review the major reasons for the US economy’s resilience. … In contrast, the global economy is weak as evidenced by the plunge in oil prices. Record US oil production has helped to lower oil prices from their September peak. ... And: Joe looks at analysts’ estimate revisions activity in the wake of a strong Q3. Despite that strength, Q4 estimates are dropping at rates faster than usual.
US Economy: Superhero. Like Captain America, the American economy seems to have an indestructible shield. The Fed has raised the federal funds rate aggressively by 525bps since March 2022 with the aim of tightening financial conditions to slow the economy and to raise the unemployment rate with the ultimate aim of bringing down price and wage inflation (Fig. 1).
Yet real GDP jumped 4.9% (saar) and rose 2.9% y/y during Q3 (Fig. 2 and Fig. 3). Real nonfarm business output, which is used to calculate productivity, soared 5.9% (saar) during Q3 and rose 3.1% y/y! The unemployment rate has remained below 4.0% since February 2022. Yet both consumer price and wage inflation rates have dropped from their 2022 peaks of 9.1% and 5.9% to 3.7% in September and 4.4% in October (Fig. 4 and Fig. 5).
Debbie and I have been discussing the main reasons for the economy’s resilience and disinflationary tendencies since early last year. Here is a brief review and update:
(1) Resilient consumers. Consumer spending has continued to grow despite the tightening of credit conditions (Fig. 6). As a result, employment has continued to grow, boosting the purchasing power of consumers. Payroll employment rose to a record high of 156.9 million during October, up 1.9% y/y (Fig. 7). Many of the industries with the largest payrolls are continuing to expand their employment rolls into record-high territory, including construction (8.0 million), educational services (4.0 million), financial activities (9.2 million), health care & social assistance (21.7 million), leisure & hospitality (17.0 million), and professional & business services (23.0 million).
Some of the industries that are expanding their payrolls are doing so because of strong demand for their services by Baby Boomers, most of whom now are seniors. These include financial activities, health care & social services, and leisure & hospitality. Retired Boomers have over $75 trillion in net worth and will be spending much of it as they grow older. Many of their adult children likely anticipate inheriting some of their parents’ net worth, prompting them to save less and spend more of their incomes.
Also keep in mind that unearned personal income (from interest, dividends, rent, and proprietors’ income) rose to an all-time record high of $6.5 trillion (saar) during September (Fig. 8).
(2) Onshoring & technology-led capital spending. Onshoring is boosting capital spending, as evidenced by the 14.1% y/y jump in real capital spending on new manufacturing structures during Q3 (Fig. 9). Companies are allocating more of their capital spending budgets to technology hardware and software to boost their productivity in response to chronic labor shortages. As a result, production of high-tech equipment and spending on software are at all-time highs (Fig. 10). Also booming is industrial production of defense, which is likely to continue rising to new record highs given the geopolitical turmoil around the world. (Fig. 11).
(3) Fiscal stimulus. Federal government spending is growing rapidly, led by outlays on net interest paid. They totaled a record $659.2 billion over the past 12 months through September. That’s an unsettling development, for sure. However, keep in mind that high interest rates represent a big windfall for households that receive interest income, which has increased significantly. Meanwhile, the spending bills passed by Congress last year will continue to boost construction spending on public infrastructure, which is at a record high (Fig. 12).
(4) Refinanced balance sheets. In his November 1 press conference, Fed Chair Jerome Powell acknowledged that the Fed “may have underestimated the balance sheet strength of households and small businesses.” That’s partly because many of them refinanced their debts at record-low interest rates over the past few years. So the rise in interest rates since early last year hasn’t boosted their interest payments on their debts enough to weigh on their overall spending.
(5) Domestic migration. Since the pandemic, there has been significant migration from northern states to southern ones that have warmer weather, lower taxes, and more job openings. That’s created a big demand for housing, especially rental apartments. It’s also meant that the states with increasing populations must spend more on infrastructure to accommodate their new residents and workers.
Global Economy: Unheroic. The NYMEX price of a barrel of crude oil peaked this year at $93.68 on September 27. Notwithstanding the war that started between Israel and Hamas on October 7, the price is down $16.27 from that peak to $77.42. That’s even though Saudi Arabia and Russia reduced their exports during the summer and maintained their cuts through year-end.
One reason for this development is that US crude oil field production is back at record highs (Fig. 13).
Another reason is that the global economy remains weak. For example, China’s October merchandise trade data showed that while imports rose 5.8% y/y, exports fell 4.5% over the same period. In fact, both have been relatively flat since early 2022 (Fig. 14). Japan’s industrial production fell in September (-3.7% y/y) and also has been flat since early 2022 (Fig. 15).
Strategy: Analysts Trimming Estimates Despite Strong Q3. As of mid-day Tuesday, the S&P 500’s Q3-2023 reporting season is more than 85% complete. Like all earnings seasons, there has been good news and bad news. While the just-reported Q3’s results have been mostly good—with strong earnings and revenues surprise data indicating a lot of better-than-expected results—analysts and investors are always looking ahead at the forecasts for the future.
Managements have been tempering their future expectations for their companies, so analysts have been following suit, trimming their estimates for future periods at faster-than-typical rates. But we’re not alarmed. The rate of decline suggests a soft landing for the economy, as we’ve been expecting. A few sectors continue to do very well, most are holding up just fine, and only a few are experiencing challenges, as Joe shows below (note that the data below represent the collective results of just those 85% of S&P 500 companies that have reported Q3 earnings so far, as of mid-day Tuesday):
(1) Q3 revenue and earnings surprise and growth. Comparing Q3’s aggregate revenue and earnings surprises to Q2’s at the same point in the reporting season shows fewer companies exceeding analysts’ estimates but greater y/y growth rates. Specifically, the revenue beat has weakened to 0.7% from Q2’s 1.9%, and the earnings surprise has eased to 7.0% from Q2’s 7.9%. However, the y/y growth rates of both revenues and earnings have improved. Revenues are up 1.4% y/y compared to 0.9% at the same point in the Q2 season, and earnings are up 2.4% y/y compared to a 7.7% decline in Q2.
(2) Q4 forecasts are being trimmed at a faster rate. The S&P 500’s consensus Q4 EPS estimate has fallen 3.6% in the five weeks since the start of Q4-2023. That’s more than the declines during the first three quarters of 2023 over the analogous five-week timeframe (-0.5% in Q3, -0.7% in Q2, and -3.5% in Q1).
However, the decline in the Q4-2023 estimate is still less than the 4.1% and 4.4% declines that occurred in Q3-2022 and Q4-2022, when the MegaCap-8 stocks (Alphabet, Amazon, Apple, Meta, Microsoft, Netflix, Nvidia, and Tesla) contributed heavily to the results. Looking back at the 55 quarters since Q1-2010, Q4-2023’s estimate decline of 3.6% to date has been eclipsed during just eight of the 55 quarters (Q4-2011, Q3-2012, Q1-2015, Q1-2016, Q1-2019, Q2-2020, Q3-2022, and Q4-2022).
(3) Single-digit y/y earnings growth now expected in Q4-2023. According to I/B/E/S data from the London Stock Exchange Group, the S&P 500’s proforma y/y earnings growth forecast for Q4-2023 has dropped to 7.0% as of November 3 from a projected 11.0% on October 1. Among the S&P 500’s 11 sectors, only Communication Services and Tech improved since the start of the quarter, while Health Care has posted the biggest drop.
Here’s how the S&P 500 sectors’ Q4-2023 growth rates have fared: Communication Services (50.0% as of November 3, 49.5% as of October 1), Consumer Discretionary (21.5, 28.5), Consumer Staples (1.8, 5.2), Energy (-20.0, -20.6), Financials (11.3, 11.7), Health Care (-14.9, 2.4), Industrials (0.3, 6.3), Information Technology (15.6, 14.7), Materials (-16.5, -7.6), Real Estate (11.7, 14.3), and Utilities (54.5, 55.4).
(4) Waiting for Q4 before adjusting 2024’s expectations. Looking ahead to 2024, analysts have taken only a light pencil to their forecasts so far. They’ll press down harder during the Q4-2023 reporting season, when the managements of the companies they follow provide more detail about their expectations for 2024.
For now, the consensus S&P 500 earnings-per-share forecast of $245.75 for 2024 is down 0.7% over the past five weeks. The quarterly forecasts have changed as follows: Q1 down 1.3%, Q2 down 1.0%, Q3 up 0.8%, and Q4 down 0.9% (Fig. 16). Analysts still expect solid earnings growth of 11.5% in 2024, with their quarterly projections at 7.1% y/y (Q1), 11.0% y/y (Q2), 9.9% y/y (Q3), and 16.0% y/y (Q4) (Fig. 17).
What’s Next? Pickleball!
November 7 (Tuesday)
Check out the accompanying pdf and chart collection.
Executive Summary: Back and forth we expect the bond and stock markets to bounce for the foreseeable future as the bulls and bears in each market alternate control. We see the 10-year Treasury bond yield ending the year at 4.50% and the S&P 500 at 4600. Next year, we expect continued volleying between bulls and bears to keep the bond yield rangebound between 4.00% and 5.00% and the S&P 500 rising to 5400 by year-end. … As for the economy, we think surprisingly strong economic growth is likely next year, led by a productivity boom that continues for the remainder of the decade—our “Roaring 2020s” scenario taking hold at last.
Weekly Webcast. If you missed Monday’s live webcast, you can view a replay here.
Strategy I: What’s Next? The answer to this question is: pickleball. The bulls and the bears in the bond market are likely to keep the 10-year Treasury bond yield in play between 4.50% and 5.00% through the end of this year. The bulls and the bears in the stock market are likely to keep the S&P 500 in play between 4117 and 4589 over the rest of the year, i.e., in a range between the October 27 low and the July 31 high. We are expecting the bulls will prevail by the end of this year, with the bond yield at 4.50% and the stock index at 4600. Consider the following:
(1) Bonds. A year ago, in early November, we called the top in the 10-year Treasury bond yield at 4.25% on October 24, 2022. That remained the top for about a year, until September 13 of this year when the yield rose once again to 4.25% and kept rising, peaking at 4.98% on October 19 (Fig. 1). At the end of last week, it was back down to 4.57%.
Now we reckon that the yield might be rangebound through next year between 4.00% and 5.00%. That would be in line with the yield range that occurred from 2002 through 2007, i.e., the years before the New Abnormal period from the Great Financial Crisis to the Great Virus Crisis, when the Fed repressed interest rates.
Why such a wide projection range? Because we think the forces influencing the bond market will keep the yield fluctuating to-and-fro within that range.
On the one hand, we are reasonably confident that inflation will continue to moderate through next year. Yesterday, we observed that nonfarm unit labor cost (ULC) inflation is a major determinant of the CPI inflation rate. That’s especially the case for the CPI excluding food, energy and shelter, which rose 2.0% y/y in September (Fig. 2). The ULC inflation rate was down to 1.9% during Q3. Moderating inflation, a bullish force, will tend to pull the yield closer to the lower 4.00% end of our target range.
On the other hand, fiscal policy (like our border with Mexico) is out of control. The federal deficit is at a record high excluding the pandemic period. Federal debt is at a record high. The fastest growing component of federal outlays is interest expense (Fig. 3). This bearish factor will tend to push the yield closer to the higher 5.00% end of our target range.
So the tug-of-war between the bond bulls (who are focusing on falling inflation) and the bond bears (who are focusing on the mounting debt) will continue for the foreseeable future, keeping the bond yield in a range of 4.00% to 5.00%, in our opinion.
(2) Stocks. At the end of last year, the widespread consensus was that 2023 would start with a mild recession during H1 and a modest recovery in H2. The Street consensus was that H1 would be bearish for stocks and H2 would be bullish for them. We were bullish with our S&P 500 price index forecast of 4600 by the end of 2023 and our S&P 500 earnings-per-share estimate of $225 for the year.
The S&P 500 peaked just shy of 4600 on July 31. We declared victory and concluded that a correction down to the 200-day moving average (dma) of the S&P 500 was likely next, followed by a year-end rally back to 4600. When the index fell below its 200-dma on October 20, our confidence in that forecast got a little wobbly. It’s less so now that the index jumped to its 50-dma last week (Fig. 4).
Joe and I are sticking with our estimate of $225 for S&P 500 earnings per share for this year (Fig. 5). As of the November 1 week, the consensus of industry analysts was $216. We are also still projecting $250 and $270 for 2024 and 2025.
S&P 500 forward earnings per share rose to a record high of $241.85 during the November 2 week (Fig. 6). If it hits $250 by the end of this year, our year-end target for the S&P 500 price index of 4600 would imply a forward P/E of 18.4.
If forward earnings reaches $270 by the end of next year, the forward P/E implied by our S&P 500 target of 5400 at year-end 2024 would be 20.0.
US Economy: What’s Next? The big surprise in 2024 won’t be a recession. That’s because if a recession does happen, it won’t be a surprise since it has been the most widely anticipated recession in history. The really big surprise would be better-than-expected economic growth that would be led by productivity. In this scenario, the Fed might actually get inflation down to 2.0%, while real economic growth might be 3.0% or more rather than 2.0% or less.
Our earnings forecasts above reflect our confidence in this Roaring 2020s scenario finally coming to life. While Debbie and I have been having some fun with the no-show Godot recession, we must admit that the productivity growth boom likewise has been a no-show. But as we observed last week in our November 2 QuickTakes, Q3’s productivity report suggests that our Godot scenario may be starting to play out. Consider the following:
(1) Productivity. Nonfarm business productivity rose 2.2% y/y during Q3 (Fig. 7). Productivity growth pops typically occur at the tail end of recessions and early recovery periods. The latest pop is consistent with our view that the economy has been in a recession since early 2022, with the proviso that it has been a rolling recession rather than an economy-wide one.
Why might the latest productivity pop be the start of a productivity growth boom? Companies are facing chronic labor shortages, especially of skilled and qualified workers. So they must do whatever they can to boost the productivity of their workers. The working-age population (16 years or older) rose just 1.1% y/y over the 12 months through October (Fig. 8). The labor force is up 1.7% over this same period on the same basis. But it’s constrained by the growth rate of the working-age population.
(2) Real hourly compensation. The main driver of inflation-adjusted hourly compensation is productivity (Fig. 9). Many economists have been alarmed by the widening gap between the two since 1973, with the former increasingly lagging the latter. That’s most noticeable when the CPI is used to deflate hourly compensation. But the CPI has an upward bias. The so-called compensation-productivity gap mostly disappears when the nonfarm business price deflator is used instead of the CPI.
The productivity growth boom we expect for the remainder of the decade should boost real compensation growth commensurately.
(3) Inflation. As noted above, ULC inflation was down to only 1.9% y/y during Q3 as hourly compensation growth of 4.2% was offset by productivity growth of 2.2% (Fig. 10, Fig. 11, and Fig. 12).
Throwing Caution To The Wind
November 6 (Monday)
Check out the accompanying pdf and chart collection.
Executive Summary: Last week brought epic rallies in both the stock and bond markets. We think the stock market’s correction is over and that the S&P 500 is back on track to end the year at 4600. All 11 sectors gained ground last week, many enjoying their best week in nearly a year. … As for the bond market rally that carried the 10-year Treasury bond yield down to a more comfortable distance from 5.00%, the wave of buying had multiple drivers. Nevertheless, beware of the Bond Vigilantes. … Also: Recent economic news supports our Immaculate Disinflation theory.
YRI Weekly Webcast. Join Dr. Ed’s live webcast with Q&A on Mondays at 11 a.m. EST. You will receive an email with the link one hour before showtime. Replays of the weekly webcasts are available here.
An Epic Week I: Back on the Right Track. Halloween wasn’t spooky after all. Instead, the S&P 500 bottomed at 4117.37 on Friday, October 27. It found support at the uptrend line connecting the closing lows of March 23, 2020 and October 12, 2022 (Fig. 1). It rose every day last week, gaining 5.8% through Friday. At its recent low on October 27, it was 2.9% below its 200-day moving average (dma). Now it is 2.6% above this average. It was down 10.3% from its 4588.96 high of the year on July 31. Joe and I think that the correction is over and that we may be back on track to achieve our year-end target of 4600.
The Nasdaq rebounded 6.6% last week to 5.0% above its 200-dma and also moved back above its 50-dma (Fig. 2). The plunge in the bond yield boosted the valuation multiples of technology stocks as well as the more traditional interest-rate sensitive ones. Here is last week’s performance derby for the S&P 500 and its 11 sectors: Real Estate (8.5%), Financials (7.4), Consumer Discretionary (7.2), Information Technology (6.8), Communication Services (6.5), S&P 500 (5.9), Industrials (5.3), Utilities (5.2), Materials (5.1), Health Care (3.5), Consumer Staples (3.2), and Energy (2.3).
Joe observes that many S&P 500 sectors had their best weekly gain in at least 51 weeks. The S&P 400 MidCaps and S&P 600 SmallCaps beat the S&P 500 last week with gains of 6.5% and 7.4%, led by Financials, Real Estate, and Utilities. For example, the regional banks rose 13.1%, 10.4%, and 11.5% in the S&P 500, S&P 400, and S&P 600 indexes respectively.
The stock market seems to be following the classic seasonal year-end script of weakness in September and October setting the stage for a Santa Claus rally. We concluded our November 1 QuickTakes with: “Santa may be early this year.”
An Epic Week II: Nothing To Fear for Now? From August through October, investors were spooked by the jump in the 10-year US Treasury bond yield from 3.96% on July 31 to 5.00% a week ago. Over that period, investors became increasingly concerned about the rapidly deteriorating outlook for the US budget deficit. Fed officials also spooked them by hammering them with their “higher-for-longer” mantra that interest rates would be kept restrictive for the foreseeable future.
However, last week, the bond yield fell from 4.93% on Tuesday, October 31 (Halloween) to end the week at 4.57% (Fig. 3). It was an epic rally in the bond market fueled by modestly bullish economic news that seems to have triggered a massive short-covering rally by the bears and a buying panic by the bulls.
Our friend Michael Brush, who is a columnist for MarketWatch, believes that the selling pressure in the bond market ended on October 31 because that was the deadline for money managers to finish tax-loss selling. The day before, on Monday, October 30, Pershing Square’s Bill Ackman revealed that he covered his bet against long-term Treasurys, believing that investors may increasingly buy bonds as a safe haven because of growing geopolitical risks. “There is too much risk in the world to remain short bonds at current long-term rates,” Ackman said in a post on X.
On Wednesday morning, the bond and stock rallies were fueled by a weak ADP private payroll employment report and the Treasury’s decision to do its next round of financing with more in bills and less in bonds. That afternoon, investors listened carefully to Fed Chair Jerome Powell’s press conference following the latest FOMC meeting and concluded that the Fed may be done raising interest rates. A better-than-expected Q3 productivity report on Thursday showed that unit labor costs, the main driver of inflation, fell to just 1.9% y/y during Q3 (Fig. 4). Friday’s weaker-than-expected employment report for October sent the yield back down to almost 4.50%.
In addition to getting spooked by the bond market in recent months, equity investors have been fearing that the war between Hamas and Israel would quickly turn into a regional war masterminded by the Mad Mullahs of Tehran. We have been, too. However, Hezbollah hasn’t opened a significant second front north of Israel, so far. Indeed, on Friday, Sayyed Hassan Nasrallah, the leader of the Lebanese militant group, in his first public comments since the start of the Gaza war, stopped short of announcing an all-out escalation of his group’s battles with Israel despite warning that all options were “on the table.”
Hezbollah has been exchanging fire with Israeli forces across the Lebanese-Israeli frontier since its Palestinian ally Hamas went to war with Israel on October 7. It marks the worst fighting at the frontier since a 2006 war but has mostly been contained to the border area. This suggests that Iran doesn’t want an all-out regional war that might force the US to come to the defense of Israel at this time.
US Economy: Immaculate Disinflation Update. The diehard hard-landers are still expecting a recession, but now it is in 2024 because 2023 is almost over with no sign of a hard landing. They started to predict a recession in 2022 when the Fed began to raise interest rates aggressively. When the yield curve inverted during the summer of 2022, they took that as a sure sign that a recession is imminent (Fig. 5).
Now that the yield curve is disinverting, the hard-landers claim that’s what it does just before a recession occurs. In the past, that’s been true: It would disinvert when the Fed lowered short-term rates faster than long-term rates fell in response to financial crises that quickly turned into credit crunches that caused the recessions. This time, the yield curve has been disinverting since the summer of this year for an entirely different reason, one that hardly suggests an imminent recession: It has disinverted because the bond yield rose faster than the federal funds rate and the two-year Treasury note yield, partly as a result of stronger-than-expected economic growth (Fig. 6)!
We are still soft-landers, assigning subjective odds of 35% to a recession before the end of 2024. As we’ve been expecting, inflation has been moderating without the Fed’s having to trigger a recession to bring it down. Last week’s employment and inflation data support our immaculate disinflation (i.e., without a recession) scenario. Consider the following:
(1) Employers still hiring. Job openings remained elevated during September, and the job-openings series in the Consumer Confidence Index survey remained high as well during its last reading, in October (Fig. 7). So why did payroll employment with and without government employment rise by only 150,000 and 99,000 during October? The supply of labor, as measured by the labor force, declined 201,000 during October, and the labor force participation rate edged down to 62.7% during the month (Fig. 8). That’s still below the pre-pandemic reading of 63.3% during February 2020. Employers still have plenty of job openings, but a shortage of qualified workers remains a problem.
(2) Wage inflation moderating. Notwithstanding the ongoing imbalance with the demand for workers exceeding the supply, wage inflation continues to moderate. It’s doing so because quits are falling as more workers stay put rather than move to a better-paying job for various reasons.
Average hourly earnings inflation edged down to 4.1% y/y during October for all workers. It fell to 4.4% for production and nonsupervisory workers (Fig. 9). During Q3, the Employment Cost Index for wages and salaries was down to 4.5%. These three measures of wage inflation are down from their 2022 peaks of 5.9%, 7.0%, and 5.7%. Also during Q3, hourly compensation rose 3.9% q/q (saar) and 4.2% y/y (Fig. 10).
(3) Productivity growth rebounding. The great news last week was that Q3’s nonfarm business productivity jumped 4.7% q/q (saar) and 2.2% y/y during Q3. We think that the economy started a productivity growth boom in early 2016 that was interrupted by the pandemic. Now it is likely to be accelerated by the aftereffects of the pandemic, particularly the labor shortage. We expect to see the current productivity growth boom peak by the end of the decade around 4.0%. That would allow real hourly compensation to grow as much. It would also support greater-than-expected economic growth while keeping a tight lid on inflation—the best of both worlds!
(4) YRI Earned Income Proxy flattening. The hard-landers point out that payroll employment excluding government payrolls rose just 99,000 during October. In addition, August and September payrolls were revised down by 101,000 together. Strike activity has had some negative impact on these numbers since August.
Nevertheless, the YRI Earned Income Proxy (EIP) for wages and salaries in private industry was flat during October. That suggests that the month’s retail sales might have been weak, especially on an inflation-adjusted basis. However, as we observed last week, consumers have other significant sources of personal income (i.e., interest, dividend, rental, and proprietors’ income), all of which are at record highs.
Bonds: The Treasury’s Bearish List & the Bond Vigilantes. Last week’s bond market rally confirmed our view that there would be sufficient buyers at a 10-year Treasury yield of 5.00% to boost demand enough to meet supply.
We’ve previously observed that the economy had no trouble living with a bond yield of 4.50% to 5.00% from 2003-07. That period was the Old Normal for bonds. It was followed by the New Abnormal period from the Great Financial Crisis through the Great Virus Crisis, when the major central bankers suppressed market forces, keeping interest rates close to zero and buying lots of bonds, all because they were panicked about deflation.
Above, Melissa and I listed some of the reasons that explain last week’s bond rally. We should add kudos to Barron’s for the October 30 cover story titled “Time To Buy Bonds.” The next day, on October 31, the Treasury Borrowing Advisory Committee (TBAC) submitted its regular report to Treasury Secretary Janet Yellen. It listed all the reasons why yields soared from August through October. That list did not include tax-loss selling pressure. It did mention that the federal deficit is troubling the bond market: “There is a view among market participants that the growing imbalance between supply of and demand for US Treasury debt may also have contributed to the sell-off.”
The Bond Vigilantes weren’t mentioned in the TBAC report. We attributed the selloff in the bond market partly to their adverse reaction to the recklessness of fiscal policy. Does last week’s rally suggest that they are no longer concerned? Of course not. Like Arnold Schwarzenegger’s character “The Terminator” (in the 1984 movie of the same name), they’ll be back if necessary to impose law and order In Washington.
Burritos, Stocks & Hydrogen
November 2 (Thursday)
Check out the accompanying pdf and chart collection.
Executive Summary: Packaged and fast food companies keep raising their prices, but consumers at nearly all income levels aren’t blinking at paying more. That was a common theme Jackie heard in the Q3 earnings calls of McDonald’s, Chipotle, and Unilever. … Also: What a difference a date makes! The stock market’s leaders and laggards among sectors over the first seven months of the year—prior to the S&P 500’s July 31 peak—bear little resemblance to those since July 31; former laggards-turned-leaders Health Care and Energy are cases in point … And: The discovery that large stores of pure hydrogen exist in nature holds exciting potential for powering the planet without polluting it.
Consumer Discretionary: Hamburgers, Burritos & Ice Cream. Prices on everything from hamburgers to burritos and ice cream are still rising, pushed up by companies passing on their own rising costs to customers. While price increases have been moderating since last year, they will likely continue to rise, particularly at restaurant chains with locations in California. The Golden State has passed a new law that will increase the minimum wage to $20.00 an hour for workers at restaurant chains starting in April. California’s fast-food workers currently earn an average of $16.60 an hour, and the state’s minimum wage is $15.50 an hour.
Prices for food services and accommodations rose 6.0% y/y in September as measured by the PCED. That’s higher than the 4.3% y/y rise in the non-housing services component of the PCED in September, but the increase in food services and accommodations prices has been decelerating since it peaked at 8.8% y/y in May 2022 (Fig. 1 and Fig. 2).
Chipotle, McDonald’s, and Unilever recently reported Q3 earnings. Here’s some of what their managements had to say on the demand and pricing front:
(1) Customers still eating out. For the most part, Chipotle and McDonald’s customers didn’t blink when facing pricier hamburgers and burritos. Chipotle’s Q3 sales rose by more than 11% y/y to $2.5 billion, including a 5% jump in same-store sales and a 4% increase in transaction growth. Adjusted earnings per share soared 19% y/y.
The company boosted prices by 3% in October, marking the fourth time it has hiked prices since June 2021, an October 30 CNBC article reported. Last year’s price increases were “mostly offset” by food cost inflation, including for beef and queso, said CFO Jack Hartung in the company’s earnings conference call. With that in mind, the company anticipates mid- to high-single-digit same-store sales growth in Q4.
McDonald’s Q3 revenue rose 14% y/y to $6.7 billion, with same-store sales increasing by 8.8% and US same-store sales increasing 8.1%. McDonald’s raised prices in the US by about 10% for all of 2023. Adjusted earnings per share rose 16% y/y.
(2) Different observations on low-income consumers. Chipotle’s Hartung noted that sales are doing well across all consumer income levels. He specifically noted that sales to lower-income consumers are “holding up really well. They’re really hanging in there at about the same level as our medium- and high-income levels.” The strong performance indicates that the company’s food remains affordable despite recent price increases.
McDonald’s US traffic fell y/y during Q3, which was attributed to tough comparisons to last year and reduced visits from customers who make less than $45,000 a year. Conversely, McDonald’s officials said it gained market share with middle- and high-income customers, who may be trading down to McDonald’s from more expensive dining options.
(3) California: The land of rising wages. California is raising the minimum wage earned by restaurant workers to $20.00 an hour in April. Chipotle’s average wage in the state is about $17.00 an hour, and about 15% of its restaurants are in the Golden State. To pay for the required wage increase, Chipotle will raise prices by percentages in the mid- to high single digits, Hartung estimated on the conference call.
In addition to higher prices, the company can improve its profitability via more use of drive-throughs and technology. Meals sold via the Chipotlane have better margins than those sold in the restaurants. Chipotle is also experimenting with advanced automation, including an “Autocado,” which cuts, cores, and scoops avocados, and Hyphen, a robotic assembly line that makes burrito bowls and salads.
McDonald's also expects to increase prices to offset some of the wage pressures it will face due to the new California law. It too will be looking for ways to increase productivity, said CEO Chris Kempczinski on the company’s recent conference call. In general, McDonald’s hopes it will weather the change better than its competitors and increase its market share as a result.
(4) A look at restaurants. Chipotle and McDonald’s both are members of the S&P 500 Restaurants stock price index, which after a strong run for most of 2022, has fallen 12.8% from its peak on May 2 (Fig. 3). Analysts are still optimistic that revenues will grow 9.8% this year and 8.7% in 2024 (Fig. 4). Earnings are also expected to grow sharply, by 16.3% and 11.1% this year and next (Fig. 5). The industry’s forward P/E, which spiked up to 23.2 during the Covid pandemic, has been falling in the ensuing years to a recent 17.6 (Fig. 6).
(5) Problematic price increases. Unilever brought in new CEO Hein Schumacher earlier this year to help turn around the struggling European consumer products company. Schumacher laid out his turnaround plans during the company’s Q3 earnings conference call, during which the company announced that sales grew 5.2% last quarter, with product prices climbing 5.8% and volume declining 0.6%.
One problem area in the company’s product portfolio was the Nutrition business, home to Hellmann’s and Knorr products. The business line’s sales rose 5.6%, reflecting a 9.8% increase in prices partly offset by a 3.8% sales volume decline. The company increased prices in response to “continued material cost inflation,” CFO Graeme Pitkethy said on the earnings conference call .
Meanwhile, ice cream sales dropped 2.8%, as a price increase of 8.2% was more than offset by a volume decline of 10.1%. Unilever owns Ben & Jerry’s, among other ice cream brands. The price increases did not offset all of the cost inflation the company faced, and higher prices pushed cost conscious consumers to trade down to value and private-label brands.
Schumacher’s restructuring plans include focusing on the company’s top 30 brands, emphasizing innovation, spending more on marketing, and pruning brands that underperform. He believes inflation will normalize “back to the levels that we had before we entered the inflation spike,” which should limit the price increases the company will need to take going forward.
The clock is ticking: Activist investor Nelson Peltz joined the company’s board of directors in July. Unilever’s shares have fallen 6.0% ytd through Tuesday’s close, compared to the S&P 500’s 9.2% gain over the same period.
Strategy: A Look at the Damage. The S&P 500 is up 9.2% ytd through Tuesday’s close, but that strong performance disguises much of the turbulence the market has experienced since its July 31 peak, at which point the index was up 19.5% for the year.
Here’s a look at how the performance data of S&P 500 sectors and industries have changed since the end of July and a bit about what investors were thinking to produce those shifts:
(1) Sector switches. Interest rates had been rising since early May, but this summer they shot higher, and stocks flinched. Every single sector in the S&P 500 has fallen since July 31; however, on a relative basis the Energy and Health Care sectors went from laggards in the first seven months of the year to leaders in the August-through-October timeframe.
S&P 500 sectors with stocks that typically are purchased for their dividend payments performed poorly both before and after July 31 this year. The dividend yields on the Real Estate, Utilities, and Consumer Staples sectors have lost their luster compared to today’s elevated Treasury yields.
Here’s the performance derby for the S&P 500 sectors as they’ve performed from July 31 through Tuesday’s close: Energy (-2.5%), Communication Services (-5.6), Health Care (-7.1), Information Technology (-8.3), Financials (-8.5), S&P 500 (-8.6), Consumer Staples (-9.7), Industrials (-10.9), Utilities (-11.1), Materials (-11.3), Consumer Discretionary (-11.4), and Real Estate (-13.3) (Table 1).
Note how different—and meager—those August-through-October performances are compared to the sectors’ performances in the year’s first seven months: Information Technology (45.8%), Communication Services (44.7), Consumer Discretionary (35.5), S&P 500 (19.5), Industrials (12.3), Materials (10.2), Financials (3.1), Real Estate (3.1), Consumer Staples (1.9), Energy (-0.5), Health Care (-1.5), and Utilities (-5.0) (Table 2).
(2) Insurance dominates. Everyone needs insurance, and the industry often performs well in good times and bad. Four of the top 15 best performing industries in the S&P 500 since July 31 hail from the insurance business, including the two best performing industries. They’ve benefitted from the ability to raise prices.
Here are the 15 S&P 500 industries that have performed the best from July 31 through Tuesday’s close: Property & Casualty Insurance (9.9%), Reinsurance (9.7), Technology Distributors (7.1), Oil & Gas Refining & Marketing (5.3), Publishing (4.9), Managed Health Care (4.7), Wireless Telecommunication Services (4.4), Integrated Telecommunication Services (4.3), Health Care Distributors (4.2), Communications Equipment (3.0), Multi-Line Insurance (2.7), Insurance Brokers (2.3), Data Processing & Outsourced Services (1.6), Apparel Retail (1.6), and Internet Services & Infrastructure (1.0).
(3) Picking through the rubble. Among the worst performing S&P 500 industries from July 31 through Tuesday’s close are Passenger Airlines (-34.0%) and Casinos & Gaming (-25.7%), which have fallen as oil prices rose and investors came to believe that the post-pandemic pent-up demand for travel has been satiated.
High interest rates keeping homeowners in homes with low-rate mortgages have taken a bite out of share prices in home-related industries including Household Appliances (-27.5%), Home Furnishings (-24.4), Building Products (-17.1), Home Improvement Retail (-15.9), and Homebuilding (-15.8). High interest rates have also hurt stocks industries that depend on financing to fund purchases, including Automobile Manufacturers (-25.1%). The high cost of financing has even hurt Health Care Supplies (-36.4%), the S&P 500’s worst performing industry of the period, as consumers often finance purchases of dental products like braces.
Rounding out the list of the S&P 500’s 15 worst August-through-October performers among industries are: Personal Care Products (-31.5%), Independent Power Producers and Energy Traders (-31.1), Leisure Products (-30.1), Drug Retail (-29.7), Apparel, Accessories & Luxury Goods (-24.7), Copper (-24.3), Office REITs (-23.9), Automotive Parts & Equipment (-20.5), and Regional Banks (-20.3).
Disruptive Technologies: White Hydrogen. Using naturally produced hydrogen to power our world would be beneficial because when hydrogen combusts, it throws off only water, with no carbon dioxide pollution. One of the knocks against the gas is that it often exists in nature in combination with other elements. Separating out the hydrogen requires energy that’s often provided by fossil fuels—like coal or natural gas—that do throw off greenhouse gases when they combust.
The pure hydrogen found in nature is called “white” hydrogen, while hydrogen produced by burning fossil fuels is called “blue” or “gray” hydrogen, and hydrogen produced by using solar or wind power is called “green” hydrogen.
Until recently, it wasn’t thought that white hydrogen occurred in nature in volume. But a recent discovery has scientists questioning that assumption and wildcatters digging wells. Read on for details:
(1) Explosive discovery. Researchers from France’s National Centre of Scientific Research discovered a large reservoir of hydrogen in northern France that could contain between 6 million and 250 million metric tons of the gas, an October 29 article in CNN reported. The researchers went looking for hydrogen deposits because they had heard about a water well in Mali that was spewing hydrogen. The hydrogen in the well was harnessed in 2011 to power a village and continues to do so today.
Scientists believe large deposits of hydrogen are formed when water molecules break down as a result of reacting with iron-rich rocks or coming into contact with radiation. White hydrogen deposits have also been found in the US, Eastern Europe, Russia, Australia, and Oman.
Geoffrey Ellis, a geochemist with the US Geological Survey, “estimates globally there could be tens of billions of tons of white hydrogen. … [I]f just 1% can be found and produced, it would provide 500 million tons of hydrogen for 200 years...” Only 100 million tons a year of hydrogen is currently being produced, and production isn’t expected to hit 500 million until 2050.
(2) A new gold rush. A number of startups are scouring the Earth to find large hydrogen deposits, the CNN article states. Australia-based Gold Hydrogen is drilling in South Australia. Denver-based Koloma hasn’t disclosed where it’s drilling, but it has received funding from Bill Gates’ Breakthrough Energy Ventures and others. And Natural Hydrogen Energy is another hydrogen wildcatter, based in Denver.
Corrigendum. In yesterday’s Morning Briefing, there was an error in the MegaCap-8’s share of the S&P 500. The affected areas are reproduced below with corrected text underlined and italicized:
Strategy: MegaCap-8’s Growing Share of S&P 500. In spite of the stock market’s decline back to correction territory from its July 31 high, the MegaCap-8 group of stocks (Alphabet, Amazon, Apple, Meta, Microsoft, Netflix, Nvidia, and Tesla) remains at or near its recent record-high shares of the S&P 500’s market capitalization, forward revenues, and forward earnings (Fig. 6). It’s helpful to remember how high these shares are when considering S&P 500 performance, valuation, and earnings data: A good chunk of that data is attributable to just eight stocks! (FYI: Forward revenues and earnings are the time-weighted average of analysts’ consensus projections for the current and following years; forward profit margins we calculate from forward revenues and earnings.)
Specifically, the MegaCap-8’s collective market-cap share of the S&P 500 was 27.1% during the October 27 week, little changed from its record high 27.4% during the October 6 week. The group’s forward revenue share dropped by just a hair in recent weeks to 10.63% from 10.65% (August 31 week), while its forward earnings rose to a record high 17.54% share.
Other Central Bankers & The MegaCap-8, Again
November 1 (Wednesday)
Check out the accompanying pdf and chart collection.
Executive Summary: Today, Melissa reviews how monetary policies are being conducted outside the US. Japan’s BOJ has given itself more latitude in policy decisions, retracting a commitment to retain its long-standing ultra-easy stance and widening its target interest-rate range. … China’s PBOC and central government have been working to stimulate its economy by numerous means. ... Europe’s ECB finally paused its rate-hiking recently after a 10-hike streak and trimmed its balance-sheet assets; no more rate hikes or reductions are likely for a while. … Also: Joe updates data on the MegaCap-8 stocks’ growing share of the S&P 500.
Global Central Banks I: BOJ Tweaks Accommodation. Since Bank of Japan (BOJ) Governor Kazuo Ueda assumed office in April, succeeding Governor Haruhiko Kuroda, Japan’s central bank has gradually shifted toward a less accommodative monetary policy stance. Shortly after the change at the helm, the BOJ removed its commitment to maintaining interest rates at current or lower levels; that was on April 28.
Previously, in December 2022, the BOJ enhanced its flexibility by widening the range around its yield target. It did so again in July and once again at the two-day meeting that concluded yesterday.
The BOJ’s October 31 Statement on Monetary Policy explains that the bank is retaining its long-standing super-accommodative monetary policy while making slight modifications to its yield curve control (YCC) bond purchasing plan. The YCC’s objective has been to anchor 10-year Japanese government bond (JGB) yields around the zero mark through appropriate bond purchases. However, the YCC policy is increasingly questionable now that the yield is approaching 1.00%.
In recent months, inflation in Japan has consistently exceeded the BOJ’s 2.0% target. As a result, investors are closely watching the BOJ for signs that they may abandon the YCC policy. This may involve reducing the pace of bond purchases or eliminating the program’s long-term interest rate target altogether. Governor Ueda acknowledged this possibility during a July press conference, stating, “The risk of us being forced to abandon YCC against our will is not zero,” reported CNBC.
The unexpected moves made by the BOJ in December and July surprised investors, whereas yesterday’s subtle adjustment was more widely anticipated. Melissa and I are anticipating a more significant YCC adjustment at the BOJ’s final meeting of the year, on December 18-19.
Let’s dive into where the BOJ currently stands:
(1) Policy tweaks. The BOJ made slight adjustments to its ultra-easy monetary policy last month. While maintaining the short-term interest rate target at -0.1%, the bank altered its YCC policy. In the September statement, the BOJ announced that it would permit 10-year JGB yields to fluctuate within a range of around plus or minus 0.5ppt from the target level, offering to purchase 10-year JGBs at 1.0% daily.
However, the latest move by the bank eliminated the plus or minus 0.5ppt range and introduced a flexible “upper bound” of 1.0% for 10-year JGB yields. In the statement’s footnotes, the bank clarified that it would “determine the offer rate for fixed-rate purchase operations each time, taking market rates and other factors into account.” Essentially, the 1% offer on the bank’s 10-year JGBs could rise without a specific limit.
As of Monday’s close, the 10-year JGB yield was just slightly below the central bank’s flexible reference cap (Fig. 1).
(2) Stagnating purchases. Despite the unprecedentedly high bank balance-sheet assets—which have risen from around 450 trillion yen in 2016 at the beginning of YCC to nearly 750 trillion yen today—purchases clearly have stalled since earlier this year (Fig. 2). Additional purchases could be a challenge, as the bank already owns a very large share of the Japanese bond market.
(3) Inflation overshooting. Japan’s consumer price index, excluding fresh food, has exceeded the bank’s 2.0% y/y target rate consistently since summer 2022, coming in at 2.8% this September (Fig. 3). The bank attributes the prolonged cost increases to a rise in import prices and recent crude oil price increases; it anticipates a 3.0% rate at year-end, up from a previous forecast of 2.8%.
(4) BOJ lagging. In stark contrast to the BOJ’s unyielding ultra-easy policy stance, the Fed has been tightening over the past year—most recently keeping rates unchanged after an aggressive series of hikes—while the European Central Bank (ECB) has taken the bold step of raising its main rates to their loftiest levels in over two decades and is now pausing in restrictive territory. It’s likely that the BOJ won’t be as aggressive as those two counterparts, but inevitably will be on a tightening path soon too.
Global Central Banks II: PBOC on Easing Street. An October 24 Bloomberg article explored the People’s Bank of China’s (PBOC) attempts to bolster short-term liquidity in China’s financial system. Maintaining bank funding costs below the PBOC’s preferred rate has been challenging owing to scarce liquidity, primarily a result of surging government debt and tax payments.
Consequently, the PBOC has increased its support to uphold low borrowing costs. Over three days last week, the central bank injected a record net amount of 1.96 trillion yuan (equivalent to $268 billion) in short-term cash into the financial system, according to Bloomberg’s calculations. Simultaneously, outstanding one-year policy loans are on track to reach a historical high of 5.7 trillion yuan after a mid-October operation.
Throughout this year, Beijing’s central planners have been working to bolster the fragile economy, with particular focus on the ailing property sector. Their measures have encompassed reductions in benchmark rates, bank reserve requirements, and various liquidity-boosting initiatives, wrote BNN Bloomberg.
In a report delivered to the Standing Committee during the weekend of October 21, Governor Pan Gongsheng of the PBOC vowed to implement more targeted and robust policy measures. Notably, Chinese President Xi Jinping recently visited the PBOC, the first such visit during his decade-long tenure. The purpose of the visit remains undisclosed, but it undoubtedly pertained to coordinating the nation’s fiscal stimulus policies. A few days later, Chinese authorities announced one of the most substantial alterations to the national budget in years, along with a plan to issue 1 trillion yuan (equivalent to $137 billion) in government bonds.
Following a surge in interest rates yesterday, a source close to the central bank indicated that the PBOC is likely to inject additional liquidity into the money market.
Global Central Banks III: ECB Hunkers Down. On October 26, the ECB delivered a pivotal decision by ending its long streak of interest-rate increases. The interest rates on the main refinancing operations, marginal lending facility, and deposit facility all were maintained at 4.50%, 4.75%, and 4.00%, respectively. This pause came after an impressive run of 10 consecutive interest-rate hikes, starting in July 2022 and concluding in September 2023, which lifted the deposit facility rate out of negative territory.
Simultaneously, the ECB has actively trimmed the assets on its balance sheet, primarily by reducing its routine asset purchases and reinvestments while still retaining pandemic-related assets. The likelihood of further rate hikes appears remote, and we don’t anticipate any rate reductions until the second half of 2024.
Here are more key insights:
(1) Inflation easing. Despite pausing the rate hikes, the ECB’s Monetary Press Release underscores the persistence of inflation concerns, stating, “Inflation is still expected to stay too high for too long, and domestic price pressures remain strong.” However, it acknowledges that inflation notably receded in September, partly due to robust base effects, and most indicators of underlying inflation continue to soften.
The Eurozone’s headline CPI rate moderated to 2.9% y/y in October, while the core rate fell but remained elevated at 4.2% (Fig. 4).
(2) Rates adequate. The ECB believes that its previous interest-rate increases effectively have dampened demand, contributing to the moderation of inflation, and that current interest-rate levels are “sufficiently restrictive.” It pledges to maintain them “as long as necessary.”
(3) Shrinking balance sheet. The ECB’s total assets have dropped significantly from their peak in late June 2022, driven by the reduction in asset purchases and reinvestments under the Asset Purchase Program (Fig. 5). On the other hand, the bank has committed to reinvesting principal payments from maturing securities purchased under the Pandemic Emergency Purchase Program through at least the end of 2024.
Strategy: MegaCap-8’s Growing Share of S&P 500. In spite of the stock market’s decline back to correction territory from its July 31 high, the MegaCap-8 group of stocks (Alphabet, Amazon, Apple, Meta, Microsoft, Netflix, Nvidia, and Tesla) remains near its recent record-high shares of the S&P 500’s market capitalization, forward revenues, and forward earnings (Fig. 6). It’s helpful to remember how high these shares are when considering S&P 500 performance, valuation, and earnings data: A good chunk of that data is attributable to just eight stocks! (FYI: Forward revenues and earnings are the time-weighted average of analysts’ consensus projections for the current and following years; forward profit margins we calculate from forward revenues and earnings.)
Specifically, the MegaCap-8’s collective market-cap share of the S&P 500 was 27.1% during the October 27 week, little changed from its record high 27.4% during the October 6 week. The group’s forward revenue and forward earnings shares likewise have dropped by just a hair in recent weeks: forward revenues to 2.18% from 2.19% (October 6 week) and forward earnings to 17.25% from 17.34% (September 1 week).
With the Q3-2023 earnings season now more than half finished, I asked Joe to give us an update on the MegaCap-8’s surprise metrics to date and discuss just how much they’ve contributed to the S&P 500’s “REMs” (revenues, earnings, and margins). Here’s his report:
(1) MegaCap-8 Q3 surprise review. Six of the MegaCap-8 stocks have reported Q3 results so far (all but Apple and Nvidia). Among the reporters, all but Tesla beat the analysts’ consensus forecast for revenues and earnings. Collectively, these six have beaten the aggregate revenue forecast by 1.3% and the aggregate earnings forecast by 16.2%. They’ve recorded y/y growth in revenues of 12.8% and in earnings of 58.7%. Their aggregate profit margin of 17.8% well exceeded the 15.5% forecast.
Here’s how each of the six MegaCap-8’s fared in Q3. Their revenue and earnings surprises were mostly positive: Alphabet (1.0% revenues surprise, 6.8% earnings surprise), Amazon (1.2, 60.9), Meta (1.7, 20.9), Microsoft (3.7, 12.7), Netflix (0.1, 6.9), and Tesla (-3.1, -8.2). Their y/y revenue and earnings growth rates were mostly positive too, topped off with a sprinkling of triple-digit percentage earnings growth rates: Alphabet (11.0% y/y revenues growth, 46.2% y/y earnings growth), Amazon (12.6, 452.9), Meta (23.2, 167.7), Microsoft (12.8, 27.2), Netflix (7.8, 20.3), and Tesla (8.8, -37.1)
(2) S&P 500 Q3 results with and without the MegaCap-8. The S&P 500 companies that have reported so far have a revenue surprise of 0.9% and have beaten earnings forecasts by 7.9%. Revenues are up 2.0% y/y and earnings up 6.8% y/y. The S&P 500’s profit margin of 13.2% for companies that have reported so far exceeds the 12.4% forecast and compares favorably to the 12.6% recorded a year earlier in Q3-2022.
The S&P 500 results without the MegaCap-8 reporters to date are mostly weaker. The revenue surprise remains unchanged at 0.9%, but the earnings surprise drops to 6.1% from 7.9%. The y/y growth rates are weaker too, dropping to just 0.3% from 2.0% for revenues and falling to a y/y decline of -1.2% from 6.8% for earnings. The S&P 500 ex-MegaCap-8 profit margin for Q3-2023 drops to 12.5% from 13.2% but still exceeds the forecasted 11.1% and is up from 11.9% a year earlier in Q3-2022.
(3) MegaCap-8’s share of results rose in Q3 and is expected to remain high. On a blended actual/estimate basis, the MegaCap-8’s share of S&P 500 revenues rose to a three-quarter high of 10.7% in Q3-2023 from 10.4% in Q2-2023. The group’s earnings share rose to an 11-quarter high of 19.0% from 17.5%.
Looking ahead to Q4-2023, the group’s shares of the S&P 500’s revenue and earnings are expected to rise to new record highs of 12.2% for revenues and 21.2% for earnings. They’re expected to remain high at least through Q3-2024. Analysts are estimating the MegaCap-8’s revenues share of the S&P 500 to be between 11%-12% with an earnings share of 18%-21%. Revenues are expected to grow at a 12%-13% y/y rate from Q4-2023 to Q4-2024. Earnings growth is expected to decelerate, though, as Nvidia’s y/y growth slows from its torrid triple-digit percentage pace in 2023. Analysts expect the peak y/y earnings growth of 52.8% in Q3-2023 to drop to 43.4% in Q4-2023 before slowing to 10.3% in Q3-2024.
(4) MegaCap-8 on a blended basis. Our earlier analysis primarily focused on the companies that have reported so far. Investors are still waiting on results for the last two MegaCap-8 companies, Apple and Nvidia. Apple’s fiscal Q4 results are due out on Thursday, and Nvidia’s October-quarter results on November 21.
For the group as a whole (using current estimates for Apple and Nvidia), y/y revenue growth picked up to a six-quarter high of 12.1% in Q3-2023 from 10.2% in Q2-2023, and y/y earnings growth is expected to accelerate sharply to a nine-quarter high of 52.8% from 29.4%. The profit margin is expected to rise to a nine-quarter high of 22.2% in Q3-2023 from 20.1%.
However, a third-straight blowout quarter by Nvidia—which has an expected profit margin of 52.0% for Q3-2023—could carry the group over and above its prior record-high profit margin of 23.0%, recorded during Q1-2021. Analysts expect a 24.6% profit margin for Apple.
Trick Or Treat?
October 31 (Tuesday)
Check out the accompanying pdf and chart collection.
Executive Summary: Treat: Consumers’ soaring net worth since the pandemic has reduced their need to save, in our opinion. That might explain why consumer spending has been resilient despite hard-landers’ warnings that households were depleting their excess saving and would have to retrench by now. … Treat: Inflation is still on course to fall to the Fed’s 2.0% target. … Trick: The Treasury might spook investors again on Wednesday when it details its next round of financing needs.
Weekly Webcast. If you missed Monday’s live webcast, you can view a replay here.
Consumers: Beware of the Saving Rate? Halloween arrived early on Wall Street. Investors have had lots to be spooked about since early this year, when the consensus was that the economy would fall into a recession. That hasn’t happened so far, mostly because consumer spending remained surprisingly strong.
The hard-landers have been expecting that consumers would have to start saving more this year once their excess saving windfall (accumulated during the pandemic) was depleted. They’ve reckoned that would happen around now. They could still be right, but it doesn’t look that way from consumers’ recent behavior: Consumers have been reducing their saving rate in recent months, bolstering the upward trend in their inflation-adjusted disposable income.
That behavior is consistent with our view that consumers’ net worth has soared since the pandemic, reducing their need to save. In addition, retiring Baby Boomers are likely spending the “excess saving” they accumulated during their careers in retirement accounts. Let’s have a closer look at the latest relevant data:
(1) Disposable income is on an uptrend. Excluding the three rounds of pandemic relief checks, real disposable personal income (RDPI) mostly fell during 2020 through 2022. This year, it rose 3.0% during the first nine months of the year (Fig. 1). It dipped 0.4% over the last three months, mostly because of a spike in gasoline prices.
Bolstering real RDPI since the end of the lockdowns has been aggregate weekly hours worked, which is payroll employment multiplied by the average length of the workweek in the private sector (Fig. 2). Depressing RDPI has been real average hourly earnings (RAHE), which stagnated during 2020-22 as inflation soared (Fig. 3). This year, it has resumed climbing along its uptrend since 1995, i.e., growth at a 1.2% annual rate on average.
(2) Saving rate remains low. Household net worth rose to a record $154.3 trillion at the end of Q2-2023 (Fig. 4). That’s up $37.6 trillion since the end of 2019, just before the pandemic. It’s been hovering around a record 8.0% of disposable personal income over this period (Fig. 5). Half of households’ net worth (i.e., $77.1 trillion) is owned by the Baby Boomers (Fig. 6).
The Baby Boomers are currently 59-77 years old (Fig. 7). The oldest of them turned 65 years old during 2011 (Fig. 8). Since then, the number of seniors (i.e., aged 65 or older) has increased by 18.3 million, with 4.1 million of those younger seniors remaining in the labor force and 14.2 million having dropped out of the labor force.
The pandemic probably convinced more Baby Boomers to retire or to work part-time from home. The ones who are retiring must be saving less and spending more of their retirement net worth. If so, then the personal saving rate may remain below its pre-pandemic level. It was 7.2% during January 2020. It was down to 3.4% in September.
Inflation: Beware of the Devil in the Details? Investors have been spooked by inflation since Halloween 2021 as the CPI soared to peak at 9.1% during June 2022. It was down to 3.7% during September of this year. Yet investors are still spooked, fearing that inflation will remain stuck above the Fed’s 2.0% target or will rebound as it did during the 1970s. Consider the following:
(1) We’ve recently observed that the headline and core CPI inflation rates were both 2.0% in September excluding shelter. Of course, the Fed tends to give more weight to the PCED inflation rate. The headline and core inflation rates for this measure of consumer prices were 3.4% and 3.7% during September (Fig. 9).
Excluding rent, the headline and core PCED inflation rates were down to 2.8% and 3.0% in September (Fig. 10). Both are down sharply from their 2022 peaks of 7.4% and 5.9%.
(2) Yes, but what about the “supercore” inflation rate that Fed Chair Powell has been focusing on? It is the PCED inflation rate excluding energy and housing. It edged down to 4.3% in September but has been stuck around 4.5%-5.0% for the past 27 months (Fig. 11). We are optimistic that it too will moderate in coming months given the sharp drop in the core CPI excluding shelter in recent months.
(3) And what about “Swiftflation”? The PCED inflation rate for movies, theaters, concerts, and sporting events jumped to 5.6% just before “Taylor Swift: The Era Tour” concert this past summer (Fig. 12). It jumped again to 10.4% when Taylor Swift started attending football games to see her boyfriend play.
(4) They say that the devil is in the details. That may very well be true about the outlook for inflation. However, inflation is usually defined as a general and relatively broad increase in prices. In any one month, a few of the CPI’s components might account for much of the increase or decrease that month. It’s the underlying trend that matters. That’s what we look to most for either confirmation of our outlook or the need to change it. The latest data confirm for us that our narrative remains on track: Inflation is continuing to moderate.
Federal Deficit: Beware of Janet Yellen? Janet Yellen is very mild mannered. When she was running the Fed, we often referred to her as the “Fairy Godmother of the Bull Market” in stocks. She is widely respected. Now as the Secretary of the US Treasury, her most powerful detractors are the Bond Vigilantes. They claim that she was wrong about the inflationary consequences of the Biden administration’s 2022 fiscal spending acts. They are also upset about the huge federal deficits that are widening under her watch. So they’ve pushed the bond yield up to 5.00% in protest and are threatening to push it higher if she doesn’t respond to their concerns.
She responded to their threats on October 26 at an event in Bloomberg’s Washington office. She dismissed the notion that bond yields are rising just because the Treasury’s financing needs have swelled. She stated: “I don’t think much of that is connected.” She blamed higher interest rates on the strong economy: “The economy is continuing to show tremendous robustness and that suggests that interest rates are likely to stay higher for longer,” she said.
She supported her spin by stating that interest rates are going up in advanced countries around the world even those without significant government budget deficits. That’s a weak argument since interest rates around the world tend to follow the lead of US interest rates.
Yellen will provide the trick or treat on Wednesday when the Treasury will detail its next round of financing needs.
Geopolitics, GDP & Inflation
October 30 (Monday)
Check out the accompanying pdf and chart collection.
Executive Summary: We recently raised our subjective odds of a US recession before year-end 2024 from 25% to 35% mostly because the geopolitical risks continue to escalate. We see two potential scenarios that could result in a recession, but they don’t warrant raising our recession odds at this time. The US economy remains resilient; we review recent areas of strength. … Also: Further escalation of war in the Middle East could bring unsettling uncertainty to the stock market against a backdrop of well known headwinds and a troubled Chinese economy. … And: We review the latest inflation news. We don’t expect the Fed to surprise markets with a rate hike this week.
YRI Weekly Webcast. Join Dr. Ed’s live webcast with Q&A on Mondays at 11 a.m. EST. You will receive an email with the link one hour before showtime. Replays of the weekly webcasts are available here.
Geopolitics: Getting More Dangerous. The S&P 500 is now down 10.3% since it peaked this year at 4588.96 on July 31 (Fig. 1). The S&P 500 equal-weighted index is down 13.7% since then. The Nasdaq is down 7.9% from its July 19 high (Fig. 2).
This selloff occurred because the 10-year Treasury bond yield spiked from around 4.00% to 5.00% over this short period. It did so because the Treasury announced on July 31 that the government needed to raise $1.0 trillion during Q3. The next day, on August 1, Fitch Ratings downgraded US government debt from AAA to AA+. The economic indicators released since then showed that economic growth was strong, led by better-than-expected consumer spending. In addition, at his September 20 press conference, following the latest FOMC meeting, Fed Chair Jerome Powell reiterated that interest rates are likely to stay higher for longer. Indeed, the FOMC’s Summary of Economic Projections showed that the committee now expects to cut the federal funds rate by 25bps only twice next year rather than four times as was indicated in June’s SEP.
However, the bond yield seems to have found buyers at 5.00% last week and dipped to 4.84% by the end of the week. Thursday’s real GDP report for Q3 showed an increase of 4.9%, about as expected. Yet last week, the S&P 500 fell 2.5% as the Nasdaq experienced a mini tech wreck, falling 2.6%. The earnings reports issued by Google and Facebook did disappoint, but those of Microsoft, IBM, Intel, and Amazon beat expectations.
Joe and I think that the stock market was hit hard by unsettling news out of the Middle East suggesting that the war between Israel and Hamas is spreading. On Thursday, October 19, the USS Carney, a guided missile cruiser operating in the Red Sea, shot down four cruise missiles fired by the Iranian-backed Houthi rebels toward Israel. According to an October 24 WSJ article, a fifth missile was intercepted by Saudi air defense systems, operating to protect Saudi airspace.
The US launched strikes on Iran-linked facilities in Syria on Thursday in retaliation for a series of drone attacks on American military bases in the region, Defense Secretary Lloyd Austin said. From October 17 to Thursday, US and coalition forces were attacked at least 19 separate times in Iraq and Syria by a mix of drones and rockets, according to defense officials. ABC News reported that Austin said, “US military forces conducted self-defense strikes on two facilities in eastern Syria used by Iran’s Islamic Revolutionary Guard Corps (IRGC) and affiliated groups. These precision self-defense strikes are a response to a series of ongoing and mostly unsuccessful attacks against U.S. personnel in Iraq and Syria by Iranian-backed militia groups that began on October 17."
The Biden administration is starting to acknowledge publicly that Iran is the head of the terrorist snake. The administration is sending more forces into the Middle East, including two aircraft carrier groups, additional fighter jets, and missile-defense systems. On Friday, in a speech at the United Nations, Iran’s foreign minister threatened that the US will not escape unaffected if the Hamas-Israel war turns into a broader conflict, firing back after the Biden administration said Iran was ultimately to blame for the recent spate of drone attacks on American forces.
We raised our subjective odds of a recession in the US occurring before the end of 2024 from 25% to 30% on October 10 and again to 35% on October 23 mostly because of the war in the Middle East. Should we do so again now? We’ve decided not to, but we can envision two potential narratives unfolding that could increase the odds of a recession in the US. Here is our thinking:
(1) Recessionary scenario #1: The war in the Middle East spreads, and oil prices soar. In recent years, we’ve viewed geopolitical crises as short-term events that provided buying opportunities in the stock market. But the current crisis has the potential to be a lengthy one and to widen into a regional war. That could spike the price of oil if Iran’s oil exports are reduced by the toughening of US sanctions or if the country’s oil export facilities are attacked. Any spike might not last very long since Saudi Arabia is likely to boost its exports in response. The question then would be whether Iran’s surrogates in Yemen would send drones or missiles to attack Saudi oil production, as they did in 2019 and again in 2022. So there is that potential oil price catalyst to a US recession to consider.
(2) Recessionary scenario #2: Biden’s guns-and-butter fiscal policies enrage the Bond Vigilantes. Perhaps a more plausible reason to raise the odds of a recession is that the high federal budget deficit could be pushed even higher by defense spending, causing bond yields to rise to levels that cause a recession. The US military is facing more challenges than usual—fighting a proxy war against Russia in Ukraine and supporting Israel militarily and fending off Iran-backed terrorists in the Middle East. Meanwhile, the US must provide military deterrence to keep China from invading Taiwan. As a result, defense spending will have to increase at a time that the federal budget deficit is the highest ever excluding the pandemic period.
That could worsen the partisan divide not only between Democrats and Republicans in Congress but also the divides between the extreme wings of both parties from their moderate factions. The Bond Vigilantes might then join the fight by pushing up bond yields to levels that cause a recession.
Meanwhile, the backdrop against which those potentialities could take place includes:
(1) China’s property market disaster is depressing the world economy. The global economic outlook is weighed down by the poor prospects for economic growth in China, as we discussed last week in Tuesday’s Morning Briefing. China’s economic recovery has been weighed down by a slump in its real estate sector, with major property developers China Evergrande Group and Country Garden Holdings Co. saddled with heavy debts. The real estate market accounts for some 30% of China’s GDP. Evergrande filed for bankruptcy in a New York court in August. During the first nine months of 2023, investment in real estate development dropped 9.1% y/y.
China’s slow-motion property market collapse is likely to depress the country’s economy for years.
(2) The US remains the shining city upon a hill. The good news is that the US economy remains resilient, inflation is still on a moderating trend, corporate earnings are growing, the Fed is probably done tightening, and the bond market may be stabilizing. The odds of a recession resulting from the current geopolitical mess are still no greater than 35%, in our opinion, given these positives.
(3) Nothing to fear but fearful developments. Nevertheless, any escalation of the war in the Middle East is bound to unsettle the stock market (and us) by generating more uncertainty about the eventual outcome.
The other problems are well known but still unsettling: Fiscal policy is out of control, the US government is dysfunctional, the Bond Vigilantes are riding high, inflation remains above the Fed’s target, cracks are showing up in the credit system, and geopolitical analysts are wondering whether the US can handle three wars if China attacks Taiwan. Plus, there are China’s property market problems weighing on its economic activity, as discussed above.
So everything is fine with a few notable exceptions.
GDP: No Hard Feelings. Our relatively optimistic economic outlook through the end of 2024 is somewhat less optimistic now that we have lowered its subjective odds to 65% from 75% in early October. While we’ve been in the optimistic camp on the resilience of the economy since early last year, we certainly didn’t expect that real GDP would grow 4.9% during Q3 until the monthly indicators suggested that neither the hard-landers nor the soft-landers had it right.
In his September 20 press conference following the latest FOMC meeting, Fed Chair Jerome Powell said: “[T]he economy has been stronger than many expected given what’s been happening with interest rates. Why is that? … [H]ousehold balance sheets and business balance sheets have been stronger than we had understood, and so spending has held up. … The savings rate for consumers has come down a lot. The question is whether that’s sustainable. [I]t could just mean that the date of [the monetary tightening] effect is later. It could also be that … the neutral rate of interest is higher for various reasons. We don’t know that. It could also just be that policy hasn’t been restrictive enough for long enough.”
Let’s review the recent areas of strength and consider whether they might continue to keep the economy remarkably resilient:
(1) Strong despite rate shock. The Citigroup Economic Surprise Index has remained higher for longer near previous cyclical peaks this year (Fig. 3). This is one of the reasons why the bond yield has risen more than widely expected this year. The question now is whether the US economy can grow with the bond yield at 5.00%, up dramatically from 0.52% during August 2020 (Fig. 4).
On the one hand, the bond yield has normalized to where it was before the Great Financial Crisis from 2002-07, when the economy was expanding. On the other hand, the last time that the yield rose 500bps in such a short time was from 1977 to 1979, which was followed by two recessions in the early 1980s. Then again, both the household and business sectors refinanced quite a bit of their debts at record-low interest rates during the pandemic period.
While real GDP rose 2.9% y/y during Q3, nominal GDP rose 6.3% y/y (Fig. 5). So the bond yield at around 5.00% is still below the growth rate of nominal GDP. During their heydays of the 1980s, the Bond Vigilantes forced yields above nominal GDP growth and raised them three times to slow nominal GDP growth. We are expecting that nominal GDP growth will slow along with inflation with the result that the bond yield remains around 5.00%.
(2) Consumers have several sources of income. Let’s not forget that many households benefit from higher interest rates. Interest income in personal income rose to a record $1.8 trillion during September, up $300 billion from two years ago (Fig. 6). Also at record highs in personal income are proprietors’ income ($1.9 trillion), dividend income ($1.8 trillion), and rental income ($1.0 trillion). These four sources of income totaled a record $6.5 trillion in August and were equivalent to 54% of wages and salaries income.
A large percentage of all that non-wage income was earned by older American households, including many retiring Baby Boomers. As we’ve previously discussed, the Baby Boomers are spending lots of their income on labor-intensive services, which explains why the labor market has been so resilient in the face of tightening credit conditions.
(3) Signs of rolling recovery in consumer goods. During the pandemic, the ratio of real consumer spending on goods to spending on real services soared from March 2020 through March 2021 (Fig. 7). This buying binge for goods fizzled when consumers were able to binge on services, causing the ratio to decline. But the ratio has flattened out in recent months, suggesting that the rolling recession in consumer goods is bottoming and could be turning into a rolling recovery. That’s confirmed by the upturn in both the M-PMI through September and the uptrend since early this year in the four regional business surveys available through October (Fig. 8). However, both remain in contractionary territory.
(4) WFH cushions oil price shocks. By the way, since more consumers are working from home (WFH) now than before the pandemic and fewer commuting, jumps in gasoline prices aren’t as taxing on household budgets as they used to be. Consumers also now have more flexibility to respond quickly to gasoline price increases by driving less in their neighborhoods. That’s what happened when gasoline prices jumped this summer, then dropped when demand weakened recently (Fig. 9). (Consumers may now be the Oil Vigilantes!)
Inflation: Still Moderating Enough for the Fed? The FOMC meets on Tuesday and Wednesday. Might they surprise the financial markets and raise the federal funds rate after all? Melissa and I doubt it given the significant rise in the bond yield since the last meeting on September 19-20.
At his post-meeting press conference on Wednesday, Powell is likely to remain as hawkish as he was during his interview on October 19. He undoubtedly will acknowledge that inflation has been moderating, but he will reiterate that it remains too high and that the Fed needs to maintain a restrictive monetary policy stance. Here is a brief overview of the latest inflation data:
(1) Expected inflation. On Friday, the bad news was that the Consumer Sentiment Index survey showed that October’s one-year expected inflation rate jumped to 4.2%, up from 3.2% the month before (Fig. 10). This series tends to be highly influenced by the price of gasoline, which is starting to come down. The comparable survey conducted by the Federal Reserve Bank of New York earlier this month reported that expected inflation over the coming year was 3.7%.
The five-year-ahead expected inflation rate was 3.0% in both surveys. In the Fed’s lexicon, “inflationary expectations remain well anchored.”
(2) PCED inflation. The headline PCED inflation rate remained at 3.4% y/y during September (Fig. 11). The core rate continued to moderate down to 3.7%. Goods inflation has turned out to be transitory after all. It was only 0.9%, with durable goods down 2.3% and nondurable goods inflation up 2.7% (Fig. 12).
The inflation rate for housing and utilities peaked at 8.3% in June and fell to 7.2% in September (Fig. 13). That’s still quite high but is widely expected to continue to fall in coming months, including by Fed officials.
The so-called “super-core” inflation rate remains sticky. This is the PCED core services inflation rate excluding housing-related items (Fig. 14). It did edge down to 4.3% in September. It too is likely to fall in coming months, as suggested by the CPI services less rent of shelter inflation rate.
Consumer Spending, China & Robots
October 26 (Thursday)
Check out the accompanying pdf and chart collection.
Executive Summary: Is the consumer spending pendulum swinging back to bingeing on goods from splurging on services? Jackie sees a few nascent signs pointing to that possibility. … Also: The Chinese government has been trying to pull China’s economy up by its bootstraps with new infrastructure projects, but critics say the initiatives are too small to make much difference. Property developers remain distressed, and economic activity is likely to remain anemic. … And: In our Disruptive Technologies spotlight are humanoid robots. We look at how they’re being deployed today and what they may be used for in the future.
Consumer Discretionary: Pivoting Back to Goods? Remember the spending boom on things that helped us adjust to being trapped at home during the pandemic? Sales of items like home office equipment, outdoor heaters, and bikes surged, then fell sharply as consumers switched to bingeing on services and experiences. Hanging out on the deck wearing a winter coat under a heater was out, and “revenge travel” was in.
But now many people have scratched their travel itch, and buying goods may make a resurgence just in time for the holiday shopping season. The ratio of what consumers spend on goods versus what they spend on services spiked from 0.48 in December 2019, just before the pandemic, to a high of 0.59 in March 2021, one year into it. The ratio fell to 0.53 by November 2022, as consumers increased their spending on services (Fig. 1). The ratio has basically moved sideways since then, suggesting that spending on goods has stopped losing wallet share and may again find favor. (Note: the numerator and denominator of the ratio are adjusted for inflation.)
Let’s take a look at an optimistic holiday spending survey by Deloitte, slowing sales declines at Logitech International and Taiwan Semiconductor, along with some stats on retail sales and transportation:
(1) Could it be a jolly holiday? Many retail analysts are calling for muted spending that sends holiday sales up 3%-4% y/y, which isn’t much after taking inflation into consideration. However, the 2023 Deloitte Holiday Survey caught our eye, as its 4,318 respondents plan to increase spending by 14% y/y on average to $1,652—shelling out 9% more than last year on gifts, 10% more on experiences & entertainment, and a whopping 25% more on “non-gift purchases,” including clothing, home furnishings, and holiday decorations.
Admittedly, the survey was taken from August 30 to September 8, when the 10-year Treasury yield was closer to 4.25% than 5.00% and before war in the Middle East broke out. But if the respondents’ expectations translate into actual spending, 2023 will mark the first year that holiday spending surpasses 2019’s spending of $2,496.
(2) Spending more on mice. The work-from-home trend was one of the biggest to come out of the Covid pandemic. Buying of computer peripherals and gaming equipment from Logitech and others surged before it crashed. But Logitech’s fiscal Q2 (ended September 30) earnings report has us thinking that the bust may be close to running its course.
While Logitech’s sales last quarter fell y/y, they rose q/q for the second quarter in a row and beat Wall Street’s consensus estimate. Here are Logitech’s fiscal Q2 sales over the past four years: fiscal Q2-2024 ($1.06 billion), fiscal Q2-2023 ($1.15 billion) fiscal Q2-2022 ($1.31 billion), and fiscal Q2-2021 ($1.26 billion). Since troughing at $960 million in fiscal Q4-2023 (ended March 31), sales now have been up for two quarters in a row. CFO Chuck Boynton said on the company’s conference call that the y/y rate of decline has improved and is expected to continue doing so in the back half of the year.
The Logitech sales rollercoaster was accompanied by an inventory bubble. Inventory levels have fallen every quarter since peaking in fiscal Q4-2022 at $933 million. The level sank to $533 million in fiscal Q2-2024 but remained north of fiscal Q2-2021’s $395 million.
Logitech shares jumped 12.9% on Tuesday after the company increased its full fiscal year (ending March 31) sales forecast to a range of $4.0 billion to $4.2 billion from the previous $3.8 billion to $4.0 billion. Likewise, management’s adjusted operating income projection for fiscal 2024 was raised to $525 million to $575 million, up from $400 million to $500 million, provided during the fiscal Q1 (ended June 30) earnings report.
(3) More optimism from TSMC. Taiwan Semiconductor Manufacturing Co. (TSMC) recently reported that Q3 sales declined 10.8% y/y, dragged down by the industry’s buildup of chip inventories as sales of cell phones and computers slowed after the pandemic ended. But the company’s revenue forecast for Q4, while still down roughly 4% y/y, is above analysts’ estimates.
“The chipmaker says it has begun to see signs of stabilization in demand for smartphones and personal computers—although C.C. Wei, TSMC’s CEO, says it’s too early to call it a sharp rebound,” an October 19 WSJ article reported. The use of artificial intelligence (AI) is also expected to boost demand for chips.
The company’s shares have risen 23.0% ytd through Tuesday’s close compared with the S&P 500’s 10.6% ytd advance.
(4) Running its course. Sometimes, time does heal all wounds. In this case, the more time that goes by, the more likely it is that consumers will return to buying goods. Real retail sales & food services, which surged 14.5% from December 2019 through April 2021, flatlined over the ensuing three years (Fig. 2).
The flattening of growth in real retail sales has had a huge impact on companies shipping goods. The number of shipping containers entering the West Coast ports fell 24.4% from its peak in August 2021 through last month (Fig. 3). Notably, for the first time since the imports’ downturn began, the number of containers increased ever so slightly, by 115,000 TEUs (twenty-foot equivalent unit) compared to the August level.
The shipping downturn is also apparent in producer prices for truck transportation of freight, which rose 24.9% y/y in May 2022 and has fallen for most of 2023. Most recently, prices fell by 10.4% in September, but that was a very slight improvement over the level in July, when prices fell 12.8% (Fig. 4).
China: More Baby Steps. Faced with below-target economic growth, China took its latest small step to improve the country’s lot by announcing funding for new infrastructure projects. The move isn’t expected to extricate the country from the weight of excessive debt owed by local municipalities or property developers. Nor will it divert attention from the country’s harassment of its private sector. Arresting executives does little to encourage investment. Unless China restructures its debt or starts dropping money out of helicopters, the country’s economy may continue to limp along.
Here’s a look at some of the initiatives that have made headlines recently:
(1) New projects lined up. Earlier this week, China announced a plan to raise 1 trillion yuan ($137 billion) in sovereign debt to fund infrastructure projects in the wake of severe flooding and other natural disasters, an October 24 WSJ article reported. The country also raised its budget deficit target, the first time it has done so outside of a regular legislative session in more than a decade.
There is already criticism that the government’s actions still fall short. “The 1 trillion yuan of sovereign bonds make up less than 1% of China’s gross domestic product. By comparison, the stimulus China launched in the 2008 global financial crisis accounted for more than 12% of its GDP at the time,” the WSJ article stated. Some are calling for the country to give funds directly to citizens to boost consumer spending.
(2) Knocking on the central bank’s door. On Tuesday, China’s President Xi Jinping visited the People’s Bank of China for the first time since he became president a decade ago, an October 24 Bloomberg article reported. He was accompanied by Vice Premier He Lifeng and other government officials, who also visited the Administration of Foreign Exchange. Vice Premier He also stopped by the nation’s sovereign wealth fund, China Investment Corp. (CIC).
What was discussed at the meetings is unknown. The visits came one day after Central Huijin Investment Limited, a unit of the sovereign wealth fund CIC, bought an “undisclosed amount of exchange-traded funds and vowed to keep increasing its holdings in the latest attempt to boost the country’s slumping stock market. Earlier this month, Huijin bought shares in China’s largest state banks,” Bloomberg reported.
(3) Real estate woes continue. The clock is ticking as Evergrande revises its proposed restructuring plan. It will have to move quickly because the company has an October 30 court hearing in Hong Kong regarding a petition to wind up the firm, which could include liquidating its assets, an October 20 Bloomberg article reported. Evergrande has about $327 billion of liabilities, and its founder Hui Ka Yan is “under police control,” as he’s suspected of committing crimes.
Meanwhile, Country Garden Holdings appears headed toward its own restructuring after officially defaulting on a $15.4 million dollar-denominated bond. The price of its dollar-denominated bonds has fallen about 75% this year to only 5 cents on the dollar, an October 25 Bloomberg article reported.
Country Garden is even larger than Evergrande. “The company was the country’s largest builder by contracted sales for several years before plunging to seventh so far in 2023,” the Bloomberg article reported. The company’s sales in September fell 81% y/y, as buyers feared the company wouldn’t be able to complete the construction of its buildings.
(4) China behaving badly. “60 Minutes” had an eye opening segment last weekend about China featuring the US FBI Director Christopher Wray and the intelligence directors of Canada, United Kingdom, Australia, and New Zealand. Together known as “The Five Eyes,” these officials were speaking together for the first time ever to alert executives and officials that “the technology secrets that are about to change the world, in artificial intelligence, biology and computing are falling into the wrong hands—stolen—in a global espionage campaign by China.”
Wray said: “We have seen efforts by the Chinese government, directly or indirectly, trying to steal intellectual property, trade secrets, personal data—all across the country. We’re talking everything from Fortune 100 companies, all to smaller startups. We’re talking about agriculture, biotech, health care, robotics, aviation, academic research. We probably have somewhere in the order of 2,000 active investigations that are just related to the Chinese government’s effort to steal information.”
Australia’s Director-General of Security Mike Burgess said the spying goes well beyond the norm. “This scale of theft is unprecedented in human history. And that’s why we’re calling it out.”
China has been acting with impunity in many areas. In the private sector, it was reported last weekend that Chinese tax authorities were probing Foxconn’s operations in China just as the company’s founder Terry Gou was running for president of Taiwan. Militarily, China has been patrolling the South China Sea as if it owns the neighborhood. A Chinese ship collided with two Filipino boats off contested shoal on Sunday. And of course, recent meetings and trade between Xi and Russian President Vladimir Putin leave no mystery as to whose side Xi is on.
Disruptive Technologies: Humanoid Robots Join the Workforce. Amazon announced last week plans to test Digit, a humanoid robot by Agility Robotics. The internet retailer is famous for the massive amount of technology it uses to pick and move products in its warehouses. But the testing of Digit grabbed headlines because the robot moves on two “legs” and looks a lot like a human wrapped in tinfoil.
Perhaps the most famous designer of these human wannabes is Elon Musk, who is building Optimus. The robot uses neural networks and AI to learn by watching millions of examples of what humans have done and applies what it learns to situations it encounters, we noted in the September 28 Morning Briefing.
But Digit and Optimus aren’t alone. Scientists at startups are also working on EVE, Figure, and Phoenix. Here’s a look:
(1) Introducing Digit. Agility’s Digit can pick up and transport the bins used to bring products from shelves to human packers in warehouses like Amazon’s. It can also return empty bins to areas where they can be refilled. Up next, Digit will learn to unload trailers, and somewhere down the road, it will learn to make home deliveries, a company website explains. Digit runs for 16 hours, longer than most of its humanoid competitors.
A new factory the company is building in Oregon will be able to produce more than 10,000 humanoid robots a year. Digit will be working in the factory, which the company calls “The RoboFab,” a company press release stated last month. Spun out of Oregon State University’s Dynamic Robotics Laboratory in 2015, Agility was one of five companies that received a grant from Amazon’s $1 billion Industrial Innovation fund last April.
(2) Meet EVE. Norway-based 1X Technologies has created EVE, a humanoid robot that rolls around on wheels, wears a white and black cloth “uniform,” and has a face with two large cartoonish eyes that makes it seem friendlier than its fellow humanoids. EVE has an AI “brain” that allows it to observe tasks and then repeat them. It’s been designed for use in factories and warehouses and to patrol buildings for safety or to assist humans, according to the company’s website.
A human can receive feeds of what EVE “sees” and take over control of the robot from a distance. 1X is working with the security firm Everon, which was facing problems with turnover and high costs for human guards. Everon now uses EVE for itself as well as its clients and has invested in 1X. Coming next: NEO, an android that has human-like “legs” and “hands.”
(3) Hello, Figure. Figure, made by a company of the same name, looks like a robot: metallic, legs, hands, and a screen with no friendly googly eyes on its face. Its management’s goal is to build general-purpose humanoid robots that will help alleviate labor shortages, take over unsafe jobs, and boost productivity. Figure CEO Brett Adcock lays out the future in the company’s Master Plan:
“As automation continues to integrate with human life at scale, we can predict that the labor-based economy as we know it will transform. Robots that can think, learn, reason, and interact with their environments will eventually be capable of performing tasks better than humans. … [T]he cost of labor will decrease until it becomes equivalent to the price of renting a robot, facilitating a long-term, holistic reduction in costs. Over time, humans could leave the loop altogether as robots become capable of building other robots—driving prices down even more. This will change our productivity in exciting ways. Manual labor could become optional and higher production could bring an abundance of affordable goods and services, creating the potential for more wealth for everyone.”
The company plans to address areas with labor shortages first—e.g., manufacturing, shipping and logistics, warehousing, and retail—and promises not to use humanoids in military operations.
(4) Phoenix gets a star. Phoenix, a humanoid robot created by Sanctuary AI, was voted one of the best inventions of 2023 by Time magazine. The Canadian company also uses AI to make its robots smarter and able to tackle a wide range of tasks. A YouTube video shows Phoenix doing 60 different tasks, including cutting a cucumber, putting a lid on a paper cup, scanning bar codes, picking fruit, and decorating a Christmas tree.
Prior to co-founding Sanctuary, CEO Gordie Rose founded D-Wave, a quantum computing company, and was CEO of Kindred, a robotics company, founded by Sanctuary co-founder and CTO Suzanne Gildert. Kindred was acquired by Ocado in 2020.
Earnings Here & There
October 25 (Wednesday)
Check out the accompanying pdf and chart collection.
Executive Summary: The global economy is still growing despite geopolitical and monetary policy headwinds, though the pace of growth is slow, which October’s global PMI data confirm. … Looking at stock market data globally, we find strong forward revenues, earnings, and profit margin data for the All Country World MSCI, mostly attributable to the US MSCI; the data for Emerging Markets MSCI aren’t as strong. … In the US, record-high weekly forward revenues and forward earnings suggest the same for Q3’s results. … Also: Joe reports that analysts’ estimate revisions reflect equal numbers of rising and falling estimates.
Global Economy I: October PMIs Weak. In yesterday’s Morning Briefing, we concluded that the latest batch of global economic indicators shows that the global economy is still growing but limping rather than running forward. Today’s batch of flash purchasing managers indexes (PMIs) compiled by S&P Global for October confirms that assessment (Fig. 1).
In the US, the M-PMI (for manufacturing industries) is 50.0 and the NM-PMI (nonmanufacturing) is 50.9. Those are lackluster readings. The latest M-PMI reading is in line with similar readings since the start of this year, while the latest NM-PMI reading is lower than those during the summer months.
The Eurozone’s flash M-PMI fell to 43.0 during October from a 2023 high of 48.8 during January. The region’s manufacturing sector remains depressed. The NM-PMI for the Eurozone was above 50.0 this year from January through July. It’s been down since then and fell to 47.8 this month.
Japan’s M-PMI has been mostly below 50.0 since November 2022 (Fig. 2). That weakness probably reflects slowing exports to China’s economy, which was depressed by lockdowns late last year and a lackluster recovery this year. During September, China’s M-PMI and NM-PMI were 50.2 and 51.7 (Fig. 3).
Global Economy II: MSCI Forward Metrics Weak. Joe and I monitor the forward metrics of the various global MSCI stock market indexes to keep track of the global economy—“forward” meaning the time-weighted average of analysts’ consensus expectations for earnings, revenues, and by extrapolation profit margins for the current year and following one.
Here is what we are seeing for the All Country World (ACW) MSCI, with and without the US, all in local currency:
(1) Revenues. The forward revenues of the ACW MSCI rose to a new record high during the October 20 week (Fig. 4). It has been doing so since September 23, 2022. Of course, that’s partly because the global economy has been growing over this period and partly because higher inflation around the world has also been boosting revenues.
Interestingly, forward revenues growth has been essentially flat over the past year for the Developed World ex-US MSCI (Fig. 5). The same can be said about the forward revenues of the Emerging Markets MSCI. In other words, all the upward momentum in the forward revenues of the ACW MSCI has been attributable to the United States!
(2) Earnings. The forward earnings of the ACW MSCI declined during most of last year (Fig. 6). It has been recovering since the start of the year, hitting new record highs in recent weeks. The same can be said about the forward earnings of the US MSCI (Fig. 7). The same metric for the Developed World ex-US has been flat at a record high for the past year, while the one for Emerging Markets fell last year and stopped doing so this year.
(3) Profit margins. The forward profit margin of the ACW MSCI fell from a record high of 11.0% during the week of May 12, 2022 to 10.3% during the week of March 30 (Fig. 8). It rose to 10.6% during the October 19 week. The same story can be told about the US MSCI forward profit margin, which was 12.4% during the October 19 week (Fig. 9). The Developed World ex-US forward profit margin hasn’t recovered from last year’s dip, remaining stalled around 10.0%. The Emerging Markets MSCI forward profit margin peaked at 8.2% during 2021, fell to a low of 6.8% at the start of this year, and managed to recover to just 7.1% recently.
(4) Bottom line. The global economy is growing, albeit at a slow pace. It is doing so notwithstanding the tightening of monetary policies around the world since early last year and despite the geopolitical tensions and conflicts that are challenging globalization.
Earnings I: Still Moving Forward. Here in the US, S&P 500 forward revenues are also up to a record high through the week of October 19 (Fig. 10). This suggests that S&P 500 revenues per share rose to a new record high during Q3. The same can be said about S&P forward earnings and Q3’s earnings per share. Here’s more on forward earnings:
(1) Quarterly consensus estimates. The Q3 earnings season has started. So far, there has been no upward “earnings hook” for the quarter through the October 19 week (Fig. 11). We are still expecting one. However, industry analysts did lower their Q4 estimate this week. At the same time, they slightly raised their Q1-Q3 estimates for 2024 (Fig. 12).
(2) Annual consensus estimates. S&P 500 forward earnings per share rose to a new record high of $241.69 during the October 19 week (Fig. 13). The consensus annual earnings-per-share estimates for 2023, 2024, and 2025 were lowered a touch to $219.74, $246.91, and $276.80. We are still forecasting $225, $250, and $270 (Fig. 14).
Earnings II: Revisions Activity Weakening as Analysts Await Q3 Results. Early this week, Refinitiv released its October snapshot of the monthly consensus earnings estimate revision activity over the past month. While the company provides raw data for all its polled measures, we focus primarily on the revenues and earnings forecasts, captured in our Stock Market Indicators: Net Revenue & Earnings Revisions By Sectors report. There, the analysts’ estimate revisions activity is indexed by the number of upward revisions in forward earnings less the number of downward ones, expressed as a percentage of total forward earnings estimates. We look at this activity over the past three months because that timespan encompasses an entire quarterly reporting cycle. Since analysts’ tendency to revise their estimates differs at different points in the cycle, three-month data are less volatile—and misleading—than a weekly or monthly series would be.
October’s reading comes at the beginning of the Q3 earnings reporting cycle, when analysts’ revisions lighten as they wait and see how much their companies beat their quarterly forecasts before revising their annual estimates. They’ve mostly been raising their revenues forecasts during 2023 following the Q4-2022 season and the earnings forecasts after Q2-2023. While the y/y quarterly revenue growth rates have remained positive this year and earnings growth is expected to turn positive in Q3, analysts now appear to be less bullish about earnings and a tad bearish on revenues, based on their latest NERI (net earnings revisions index) and NRRI (net revenues revisions index) readings.
Joe highlights what’s most notable about the October crop of revisions data below:
(1) S&P 500 NERI still on positive footing, but barely. The S&P 500’s NERI index, which measures the revisions activity for earnings forecasts, was positive for a fifth month but weakened to a five-month low of 0.6%. A zero reading indicates that an equal number of estimates were raised as were lowered over the past three months. October’s release is up from a 30-month low of -15.6% in December and is well above the average reading of -2.2% seen since March 1985 when the data were first calculated.
(2) Less than half of sectors now have positive NERI. Five S&P 500 sectors had positive NERI in October, unchanged from the September count and down from a 13-month high of seven sectors during July. Three sectors improved m/m, the fewest since last December.
That’s a far cry from all 11 improving m/m, as happened in May; but that month was unusual, as analysts then were scrambling to raise forecasts after Q1 earnings reports revealed broad-based strength. In fact, Q1 marked the broadest earnings improvement among the sectors in two and a half years, since Q3-2020.
To highlight standouts among sectors in October’s NERI readings, Energy’s NERI was at a 13-month high, turning positive for the first time in 11 months, and Financials’ was at a 16-month high. However, Financials’ negative NERI streak has now stretched to 16 months, the longest of all sectors’ and just ahead of Materials’ 15-month negative streak.
Here’s how NERI ranked for the 11 sectors in October: Energy (12.3%, 13-month high), Consumer Discretionary (5.2), Information Technology (4.3), Communication Services (4.0), S&P 500 (0.6, five-month low), Industrials (0.1, six-month low), Health Care (-2.4), Financials (-2.5, 16-month high), Utilities (-3.5, five-month low), Consumer Staples (-4.4, 10-month low), Real Estate (-5.8, six-month low), and Materials (-6.0).
(3) S&P 500 NRRI index for revenues is negative now. The NRRI index, which measures the analysts’ revisions activity in their revenue forecasts, dropped for the S&P 500 to -0.1% in October from 1.2% in September and is down from a 12-month high of 5.0% in July. October’s negative reading is its first in nine months and is barely above the average -0.2% reading since it was first compiled in March 2004.
(4) NRRI index still positive for seven sectors. NRRI’s m/m performance was generally weaker than that of the NERI index by all measures but one: Seven sectors had positive NRRI readings versus five with positive NERI.
Looking at m/m NRRI improvement, only two sectors cleared that bar: Energy and Materials. Consumer Staples’ and Utilities’ NRRIs dropped to their lowest readings in 40 months and 20 months, respectively. Energy’s was at an 11-month high.
Here’s how the sectors’ NRRIs ranked in October: Health Care (6.3%, nine-month low), Industrials (5.2, nine-month low), Energy (3.8, 11-month high), Utilities (1.4, 20-month low), Real Estate (1.3, 6-month low), Consumer Discretionary (1.2, nine-month low), Financials (0.6), S&P 500 (-0.1, nine-month low), Information Technology (-1.8, six-month low), Communication Services (-7.6), Consumer Staples (-9.5, 40-month low), and Materials (-14.6).
(5) Energy’s positive revisions boosting S&P 500’s NRRI and NERI again. Without the Energy sector, the S&P 500’s October NRRI reading for revenues falls to -0.4% from 1.2% in September (Fig. 15). Looking at the NERI reading for earnings, the S&P 500 without Energy was negative in October for the first time in six months, dropping to -0.1% from 2.2% in September (Fig. 16).
Materials and Energy—the only sectors to show m/m improvement in NRRI during October—were also the only ones to hit another mark we monitor: showing m/m improvement in NERI.
There are several possible reasons for the recent weakness in the remaining sectors’ revisions data. The impact of higher interest rates may now be starting to be reflected in estimate revisions. Also, waning inflation may be lowering revenues as well as impacting companies’ pricing power and ultimately their earnings.
A zero reading for NRRI and NERI indicates equal numbers of estimates rising and falling. The fact that October’s readings are so close to that mark—and only edging down m/m rather than collapsing—suggests that analysts collectively are generally satisfied with their forecasts for now. That takeaway has all the earmarks of a nice, gentle soft-landing.
Global Economy Turning Up?
October 24 (Tuesday)
Check out the accompanying pdf and chart collection.
Executive Summary: The global economic outlook remains positive, though lackluster. The IMF forecasts 2.9% real GDP growth for the world economy next year versus a projected 3.0% this year and 3.5% in 2022, and the global economic indicators we track likewise suggest slow growth. … On the downside, global GDP growth has been less buoyed by US consumers since their mid-2021 pivot from splurging on goods to bingeing on services. Also weighing on global economic activity have been the slow growth of China’s economy, hamstrung by its property sector, and Europe’s economy, beset with poor sentiment, high inflation, and depressed lending and retail sales.
Weekly Webcast. If you missed Monday’s live webcast, you can view a replay here.
Global Economy I: Green Shoots Vs Shooting Wars. The global economy continues to face some serious challenges. Central banks around the world have tightened their monetary policies dramatically since early last year in response to soaring inflation. Inflation has moderated around the world, but it remains high, especially relative to the 2.0% y/y inflation targets of the major central banks. As a result, they remain committed to either raising interest rates further or keeping their restrictive level of interest rates higher for longer. Consequently, bond yields have been rising around the world.
The wars in Ukraine and now the Middle East have unsettled the geopolitical order. So far, the hostilities have been contained geographically. However, they could easily broaden. The allies of Ukraine in the West continue to provide enormous financial support and lots of military aid to that country. The conflict between Ukraine and Russia has turned into a proxy war between Russia and the West. Similarly, the war in the Middle East is a proxy war between Israel and Iran. It conceivably could turn into a direct confrontation between the two adversaries and cause the United States to join the fray on Israel’s side.
China’s economy remains challenged by the bursting of the country’s property bubble. China’s demographic profile is aging rapidly, which is depressing consumer spending and putting pressure on the government to spend more on social benefits. Europe’s economy also is aging rapidly; additionally, Europe continues to struggle with the region’s transition from fossil fuels to renewable energy sources. That transition was complicated by the sanctions placed on imports of Russian oil and gas when Russia attacked Ukraine. Germany’s automakers have been scrambling to compete with foreign manufacturers of electric vehicles.
Soaring interest rates, weak commodity prices, and the strong dollar all have been weighing on many emerging market economies. Many of them are under pressure to choose sides in the global schism between Western democracies and the autocratic axis of China, Iran, North Korea, and Russia.
It’s a messy world order for sure and is getting messier by the day. Yet there have been some green shoots in the global economy recently. Real GDP in the US probably grew by around 5.0% (saar) during Q3, led by surprisingly resilient and robust consumer spending. China’s real GDP rose 4.9% y/y during Q3. That was better than expected, though it was slower than Q2’s pace of 6.3%.
Global Economy II: The Big Picture. Two weeks ago, in its latest World Economic Outlook, the International Monetary Fund (IMF) left its forecast for global real GDP growth in 2023 unchanged at 3.0% but shaved its 2024 forecast to 2.9% from the 3.0% expected in July. World output grew 3.5% in 2022.
In commentary about the decision, IMF Chief Economist Pierre-Olivier Gourinchas said that the global economy has continued to recover from the effects of Covid-19, Russia’s invasion of Ukraine, and last year’s energy crisis, but that diverging growth trends suggest “mediocre” medium-term prospects. The forecasts point generally to a soft landing, he said, but the IMF remains concerned about risks related to China’s property crisis, volatile commodity prices, geopolitical fragmentation, and a resurgence in inflation. Gourinchas told Reuters that it was too early to know how the war in the Middle East would affect the global economy: “Depending how the situation might unfold, there are many very different scenarios that we have not even yet started to explore, so we can’t make any assessment at this point yet.” But he did say that IMF research has shown that a 10% increase in oil prices would dampen global output by about 0.2% in the following year and boost global inflation by about 0.4%.
Debbie and I track several indicators of global economic activity. On balance, they show that global economic growth remains relatively slow. Let’s review them:
(1) Global production & exports. Global industrial production rose just 0.5% y/y through July. Over the same period, the volume of global exports fell 2.5% (Fig. 1 and Fig. 2). Both have been relatively flat since the start of 2022. That reflects the weakness in China’s economy and the pivoting of US consumers from bingeing on goods to services instead. In a sense, there has been a rolling recession in the global production and distribution of goods.
(2) Commodity prices. We calculate a crude Global Growth Barometer (GGB). It is the average of the nearby price of a barrel of Brent crude oil and the CRB raw industrials index (multiplied by 2 and divided by 10) (Fig. 3 and Fig. 4).
Our GGB fell sharply from the summer of 2022 through the summer of 2023. It then rebounded a bit through September but has stalled since then. The price of oil tends to have more geopolitical noise than does the CRB index, which has been falling since it peaked last year on April 4.
The CRB index is highly correlated with the price of copper (which is one of the components of the index) and the Emerging Markets MSCI stock price index (in dollars) (Fig. 5 and Fig. 6). They’ve all been weak recently, notwithstanding better-than-expected growth rates in the real GDPs of China and the United States. That’s because the recession in China’s property sector has depressed global demand for commodities. The rolling recession in the US goods sector has been doing the same.
(3) Global PMIs. The global composite PMI and its components covering advanced and emerging economies all peaked earlier this year (Fig. 7). The composite did so during May at 54.4 and fell to 50.5 in September. Emerging economies have slightly outperformed advanced ones.
In the manufacturing sector, the composite and its advanced economies component have been under 50.0 since last September, while the emerging economies have been mostly above 50.0 since the start of this year.
In the non-manufacturing sector, the PMIs are down from earlier this year and just north of 50.0.
Global Economy III: The Downside of US Economic Strength. As we mentioned above and discussed previously, consumers went on a post-lockdowns spending spree on goods and then pivoted around mid-2021 to do the same on services. US retailers reordered to restock their depleted inventories, which jammed the ports and trucking industry. By the time that the goods were delivered in late 2021, retailers were stuck with them and had to discount their prices to reduce their bloated inventories.
That explains the flattening of global industrial production, the volume of global exports, and global M-PMIs. Apparently, spending on services by US consumers doesn’t have as much of a multiplier effect on the global economy as does their spending on goods. Of course, my wife and I did boost the economies of Croatia and the Scandinavian countries when we vacationed for a week in June and in September. So did lots of the other tourists who swarmed all over Europe this past summer.
Global Economy IV: China’s Bubble Trouble. China’s real GDP expanded 2.9% y/y through Q4-2022—marking one of its slowest growth rates in several decades (Fig. 8). That missed the government’s initial goal of around 5.5%. The Chinese economy was depressed by the country’s stringent zero-Covid policy that restricted people’s movements and disrupted supply chains. Growth picked up during the first three quarters of this year following the two-month Covid-19 lockdown at the end of last year.
China’s economic recovery has been weighed down by a slump in its real estate sector, with major property developers China Evergrande Group and Country Garden Holdings Co. saddled with heavy debts. The real estate market accounts for some 30% of China’s GDP. Evergrande filed for bankruptcy in a New York court in August. During the first nine months of 2023, investment in real estate development dropped 9.1% y/y. Industrial production grew 4.0%, while retail sales of consumer goods rose 6.8% and fixed-asset investment increased 3.1%.
August marked the second time this year that China’s central bank cut its benchmark lending rate to shore up the economy. Unlike most other central banks, the People’s Bank of China is much more concerned about deflation than inflation. Over the past 12 months through September, the country’s CPI was unchanged, while its PPI was down 2.5% (Fig. 9).
Global Economy V: Europe’s Challenges. Real GDP rose just 0.5% y/y through Q2 in the Eurozone (Fig. 10). The outlook remains lackluster, since the region’s Economic Sentiment Indicator—which tends to be highly correlated with real GDP growth—fell in September to 93.3, the lowest reading since November 2020.
The Eurozone’s headline and core CPI inflation rates remained elevated at 4.3% and 4.5% through September (Fig. 11). The European Central Bank (ECB) has responded to inflation by raising the ECB’s official deposit rate from -0.50% during the first half of 2022 to 4.00% currently.
Eurozone private-sector loans peaked at a record €13.1 trillion during September 2022, falling by €84 billion through August of this year (Fig. 12). The volume of retail sales (excluding automobiles and motorcycles) fell 1.3% y/y during August to the lowest since April 2021 (Fig. 13).
‘Dangerous Times’
October 23 (Monday)
Check out the accompanying pdf and chart collection.
Executive Summary: The Middle East crisis seems to be escalating into a regional war with US involvement, existential stakes, and global effects. The S&P 500 fell to its 200-day moving average on Friday in response to the geopolitical risks. We expect it to breach that level this week even if the bond yield declines. The escalation of hostilities we expect prompts us to raise our odds of a US recession before year-end 2024 again, now to 35% from 30%. A year-end rally is less likely now, but geopolitical crises do tend to present long-term buying opportunities in stocks. … Also: We update the bond market’s supply/demand situation, discuss the consumer-spending-employment spiral, and review the movie “Past Lives” (+).
YRI Weekly Webcast. Join Dr. Ed’s live webcast with Q&A on Mondays at 11 a.m. EST. You will receive an email with the link one hour before showtime. Replays of the weekly webcasts are available here.
Geopolitics: Middle East’s Existential Crisis. Jamie Dimon is probably right. On October 13, the CEO of JPMorgan Chase sounded the alarm on the global effects of wars in the Middle East and Ukraine. “This may be the most dangerous time the world has seen in decades,” he said in a statement accompanying the bank’s quarterly earnings. He warned of “far-reaching impacts on energy and food markets, global trade and geopolitical relationships.”
The war in the Middle East between Israel and Hamas might have escalated into a regional war on Thursday. That’s when a US warship heading south in the Suez Canal over a period of nine hours intercepted and destroyed four cruise missiles and 15 drones heading toward Israel from Yemen. The missiles were fired by Iranian-backed Houthi forces in Yemen and were launched “potentially towards targets in Israel,” according to the Pentagon’s press secretary. In response, the US fired sea-launched cruise missiles at Houthi radar facilities in Yemen, according to a CNN report.
This development contributed to the selloff in the S&P 500 on Friday. So did the increase in the 10-year Treasury bond yield to 4.997% Thursday evening. But the yield was back down to 4.928% at Friday’s close. The decline in the yield undoubtedly reflected profit taking by short-sellers and a mini-flight to safety in reaction to the latest unsettling developments in the Middle East.
On October 7, when the war started, I wrote: “Geopolitical crises in the Middle East have usually caused oil prices to rise and stock prices to fall. More often than not, they’ve also tended to be buying opportunities in the stock market. Much will depend on whether the crisis turns out to be another short-term flare-up or something much bigger like a war between Israel and Iran.”
On October 10, Debbie and I raised our subjective odds of a broad-based US recession from 25% to 30% because of the war: “This one isn’t likely to lead to a quick ceasefire between Israel and Hamas, as occurred in the past, because it is in fact a war between Israel and Iran. For Israel, it is existential. This time, Israel’s goal is to wipe out Hamas, which is Iran’s surrogate in Gaza. The war is also existential for Iran’s mullahs, who need it to distract their domestic population from discontent over their authoritarian regime by moving forward on their machinations to wipe out Israel.” And, of course, the war is now existential for Hamas since Israel has vowed to destroy the terrorist organization.
Under the circumstances, the odds of an escalation of the hostilities are increasing, while those of a ceasefire anytime soon are falling. As a result, we’re raising our odds of a recession again, to 35%. A regional war has become more likely now that the US has gotten directly involved by shooting down missiles launched by Iran’s surrogates in the region and destroying their military assets on the ground.
There could still be a year-end stock market rally, but there is likely to be more downside over the next few weeks while the regional combatants and also the US Navy are targeting each other. The S&P 500 index fell back to its 200-day moving average on Friday and looks set to breach it if the news out of the Middle East continues to worsen, as we now expect, even if the bond yield declines on the same news.
The question is whether this war will escalate to the point where American and Israeli policymakers conclude that now is the time to destroy Iran’s nuclear facilities. We are sure the question will be raised. We don’t know what the answer will be or even whether such an escalation is militarily feasible.
We are keeping an eye on Taiwan too, as is China. A month ago, a record number of Chinese fighter planes—103 of them—flew around Taiwan in just one day. On Wednesday, Taiwan reported that 10 Chinese military aircraft and four navy ships buzzed close to the island nation. China’s government might view this as an opportune time to invade Taiwan now that the US is stretched militarily by supporting both Ukraine and Israel.
As Jamie Dimon said, “This may be the most dangerous time the world has seen in decades.” There isn’t likely to be much upside for the stock market until the geopolitical risks turn less dangerous, particularly in the Middle East. We certainly aren’t sure how long that will take, but we think these risks will linger for a few weeks at least.
As noted above, geopolitical crises have often turned out to be buying opportunities. At first, the stock market didn’t respond adversely to the war in the Middle East. It may be starting to do so now. If so, then this too should result in buying opportunities, particularly in Energy, Financials, and Information Technology. Of course, defense stocks should also benefit from these dangerous times.
Strategy: Market Call. Our cautiousness on the outlook for the S&P 500 over the near term is in sync with the views of our friend Joe Feshbach. Here are his latest thoughts on the stock market from a trading perspective:
“I remain cautious on the stock market, as the internal dynamics—especially as measured by breadth statistics—remain awful. I have been highlighting the Nasdaq in particular, where the cumulative A/D line has been constantly making new lows. Also on the surprisingly disappointing side is how the put/call ratio has responded to this decline. One would have thought that with horrible breadth accompanied by terrible news, put buying would skyrocket. It has not. Yes, the numbers have picked up, but we are nowhere near levels that would indicate fear and a possible low. I’m very curious to see how the ratio will react if the S&P 500 breaks its prior intra-day low of 4216 this week.” Thanks Joe!
Bonds: Supply & Demand Update. In his interview Thursday with Bloomberg’s David Westin at the Economic Club of New York, Fed Chair Jerome Powell was asked about the bearish impact of the increasing supply of government debt on the bond market given that the Fed is no longer buying Treasury securities and that foreigners reportedly are reducing their purchases as well. Powell responded that buying by foreigners has “actually been pretty robust” this year.
That statement provides an opportunity for Melissa and me to update our analysis of supply and demand in the Treasury market. Consider the following:
(1) Bears versus bulls. In our August 14 Morning Briefing, titled “Disinversion,” we wrote: “[T]he supply of and the demand for bonds isn’t usually as important to the determination of the bond yield as are actual and expected inflation and the expectations of how the Fed will respond to them.” The 10-year Treasury bond yield was 4.19% at the time, but we were increasingly concerned that it was going higher because of the imbalance between supply and demand.
Favoring the bears in the bond market, we observed, “is the rapidly widening federal deficit and evidence that demand may not match the supply of Treasury securities unless their yields continue to rise. Favoring the bulls, in our opinion, is that since last summer inflation has been on a moderating trend that should persist through 2025 without any further increases in the federal funds rate.”
Inflation remains on a moderating trend. However, the bond yield is now around 5.00%, as supply concerns have mounted along with the federal debt. Supply became a major issue when the Treasury announced significant increases in its auctions on July 31. From July through September, the Treasury needed to borrow $1.01 trillion, $274 billion more than was announced in May. The day after that announcement, on August 1, Fitch Ratings downgraded the government’s credit rating from AAA to AA+. That underscored the significance of the government’s profligate borrowing and accentuated investors’ supply concerns.
(2) Is 5% high enough? The question now is whether the 10-year Treasury bond yield, at 4.93% on Friday, is high enough to attract sufficient bond buyers to equilibrate the market’s supply and demand. We think so. The 10-year yield is back to the highest reading since June 2007 (Fig. 1). We’ve previously characterized the bond yield range of 4.50%-5.00% as a return to the old normal range before the Great Financial Crisis from 2003 through 2007. The big difference between now and then is the size of the federal deficits, which is partly attributable to the rapid rise in the net interest outlays of the federal government.
(3) Bond Vigilantes more powerful than ever. The risk in the bond market is that the difference in the supply factor could push yields higher than 5.00%. That’s another way of saying that the risk is that the Bond Vigilantes will take over control of the market, pushing yields so high that they cause a credit crunch and a recession. That may be the only way to force Washington to lower the unsustainable long-term path of the federal deficit. After all, Washington has provided the Bond Vigilantes with more power than ever by increasing the government’s debt so rapidly in recent years (Fig. 2). Total public debt outstanding excluding intragovernmental holdings has quadrupled since Q4-2008 to $26.3 trillion during September.
It shouldn’t be forgotten that elevated bond yields can have the same monetary tightening effect on the economy as elevated federal funds rates, if not a greater tightening effect.
(4) The bond crop never fails. During fiscal year 2023 (ending September), the federal deficit totaled $1.7 trillion. That well exceeds the pre-pandemic record high of $1.1 trillion over the 12 months through February 2020 (Fig. 3). Outlays totaled $6.1 trillion, while receipts totaled $4.4 trillion (Fig. 4).
Exacerbating the federal deficit has been rapidly increasing outlays on net interest (Fig. 5). Over the past 12 months through September, it totaled $659 billion, doubling since May 2021. The average interest rate on the government’s debt is currently about 2.50%. The 2-year Treasury yield is over 5.00% currently. So this outlay will continue to be the fastest growing one in coming months.
(5) Fed and banks are net sellers. On the demand side, the Fed stopped purchasing Treasury securities during June 2022 and has let its holdings decline as they mature. During this period of quantitative tightening (QT), these holdings peaked at a record $5.77 trillion at the start of June 2022 and were down to $4.96 trillion at the start of October this year (Fig. 6). That’s an average decline of $51 billion per month over that 16-month period. If QT continues to reduce the Fed’s holdings of Treasuries at roughly this pace, other buyers will have to refinance the $600 billion decline, over 12 months, in the Fed’s holdings.
Interestingly, the Fed’s holdings of Treasury bonds maturing in over 10 years actually increased slightly over this period by $80 billion (Fig. 7).
The holdings of US Treasury and agency securities held by all US commercial banks peaked at a record $4.71 trillion during the week of March 1, 2022 and fell $610 billion to $4.10 trillion during the October 11 week (Fig. 8). That period coincides with the Fed’s QT. That’s because QT has been reducing bank’s deposits, forcing them to raise funds by letting their securities mature (Fig. 9).
(6) Foreigners are still buying. Fed Chair Powell is right about foreigners. They are still active buyers of US bonds. According to Treasury International Capital (TIC) data, over the 12 months through August, their net purchases of US bonds was $582 billion, including $596 billion purchased by private foreigners and $14.0 billion sold by official foreign accounts (Fig. 10). Over the past three months through August, foreign investors purchased $75.0 billion in US Treasury notes and bonds, with private foreigners purchasing $79.3 billion and private official accounts selling $4.3 billion.
(7) Domestic individual and institutional investors are the known unknowns. Over the past 12 months, bond mutual funds and ETFs have had net inflows of $194.1 billion. Unfortunately, investors piled into these funds at a record pace, which peaked at $1.0 trillion during 2021 on a 12-month sum basis, when interest rates were at or near record lows. Clearly, individual and institutional investors have amassed huge realized and unrealized losses in the bond market.
The question is whether bond yields upwards of 5.00% now will bring investors back into the bond market. We think so. On the other hand, it might take a while since they can earn as much in money market mutual funds, which are up $1.1 trillion y/y through mid-October and more than $2.0 trillion since just before the start of the pandemic (Fig. 11).
Consumers: The Spending-Employment Spiral. Why is consumer spending so strong, as evidenced by September’s 0.7% m/m increase in retail sales and the upward revisions in August (from 0.6% to 0.8%) and July (0.5% to 0.6%) (Fig. 12)? The answer is that payroll employment is so strong, with a gain of 336,000 during September, following upward revisions in August and July of 119,000 in total as well. Employment gains averaged 266,000 per month over the past three months through September.
Why is employment so strong? Because consumer spending is so strong. This may sound like circular reasoning, but it’s not. As we’ve explained before, retiring Baby Boomers are eating at restaurants more often, traveling more frequently, and seeing health care providers routinely. These are all labor-intensive services that need more workers to satisfy the demand from their customers, especially the Baby Boomers. So for example, consider the following:
(1) Food services retail sales rose to a record $1.1 trillion (saar) during September, exceeding meals at home by 11.3% (Fig. 13). Employment in food services & drinking places has fully recovered from the pandemic, but they still have more than a million job openings including in accommodations services (Fig. 14).
(2) Personal consumption expenditures on health care services rose to a record high of $3.0 trillion (saar) during August (Fig. 15). Payroll employment in health care and social services rose to a record 21.6 million (Fig. 16). During August, there were 1.8 million job openings in these two industries.
Movie. “Past Lives” (+) (link) is a movie with a romantic story but a realistic one. That’s because love doesn’t always conquer all. There are lots of extenuating circumstances in any relationship. This movie follows the relationship of childhood sweethearts in South Korea. They are separated when one of them moves to Canada and then to the US. Nevertheless, they still have feelings for one another when they are young adults. Will they or won’t they reconnect and surmount new obstacles? In other words, this is a realistic romantic suspense movie. That might be a new genre.
Bank Earnings, CO2 & The Oceans
October 19 (Thursday)
Check out the accompanying pdf and chart collection.
Executive Summary: Three big banks have produced Q3 earnings surprises, beating consensus expectations and allaying fears about nonperforming real estate loans, declining deposits, and the pace of consumer spending. Jackie summarizes the key takeaways from the conference calls of JPMorgan, Bank of America, and PNC Financial Services, including what proposed Basel III Endgame regulations might mean for each. … And in our Disruptive Technologies segment: The ocean may hold the key to slowing climate change. Researchers in startups and academia are finding ways to ramp up the ocean’s CO2 absorption capacity.
Financials: So Far, Not Bad. Bank earnings started rolling in over the past week with a wave of relief that so far some of the worst fears have not come to pass. Many earnings reports beat Wall Street analysts’ consensus estimates. Real estate write-offs were lower than expected. Deposits are declining, but slowly enough that the banks can adjust. And the economic outlook at many banks has improved as the consumer has kept on spending.
Some of the biggest complaints in quarterly conference calls came from JPMorgan Chase executives concerned about proposed changes to reserve requirements that could force the bank to raise billions in capital. Investors, on the other hand, didn’t have much to complain about, as the three biggest banks beat Wall Street analysts’ consensus estimates. Here are the actual and forecasted Q3 earnings for Bank of America ($0.90, $0.83), JPMorgan Chase ($4.33, $3.95), and PNC Financial Services Group ($3.60, $3.10).
Let’s take a look at some of the themes in the earnings conference calls held by the managements of Bank of America (BAC), JPMorgan (JPM), and PNC over the past week:
(1) Real estate losses underwhelm. FDIC-insured institutions have been increasing their provision for loan and lease losses relatively sharply in the past nine quarters (Fig. 1). The provision increases have paid off. After all the handwringing, the real estate portfolios of the three banks performed as expected. The losses on loans that went bad were already reflected in reserves. The modest increases in loan loss provisions that did occur were generally attributed to increases in credit card loans outstanding and a return to more normal default rate expectations in those portfolios.
Consumer credit card debt outstanding dipped briefly during the pandemic but began rising again in 2021 (Fig. 2). After initially spiking, credit card delinquency rates fell sharply through mid-2022. Delinquency rates since have risen to more normal levels and remain relatively low historically (Fig. 3).
JPM saw a “trickle” of office real estate charge-offs, but they were already factored into the bank’s allowance for losses. The bank’s Q3 provision for credit losses was $1.4 billion, down slightly y/y and down sharply from $2.9 billion in Q2. The bank’s $1.5 billion of net charge-offs were primarily in credit cards, and the $301 million in net reserve build in credit cards due to loan growth was offset by a reserve release of $250 million in home lending, driven by the increase in home prices. The net reserve build related to commercial real estate was only $37 million and reflected updated pricing variables.
BAC’s commercial loan net charge-offs in Q3 declined from the Q2 level, driven by a reduction in office loan write-downs. Office loans represent 2% of the bank’s total loans, and they are “adequately reserved against the current conditions,” said CFO Alastair Borthwick. In total, the bank’s net charge-offs of $931 million increased by $62 million from Q2 due to credit card losses. Its credit card loss rate of 2.72% last quarter was up slightly from 2.60% in Q2 but still below the pre-pandemic rate of 3.03% in Q4-2019. BAC’s provision for credit losses was $1.2 billion, including a $303 million reserve build that reflects the bank’s expectation that the unemployment rate will rise above 5% in 2024.
PNC’s nonperforming real estate loans jumped 11% q/q to $210 million, but the increase wasn’t more than expected by the bank’s reserves. In the commercial real estate portfolio, total criticized loans remained flat q/q at 23%. Some loans within that category became non-performing loans. “Ultimately, we expect future losses on this portfolio, and we believe we have reserved against those potential losses accordingly. As of September 30, our reserves on the office portfolio were 8.5% of total office loans,” said PNC CFO Rob Reilly.
The bank’s provisions for credit losses actually declined to $129 million in Q3, down from $146 million in Q2 and $241 million in Q3-2022. PNC’s net loan charge-offs of $121 million fell from $194 million in Q2 due to lower commercial real estate net loan charge-offs. The amount was up a smidge from $119 million in Q3-2022.
(2) Deposits shrink, but slowly. Total deposits at commercial banks spiked during the pandemic and since have gradually been falling back to more normal levels (Fig. 4).
At PNC, average deposits decreased by $3.2 billion, or 1%, to $422.5 billion due to a decline in consumer deposits that was somewhat offset by a growth in commercial deposits. Non-interest-bearing deposits were 26% of deposits, down from 27% in Q2 and expected to stabilize in the mid-20% range. The cost of interest-paying deposits has risen to 2.26% in Q3, up from 1.96% in the prior quarter.
“We’re going to have repricings of fixed-rate assets fighting reprices of our liabilities. At some point, that’s going to cross, and banks are going to grow NII at high percentages. I just can’t tell you when that is yet,” said PNC CEO Bill Demchak.
At JPM, average deposits of $2.4 trillion declined 4% y/y and 1% q/q. Total deposits at BAC rose slightly q/q, from $1.875 trillion on June 30 to $1.886 trillion on September 29. Just as importantly, the bank didn’t have to raise rates very high to keep deposits: The rate paid on all deposits was 1.55%, up only 0.31 from last quarter thanks to many low- and no-interest paying consumer checking accounts.
(3) Economic growth slows. JPMorgan’s economists raised their economic growth forecast in Q3 to modest real GDP growth of around 1% for the next few quarters up from the 0.5% decline in GDP in Q4-2023 and Q1-2024 they previously had expected.
Bank of America economists predict a soft landing with a mid-2024 trough. The slower growth is reflected in consumers’ spending, which has slowed to about 4% increase y/y in Q3 and in October, down from 10% y/y spending growth earlier this year and in 2022. The current pace of spending returns consumer activity to the pre-pandemic levels of 2016-19.
The folks at PNC expect a mild recession starting in the first half of 2024, with real GDP contracting by less than 1%. They expect the federal funds rate to remain unchanged at 5.25%-5.50% through mid-2024, when they expect the Fed to start cutting rates. However, CEO Demchak said, “Personally I think the Fed is higher for longer even higher for longer than the market expects.”
(4) Proposed regulations irk JPM. Regulations proposed in July by the Fed, Office of the Comptroller of the Currency, and the FDIC would increase the capital the banks need to hold against their risk-weighted assets. The proposed rules —known as “Basel III Endgame”—would standardize the way firms approach their credit, market, and operational risk exposures, and they’d apply to firms with at least $100 billion in total assets as well as to smaller firms with significant trading activities. If approved, they’d go into effect in 2025.
Of the three banks, JPM appears likely to face the biggest capital shortfalls under the proposed rules. The bank estimates that its risk-weighted assets will increase by 30%, or $500 billion, which increases the firm’s required capital by about 25%, or $50 billion. The bank also would have to increase its capital by $30 billion to meet new requirements regarding capital reserved for operational risk.
The proposed rules require a fourfold increase in the risk-weighted assets held against tax-advantaged investments in the solar and wind industries. It also ups the capital that needs to be held against mortgages and housing loans. If these requirements go through, banks presumably would adjust the pricing on those loans, making them more expensive for borrowers, which would seem counter to the Biden administration’s goals. JPM CFO Jeremy Barnum said that the rule changes might cause the bank to exit certain business lines, like the renewable energy tax credit investment business.
“The current proposal exacerbates existing features to discourage beneficial scale and diversification. If it goes through as written, there will likely be significant impacts on pricing and availability of credit for business and consumers. In addition, the ongoing and persistent increase in the regulatory cost of market-making for banks suggests that the regulators want dramatic changes to the current operation of the US capital markets,” said JPM’s Barnum. Needless to say, JPM will continue to “engage and forcefully advocate during the comment period and beyond.”
While Bank of America’s CEO Brian Moynihan also expressed hope that the proposed rules will be changed, he noted that they’d have limited impact on the bank. The firm’s risk-weighted assets would increase about 20% to $1.95 trillion. BAC would be required to keep $195 billion in capital against those assets, or 10% of the total. The bank has $194 billion of capital currently, and it should be able to raise the minimal shortfall from the capital generated by the bank’s operations.
Executives at PNC continued to pause the bank’s share repurchase activity while the regulatory changes are under consideration. PNC falls short of the required risk-weighted assets-to-long-term debt ratio requirement and would need to raise $9 billion of debt to be in compliance. It expects to raise those funds under the bank’s current funding plans. If other banks decide to sell assets to meet the proposed requirement, PNC would be interested in taking a look.
Disruptive Technologies: Absorbing CO2 from the Oceans. Looking to reverse climate change, scientists are experimenting with various ways to pull carbon dioxide (CO2) out of the atmosphere. Some have turned to the oceans for a solution. The oceans absorb about 30% of the CO2 produced each year. If CO2 can be wrung out of their waters, the oceans would be able to absorb more CO2 from the atmosphere.
Taking CO2 out of the ocean is arguably more efficient than taking it out of the air, requiring less energy and expense for the same amount of gas removed. That’s because the CO2 in the ocean is 150 times more concentrated than the CO2 in the air and doesn’t need to be captured; the ocean has already done so.
Here are a few different approaches that scientists at UCLA, Caltech, MIT, and the University of Pittsburgh are using to help the Earth:
(1) Turning CO2 into seashells. Marine organisms form seashells from calcium and carbonate ions created after CO2 from the atmosphere dissolves in the oceans. So Dante Simonetti, an assistant professor of chemical and biomolecular engineering at the UCLA Samueli School of Engineering, started testing new ways that would speed up the process of turning CO2 into minerals. He helped develop a machine that electrically charges seawater, triggering a reaction that turns the CO2, calcium, and magnesium in the water into limestone and magnesium—essentially a shell-like dust—in addition to hydrogen, which can be sold as a green fuel. The remaining water can be pumped back into the ocean, where it once again absorbs CO2, or the water can be used on the land, a June 3, 2021 Fast Company article reported.
The technology was spun out of UCLA into a startup called Equatic (formerly known as “SeaChange”). Equatic has entered into agreements with Boeing and Fintech company Stripe to remove CO2 from the ocean. The Boeing deal, struck earlier this year, includes a pre-purchase option agreement for “62,000 metric tons of CO2 removal and 2,100 metric tons of ‘carbon-negative’ hydrogen that Boeing sees as feedstock for cleaner jet fuel,” according to a May 31 Axios article.
Equatic has been moving its operations beyond the lab. It’s in the process of building two plants, in Los Angeles and Singapore. It will take 1,800 of the devices to capture 10 billion metric tons of CO2 each year—less than a third of the 37 billion tons of CO2 emitted each year.
(2) Capturing bubbly. Captura is another startup that also electrolyzes a small amount of seawater to “rearrange the molecules into an acid and a base. When the acid is added back into [a larger amount] of the seawater, it reacts with the carbon to release CO2,” a May 4 article on The Verge reported. Captura either stores the CO2 or sells it as a product. The CO2-depleted water is released back into the ocean, where it can absorb CO2 again. The captured CO2 could be sold to companies that produce concrete or carbon fiber. Or Captura could build its plants on retired offshore oil and gas platforms and pump the captured CO2 underground into the deserted oil and gas wells.
The company, which was founded by Caltech researchers, is setting up a pilot project in the Port of Los Angeles. Critics worry that the company’s filters won’t be fine enough to ensure that small ocean creatures, like plankton, aren’t trapped. And if the CO2 is pumped underground, skeptics fear it will leak and emerge above ground over time.
(3) MIT & UPitt on the job, too. At MIT, researchers likewise are electrolyzing the water to separate the CO2; a second step removes the acidity and collects the CO2. The university believes its approach is less expensive than other researchers’ proposed solutions, and the process could be performed by merchant ships as they are sailing, so that their CO2 collections offset their CO2 emissions, a February 27 article in the Scientific American reported. Additionally, other ships could be deployed as “scrubbers of the oceans.”
At the University of Pittsburgh’s Swanson School of Engineering, researchers have developed two systems to capture carbon dioxide. One uses microencapsulated solvents made of sodium carbonate, and the other uses hollow fiber membrane contactors containing sodium hydroxide. As water flows over the systems, CO2 is captured. When the sodium capsules are placed in steam at a temperature of 100-120 degrees Celsius, the CO2 can be removed and stored so that the sodium capsules can be reused, as Inside Climate News reported on September 2.
Rolling Recovery
October 18 (Wednesday)
Check out the accompanying pdf and chart collection.
Executive Summary: The rolling recession that struck goods producers and distributors in early 2021 has ended, and the goods sector is now enjoying a rolling recovery, as stronger-than-expected retail sales and industrial production data attest. Consumers are shopping with gusto and increasingly on stuff; they’re not about to retrench as some hard-landers expect. … Likewise emerging from a recession are S&P 500 companies’ earnings, which may have hit a record high in Q3 along with their revenues. … And: Joe compares how various style indexes have performed since the S&P 500’s July 31 bottom as well as reviews the aggregate S&P 500 earnings data from early reporters and checks in on the MegaCap-8.
Revenues I: Rolling Recovery for Goods Providers. September’s retail sales and industrial production were up by 0.7% m/m and 0.3% m/m. Those were stronger-than-expected increases. Debbie and I weren’t surprised because we’ve been seeing signs recently that the rolling recession for goods producers and distributors, which started in early 2021, is turning into a rolling recovery.
Consumers went on a goods buying binge following the pandemic lockdowns (Fig. 1). They pivoted to binging on services around March 2021. That’s when social distancing restrictions increasingly were lifted in the services sector. When this happened, consumers decided that they had purchased enough “stuff” and it was time to pay for more “stimulus,” i.e., the experiences associated with services. Inflation-adjusted consumer spending on goods has been flat y/y, albeit at a record high, since March 2021 through August 2023. The latest retail sales report suggests that spending on goods may be starting to recover from its growth recession.
This development is the latest setback for the hard-landers. There may be fewer of them, but the diehards are convinced that consumers soon will run out of the excess saving they accumulated during the pandemic, forcing them to retrench. We’ve been countering that it’s more likely consumers have been holding onto quite a bit of those excess saving for precautionary purposes. That explains why the saving rate subsequently fell; they felt they had saved enough for a rainy day. That allowed them to spend more of their disposable income, which has been rising since the start of this year, on goods and services (Fig. 2 and Fig. 3).
Let’s review the latest relevant data:
(1) M-PMI and manufacturing output bottoming. The M-PMI rose to 49.0 in September from a recent low of 46.0 during June (Fig. 4). It’s still below 50.0. However, the sub-indexes for production (52.5) and employment (51.2) rose above 50.0 in September.
US industrial production rose 0.3% m/m in September (Fig. 5). The gain was above expectations of a 0.1% gain, according to a WSJ survey. Manufacturing rose 0.4% in September, with motor vehicle production up 0.3% despite the ongoing strike against three automakers (Fig. 6). Among the strongest gainers were computer & peripheral equipment (1.3%) and communications equipment (1.1%) (Fig. 7). Housing-related production was surprisingly strong, with solid gains in appliances, furniture, and carpeting (4.9%) and construction supplies (1.0%).
(2) September rebound for retailers. Retail & food services sales rose 0.7% m/m during September (Fig. 8). It also rose 0.7% excluding food services. During the month, the CPI for goods rose 0.1%. So real retail sales (excluding food services) rose 0.6% (Fig. 9). The gains were relatively widespread.
Revenues II: Manufacturing & Trade Activity Heading Higher. The Census Department releases data on manufacturing and trade sales (M&TS of goods) at the same time as it releases retail sales but for a month earlier. In other words, retail sales for September came out along with M&TS for August. Nevertheless, we follow the monthly M&TS series because it closely tracks S&P 500 aggregate revenues, even though the latter includes revenues from the sales of both goods and services (Fig. 10 and Fig. 11).
M&TS rose 1.3% m/m and 0.2% y/y during August. S&P 500 aggregate revenues rose 6.1% y/y through Q2. Here are some more insights from the latest M&TS data:
(1) Growth recession. Both nominal and real M&TS have been flat for the past year (Fig. 12). The weakness has been widespread among manufacturing shipments, wholesale sales, and retail sales (Fig. 13 and Fig. 14).
In current dollars, M&TS inventories has been flat at a record high since mid-2022 through August, consistent with the rolling recession in goods (Fig. 15). In real terms, these inventories flattened out around this February’s record high through July.
(2) Deflating prices. The price deflator for M&TS peaked at a record high during June 2022 (Fig. 16). It is down 4.9% since then through July 2023. On a y/y basis, deflation in the goods sector is widespread: M&TS (-3.4%), manufacturing (-4.1), wholesale (-5.6), and retail (-0.3).
Revenues III: Looking Forward. The latest earnings recession has been relatively short and shallow (Fig. 17). Earnings fell 7.9% from a record peak during Q2-2022 through the recent trough during Q1-2023. S&P 500 operating earnings per share edged up during Q2 and might have risen to a new record high during Q3! S&P 500 revenues per share probably did the same.
Confirming our predictions are S&P 500 forward revenues and forward earnings, which rose to new record highs during the week of October 5 and October 12, respectively. (FYI: Forward revenues and earnings are the time-weighted average of analysts’ consensus projections for the current year and following one. The forward profit margin is calculated from forward revenues and earnings.)
The latest earnings recession was mostly attributable to a drop in the S&P 500’s profit margin from Q2-2021’s peak of 13.4% to 11.5% during Q4-2022. It rose to 11.8% during Q2. The weekly forward profits series that Joe and I track suggests that the quarterly profit margin continued to rise during Q3.
Strategy I: Market’s Recent Swoon Creates Haves and Have-Nots. The rapid rise in bond yields during August and September caught investors off-guard, and their anxiety led to losses in the stock and bond markets. Since then, investors and corporations have re-assessed their “higher for longer” interest-rate expectations and have begun grudgingly to accept the return to more normal levels of interest rates after more than a decade of extraordinarily low ones.
Let’s review how much the various investment-style indexes have dropped from the S&P 500’s high for the year so far, on July 31, and how much they’ve risen from their recent bottoms:
(1) LargeCaps favored over SMidCaps during pullback and recovery. The S&P 500 fell 7.8% from 4588.96 on July 31 to a four-month low of 4229.45 on October 3 (Fig. 18). It narrowly avoided a correction within its rally from its 25.4% bear market low of 3577.03 on October 12, 2022. The S&P MidCap 400 and S&P SmallCap 600 performed worse than their LargeCap counterpart. MidCap’s 11.0% decline through October 3 put that index back into a correction, while SmallCap’s 13.2% drop through its October 13 low caused it to fall back into a bear market.
LargeCap has risen 3.4% from its October low through Monday’s close, better than the respective 2.2% and 1.8% gains for MidCap and SmallCap.
(2) Growth mostly beats Value down and up. The S&P 500’s decline since July 31 was led by a 9.4% drop in the S&P 500 Value index, while S&P 500 Growth fell just 6.5%. The declines from the MidCap and SmallCap indexes’ July 31 peak to their October troughs likewise were less for Growth than Value: MidCap Growth (-9.5%), MidCap Value (-12.7), SmallCap Growth (-11.4), and SmallCap Value (-15.1).
Growth mostly has led Value across these indexes since their troughs, which seems counter-intuitive when interest rates are rising. Here’s how they’ve performed since their October lows: LargeCap Growth & Value (3.8% vs. 2.9%), MidCap Growth & Value (2.5, 1.9), and SmallCap Growth & Value (1.6, 2.0).
(3) Recent gains spreading? While the S&P 500 fell below its 50-day moving average (dma) during its pullback, it has remained above its 200-dma, and the recent buying is spreading. The index rose for a second straight week during the October 13 week after falling in seven of the prior nine weeks. While the index gained just 0.4% for the week, eight of its 11 sectors rose and five outperformed the composite index.
That compares to just three S&P 500 sectors rising during the October 6 week: Communication Services, Consumer Discretionary, and Tech. Those were also the only three sectors to beat the S&P 500 that week. The fact that each houses at least two MegaCap-8 companies certainly helped. (FYI: The MegaCap-8 stocks are: Alphabet, Amazon, Apple, Meta, Microsoft, Netflix, Nvidia, and Tesla.)
Whether or not last week’s gain represents a broadening of the recovery or simply portfolio re-positioning ahead of the Q3 earnings season remains to be seen.
Strategy II: Positive Signs from Early Reporting Financials. The Q3-2023 earnings season is beginning to ramp up with releases from some of the major companies in the S&P 500 Financials sector. In particular, members of the Asset Managers and Banks industry are off to a great start. Among the reporters so far are Bank of New York Mellon, recent S&P 500 index addition BlackRock, Bank of America, Citigroup, JPMorgan Chase, PNC Financial, and Wells Fargo.
They’ve all reported consensus earnings beats across the board, with Financials’ aggregate earnings-per-share beat and y/y earnings growth coming in at 13.3% and 12.6%, respectively. There were mostly positive surprises and positive y/y growth on the top lines as well. Only BlackRock and PNC missed their consensus revenues forecast, albeit slightly, and only PNC’s revenues were down from a year earlier. Overall, the Q3 results are impressive considering the industry’s challenges this year, including interest-rate angst, regional bank failures, and reduced share buyback activity.
With these and other early reporters’ Q3 results tallied, the S&P 500 earnings season is now nearly 8% complete. Actual earnings for the S&P 500 companies that have reported Q3 so far are ahead of consensus forecasts by 9.9%, but their revenues have exceeded expectations by only 0.9%. That compares to 9.7% and 1.3% at the same point during the Q2-2023 earnings season.
In aggregate, earnings for Q3’s early reporters are up 8.3% y/y, and their revenues have risen 6.5%. During Q2, the comparable figures were 13.4% for y/y earnings growth and 7.7% for revenue growth.
The Q3 data so far suggest a repeat of Q2’s earnings performance—i.e., neither too hot nor too cold—which should help support the nascent recovery in stock prices.
Strategy III: MegaCap-8’s Forward Profit Margin at Notable Highs Now. The MegaCap-8 had a relatively forgettable year during 2022 as its revenues and earnings took a steep dive along with its profit margin. Now the group has come full circle and is giving a much-needed boost to the S&P 500’s profitability, as Joe shows below.
The S&P 500’s latest forward profit margin reading (during the October 6 week) was at a 10-month high of 12.7%. It’s up 0.4pt from a two-year low of 12.3% during the March 31 week (Fig. 19). That margin performance owes much to the contribution of the MegaCap-8.
When we exclude the MegaCap-8, the latest reading for the S&P 500’s forward profit margin drops 1.0pt to 11.7% from 12.7%. That’s the MegaCap-8’s biggest contribution ever (since December 2012) to the broad index’s profit margin. Without the MegaCap-8, the S&P 500’s forward profit margin would be up just 0.1ppt from its two-year low of 11.6% during the June 30 week.
The MegaCap-8’s forward profit margin was back up to 20.8% last week (ended October 13) from a post-pandemic low of 18.1% during the March 31 week. That 20.8% reading is the highest in two years and only 0.1pt below the group’s post-pandemic high of 20.9% two years ago (during the September 10, 2021 week).
The MegaCap-8 is clearly in a rolling profits recovery.
It’s Different This Time
October 17 (Tuesday)
Check out the accompanying pdf and chart collection.
Executive Summary: Today, we compare the current economic and financial environment with those of three past periods—the late 1970s, early 2000s, and mid-2000s. Today’s environment resembles the other three in that easy credit conditions fueled price and/or asset inflation, which led to tightening of credit conditions. In the past periods, that set off economywide credit crunches and recessions that moderated inflation. This time is different: No economywide recession is forthcoming, yet inflation is moderating anyway. The most important difference about this period, however, is that productivity growth is unlikely to collapse but to boom throughout the rest of this decade.
Weekly Webcast. If you missed Monday’s live webcast, you can view a replay here.
History I: Then & Now. Mark Twain said, “History doesn’t repeat itself, but it often rhymes.” In other words, details change, circumstances change, settings change, names change, but similar events will essentially recycle. That’s because human nature doesn’t change. Several years after Twain’s comment on history, Yogi Berra observed, “It’s like déjà vu all over again.”
Debbie and I were recently asked by one of our accounts in Manhattan to compare the current economic and financial environment to those of the late 1970s, the early 2000s, and the mid-2000s. The first period was associated with the Great Inflation. The second period included the Tech Wreck and the 9/11 terrorist attacks. The third period was marked by the bursting of the housing bubble.
We were tasked with the job of assessing the similarities and the differences between what happened back then and what is happening now. We were asked to focus on GDP, inflation, money and credit, speculative bubbles, and geopolitics. We’ve previously compared what happened then and now. Indeed, in 2018, I wrote a book on the subject titled “Predicting the Markets: A Professional Autobiography.” In effect, it is a history of the first 40 years of my career on Wall Street, which started in 1979. Over that period, history often rhymed, though not always.
The four historical cycles under review, including the current one, all started with easy credit conditions that fueled economic booms and inflated consumer prices and/or assets prices. Price inflation and/or speculative asset bubbles forced the Fed to tighten credit conditions. The result during the first three cycles were financial crises that morphed into economy-wide credit crunches and recessions. Price inflation moderated and the speculative bubbles burst, which exacerbated the economic downturn.
So far, this time has been different, but it still rhymes with recent history. Easy money boosted economic growth following the pandemic lockdown. Fiscal policy also was very stimulative, much more so than in the past. Price inflation soared, as it did during the 1970s. Wage inflation did so too. Assorted speculative mini-bubbles in the stock market burst, causing a relatively short bear market. But the biggest bubble turned out to be the one in the bond market, which has suffered the worst bear market of all times over the past three years as the Fed slammed on the monetary brakes to break the back of inflation.
This time, there was a financial crisis that caused a couple of banks in California to collapse. But the Fed contained the problem by quickly providing an emergency liquidity facility for the banks. Credit conditions certainly have tightened, but there hasn’t been an economy-wide credit crunch like the ones during the previous three periods. So far, the most widely anticipated recession of all times has been a no-show, even though the tightening of monetary policy is reminiscent of that of the late 1970s, when the Fed, under then-chairman Paul Volcker, likewise slammed on the brakes.
History II: GDP. There were four recessions during the Great Inflation from 1965 through 1982 (Fig. 1 and Fig. 2). The second and the fourth were among the longest and deepest ones since the end World War II. Leading the way down were the quarterly housing and auto components of real GDP (Fig. 3 and Fig. 4). They fell along with the monthly series on housing starts and auto sales (Fig. 5 and Fig. 6).
The recession at the start of the 2000s was largely attributable to the bursting of the tech bubble. There was a big boom in spending on communications equipment prior to that recession. The industrial production index for communication equipment plunged 40.7% from January 2001 through October 2002 (Fig. 7). During the recession of the Great Financial Crisis (GFC), computer & peripheral equipment output dropped 41.9% from May 2008 through March 2011.
The biggest contributor to the recession of the GFC was the bursting of the real estate bubble and all the credit derivatives that had inflated the bubble. The resulting credit crunch was significant.
History III: Inflation. The most intense and prolonged bout of inflation occurred during the Great Inflation period (Fig. 8). The Great Inflation of the 1970s actually started during the second half of the 1960s. It was triggered by President Lyndon Johnson’s decision to deficit-finance the Vietnam War rather than to increase taxes to fund the war. The same can be said about his Great Society initiative. A result of this guns-and-butter approach to fiscal policy was higher inflation.
President Richard Nixon continued that approach during the early 1970s and exacerbated inflation by closing the gold window on August 15, 1971, which caused the dollar to depreciate significantly. The weaker dollar boosted commodity prices and caused OPEC to drive oil prices higher during the 1970s. A wage-price-rent spiral ensued during the Great Inflation.
Then-Fed Chair Paul Volcker allowed interest rates to soar in late 1979 and the early 1980s to halt the Great Inflation by triggering a credit crunch and a recession. Inflation did decline and remained low during the Great Moderation from the mid-1980s until the start of the GFC. From the GFC through the GVC (Great Virus Crisis), central bankers obsessed about deflation and provided ultra-easy monetary policy, hoping to boost inflation to their 2.0% inflation targets.
This time, several rounds of fiscal stimulus programs combined with ultra-accommodative monetary policies caused a demand shock that overwhelmed supplies, unleashing the current bout of inflation. The programs presumably were aimed at offsetting the negative impact of the pandemic on workers. The Fed has raised the federal funds rate by 500bps since March 2022 from 0.00%-0.25% to 5.00%-5.25%. It has been the most aggressive tightening of monetary policy since Volcker headed the Fed.
What’s different this time is that the US dollar is strong. The Fed has been more aggressive in tightening monetary policy in response to inflation than the other major central banks. Also, the US economy is performing much better than the other major economies, which likewise supports the dollar. In addition, the current inflationary spike is turning out to be relatively transitory, as we discussed in yesterday’s Morning Briefing.
History IV: Money & Credit. The most intense credit crunch occurred during the GFC. Home mortgage borrowing collapsed from a record high of $1.26 trillion over the four quarters through Q2-2006 to a record low of -$136 billion through Q4-2010 (Fig. 9). Commercial mortgage borrowing peaked at a record $289 billion over the four quarters through Q4-2006 and plunged to -$143 billion during Q3-2010 (Fig. 10).
The credit crunch triggered by Volcker hit consumer spending on durable goods and housing the most. During the Tech Wreck of the early 2000s, the credit market for telecommunication loans and bonds was hit the hardest. Several significant failures ensued, including WorldCom (2002). It was brought down by an accounting scandal. So too was Enron in 2021.
This time, credit conditions have tightened in response to the Fed’s aggressive tightening of monetary policy. However, there remains plenty of liquidity in the financial system. In any event, the economy has proven to be remarkably resilient.
History V: Bubbles. During the 1970s, the biggest bubble was inflated in the global energy industry as oil prices soared. When it burst in the first half of the 1980s, the US energy sector fell into a rolling recession. The overall economy continued to grow because the Fed lowered interest rates. Commercial real estate turned out to be a bubble in the oil patch back then.
The tech bubble burst in the early 2000s. It had less to do with the Fed than with the cash burn rate of unprofitable dotcom startups. Many were able to raise money for a while during the late 1990s. They used the funds to buy lots of IT hardware and software. In addition, such spending was boosted by a scramble to avert a Y2K calamity by upgrading. At the turn of the millennium, Y2K spending dried up, and most dotcoms failed to attract more funding for their questionable business plans.
The housing bubble during the GFC was an accident waiting to happen. A series of blowups in the credit derivatives market led to a credit crunch that spread well beyond the US housing market after Lehman Brothers failed in September 2008.
This time, as noted above, the biggest bubble to burst has been the bond market’s, as the yield on the 10-year US Treasury bond soared from a record low of 0.52% on August 4, 2020 to 4.80% recently (Fig. 11). Yet so far, there has been no significant adverse effect on the overall economy and labor market. That’s partly because bond investors aren’t forced to take losses if they can hold their bonds to maturity. In addition, as we’ve previously observed, there is still lots of liquidity in the financial system. Many corporations refinanced their debts at record-low interest rates. Corporate cash flow is at a record high (Fig. 12). Household net worth is also at a record high (Fig. 13).
History VI: Geopolitics. Fifty years ago, on October 6, 1973, Israel was hit by a surprise attack by Arab armies from Egypt, Jordan, and Syria. That was the Yom Kippur War. A week ago, on Saturday, October 7, Israel was hit by a surprise attack by Hamas terrorists.
In recent years, previous geopolitical crises in the Middle East have tended to be short-lived. Selloffs in the US stock market turned out to be buying opportunities. So far, the stock market hasn’t reacted adversely to the latest crisis. That’s partly because the price of oil hasn’t spiked on this development. The widespread assumption is that this crisis will also be short-lived and won’t turn into a regional war with Iran joining forces with Hamas and Hezbollah.
History VII: Now & Then. There are many similarities and many differences between now and our very brief review of the 1970s and the 2000s. Books have been written about the financial and economic history of the past 40+ years, including my own book.
In our opinion as prognosticators, the most important difference between now and then is that we are expecting a productivity growth boom over the rest of this decade. Conversely, productivity growth collapsed during the previous three periods we spotlighted above (Fig. 14).
The biggest risk to our optimistic outlook is that the Bond Vigilantes respond to Washington’s fiscal excesses and follies by pushing the bond yield up to levels that cause a credit crunch and a recession. We reckon that would put the 10-year Treasury bond yield well north of 5.00%.
All About Inflation
October 16 (Monday)
Check out the accompanying pdf and chart collection.
Executive Summary: To answer whether the latest bout of inflation in general will prove persistent or transitory, we must look deeper than the headline rate. Core rates exclude energy and food, but shelter arguably should be excluded to get the answer, as it too is still distorted by temporary pandemic-related factors. The resounding message we hear from September’s CPI data: Both headline and core CPI rates—ex shelter—were 2.0% y/y in September. That’s the Fed’s target rate (albeit for the PCED). For us, that’s confirmation enough that inflation is moderating. It’s transitory, not persistent. Then again, some will see signs of persistent inflation in the data details. ... And: Dr. Ed reviews “Somewhere in Queens” (+).
YRI Weekly Webcast. Join Dr. Ed’s live webcast with Q&A on Mondays at 11 a.m. EST. You will receive an email with the link one hour before showtime. Replays of the weekly webcasts are available here.
Inflation I: Selectively Slicing & Dicing the CPI. Most economists, including Debbie and me, believe that if the data don’t support our forecasts, then there must be something wrong with the data and that they will be revised to show we were right after all. Most economists, including yours truly, also often dismiss components of headline indicators that don’t support our story and look to the remaining “core” indicators for conformity to our outlook and therefore confirmation of it.
This slicing-and-dicing approach to the major economic indicators is usually what happens when the monthly employment report is released. If the seasonally adjusted data don’t support one’s narrative, the thinking goes, perhaps the data on a not seasonally adjusted basis will. Or perhaps the revisions to the prior months’ data will point in the “right” direction and therefore be what to highlight. If the payroll measure of employment isn’t as friendly as the household measure, focus on the household one.
Another major economic indicator that is invariably sliced and diced by the brotherhood and sisterhood of economists is the CPI. September’s number was released along with all its components last week on Thursday. Some economists (such as us) claimed that it confirmed that inflation is still moderating and is turning out to be relatively transitory. Others looked at the report and concluded that inflation is stalling at a pace well above the Fed’s 2.0% inflation target. A few economists found evidence that inflation may be accelerating again, so it remains a persistent problem.
So who is right? We all are right all the time because there’s plenty of data to support all of our stories. Nonconforming data are dismissed as preliminary estimates that undoubtedly will be revised or simply are flawed. Future revisions no doubt will show that we are on the right track after all; if not, different data do so. We may not all be Keynesians or monetarists, but we are all prescient based on the data we choose to support our outlook!
Now let’s slice and dice the latest CPI and see what’s left:
(1) Ignore the headline. Pay no attention to the headline inflation rate. That was one of the messages in the speech delivered by Fed Chair Jerome Powell at Jackson Hole on August 25. From the get-go, he said that “food and energy prices are influenced by global factors that remain volatile and can provide a misleading signal of where inflation is headed.” So he focused his analysis on the core inflation rate, i.e., the headline rate less energy and food. Of course, this has been the Fed’s approach for many years.
The Fed’s preferred measure of inflation has been the core PCED, which closely tracks the core CPI (Fig. 1). The latter tends to exceed the former. For today, we will focus on the CPI through September since the PCED’s September reading won’t be out until near the end of the month.
The headline CPI inflation rate was 3.7% y/y through September (Fig. 2). The core rate for the CPI was higher at 4.1%. Both are down from their 2022 peaks of 9.1% and 6.6%, respectively. But both remain well above the Fed’s 2.0% target.
(2) Taking out shelter. Before we go any further, here’s our punch line: The headline and core CPI inflation rates excluding shelter were both 2.0% y/y during September (Fig. 3). So to the question of when we’re going to get to the Fed’s inflation target, the answer is that we’re there now excluding shelter, at least based on the CPI measure!
Rent of shelter accounts for a whopping 34.7% and 43.6% of the headline and core CPI measures. Its inflation rate jumped from a low of 1.5% during February 2021 to a peak of 8.2% during March 2023 (Fig. 4). It was down in September but only to 7.2%.
In his speech, Powell observed: “Because leases turn over slowly, it takes time for a decline in market rent growth to work its way into the overall inflation measure. The market rent slowdown has only recently begun to show through to that measure. The slowing growth in rents for new leases over roughly the past year can be thought of as ‘in the pipeline’ and will affect measured housing services inflation over the coming year.”
Also, Powell acknowledged in his speech that “market rent” inflation (i.e., for new leases) has declined “steadily” this year. The Zillow rent index was down to 3.2% y/y during September. Using that reading rather than the CPI’s rent of shelter reading of 7.2%, Debbie found that the headline CPI is up just 2.3% versus 3.7% for the actual headline CPI!
Based on our analysis so far, the latest bout of inflation is turning out to be transitory rather than persistent after all, in our opinion. The Fed might achieve its 2.0% target for the core PCED inflation rate well ahead of schedule, i.e., in 2024 rather than 2025.
(3) Goods inflation is good. In his speech, Powell implied that core goods inflation undoubtedly has turned out to be transitory after all. He said: “Core goods inflation has fallen sharply, particularly for durable goods, as both tighter monetary policy and the slow unwinding of supply and demand dislocations are bringing it down.”
We’ve previously explained that consumers’ post-lockdown buying binge was focused on goods because services were still hampered by social distancing restrictions. That caused goods inflation to spike from around zero in the summer of 2020 to 14.0% in 2022 (Fig. 5). During September, goods inflation was down to 1.4%, with durable goods down 2.2% and nondurable goods up 3.2%. Core goods were unchanged in September from a year ago (Fig. 6).
(4) Supercore inflation is persistent. In his speech, Powell said: To understand the factors that will likely drive further progress [on lowering inflation], it is useful to separately examine the three broad components of core PCE inflation—inflation for goods, for housing services, and for all other services, sometimes referred to as nonhousing services.” That last category has also come to be known as the “supercore” inflation rate. It has been sticky, having been stuck around 4.5%-5.0% since October 2021 (Fig. 7). However, the CPI services less housing inflation rate was down to 2.8% in September from last year’s peak of 8.2%.
(5) Health insurance is wild. It is widely recognized that the CPI’s health insurance component is very volatile and based on a very questionable measurement technique (Fig. 8). Far more sensible is the PCED’s measure of health insurance, which recently has been relatively stable and in the low single digits on a y/y basis, while the CPI measure has been bouncing around between positive and negative double-digit y/y percent changes. The latter was down 37.3% y/y during September and is now expected to swing back into positive territory for the next few months.
We all know this and will adjust for this distortion. In any event, it has a tiny weight of 0.545% of the CPI.
(6) Auto prices could accelerate. Contributing to the volatility and transitory nature of inflation since the pandemic have been new and used car prices. Supply-chain disruptions disrupted the supply of new cars in 2020 through the first half of 2022, sending new car prices soaring. As these problems abated, the inflation rate of new car prices plummeted (Fig. 9).
Used car prices soared even more than new cars prices during the pandemic, and the former plunged more than the latter afterwards (Fig. 10). Now the concern is that the UAW strike will cause a shortage of new auto inventories that once again will boost new and used auto prices.
(7) Bottom line. They say that the devil is in the details. That may very well be true about the outlook for inflation. However, inflation is usually defined as a general and relatively broad increase in prices. In any one month, a few of the CPI’s components might account for much of the increase or decrease that month. It’s the underlying trend that matters. That’s what we look to most for either confirmation of our outlook or the need to change it. The latest data confirm for us that our narrative remains on track: Inflation is continuing to moderate.
Inflation II: Slicing & Dicing Other Indicators. Last week, other inflation indicators were also released, including the PPI, the wage growth tracker (WGT), consumers’ inflation expectations, and import & export prices. Let’s slice and dice them as well:
(1) PPI. September’s PPI for final demand was up 0.5% m/m, which was a bit hotter than expected. Yet it was up only 2.2% y/y. More importantly, in our opinion, is that the core PPI for final demand of personal consumption rose 2.7% (Fig. 11). It tends to be a leading indicator for the core CPI and the core PCED, which were 4.1% in September and 3.9% in August. The PPI measure of prices received by consumer-related companies does not include rent and suggests that the other two measures should continue to fall if rent inflation falls as we expect.
(2) WGT. The WGT fell to 5.2% y/y in September, the lowest since January 2022 (Fig. 12). That’s still a high reading. However, it tends to exceed the wage inflation rate measured using average hourly earnings for production and nonsupervisory workers, which was down to 4.3% in September. Fed Chair Powell previously has said that he would like to see wage inflation closer to 3.0%. It is still heading in the right direction.
Interestingly, the WGT measure of wage inflation for job switchers has declined more rapidly than for job stayers since they both peaked last year (Fig. 13). This may explain why the quits rate has dropped since early last year.
(3) Expectations. The Federal Reserve Bank of New York released its survey of consumer expectations last week for September. It showed upticks in the one-year- and three-years-ahead inflation expectations to 3.7% and 3.0% (Fig. 14). Those are still relatively low readings. They edged up mostly because gasoline prices rose last month.
(4) Import prices. The US continues to import deflation from overseas. Import prices fell 1.7% and 1.2% y/y with and without petroleum through September (Fig. 15). Contributing to the weakness in US import prices are deflationary forces that are depressing China’s PPI (-2.5% y/y in September) and CPI (unchanged y/y) (Fig. 16). These forces include the bursting of China’s property bubble and the rapidly aging population.
Movie. “Somewhere in Queens” (+) (link) was written and directed by Ray Romano about an Italian family living in Queens. Ray stars as Leo Russo, the father. He works for his father’s construction company. It’s a family business, and Leo’s large extended family is in everybody else’s business. They regularly get together at the local catering hall for family events. Leo is obsessed with helping his son overcome his social awkwardness by pushing him to succeed on his high school basketball team, which he does. Leo pushes a bit too hard to get his son a college basketball scholarship and causes a family crisis as a result. It’s a warm-hearted film about the importance of famiglia in our lives.
Banks, Biotech & Digital Money
October 12 (Thursday)
Check out the accompanying pdf and chart collection.
Executive Summary: Bank stocks have tanked this ytd, and analysts are pessimistic on earnings prospects. Valuations are so depressed that both the S&P 500 Regional Banks and S&P 500 Diversified Banks industry indexes sport forward P/Es below 10. But Jackie sees signs that Q3 earnings may not be as bad as feared, including a recent pickup in capital markets activity and adequate protections against slowly rising loan losses. … Also underperforming this year has been the S&P 500 Biotech industry. But brisk M&A activity may underpin these stocks. … And: China has rolled out a digital currency; the government has been incenting its uptake in numerous ways.
Financials: Could They Surprise? The S&P 500 Financials sector has had a terrible year, especially considering that the US economy managed to avert recession. Worries about commercial real estate loans, underwater Treasury bonds, and fleeing deposits have cast a pall over the sector’s stocks.
Here’s the performance derby for the S&P 500 and its 11 sectors ytd through Tuesday’s close: Communication Services (45.4%), Information Technology (38.5), Consumer Discretionary (27.0), S&P 500 (13.5), Industrials (4.8), Materials (1.5), Energy (1.1), Financials (-2.8), Health Care (-3.6), Real Estate (-7.9), Consumer Staples (-8.5), and Utilities (-17.0) (Fig. 1).
The S&P 500 Financials sector’s -2.8% ytd return actually masks how awful the year has been for banks and brokers because insurance-related industries have had strong ytd performances: Reinsurance (16.3%), Insurance Brokers (12.4), and Financial Exchanges & Data (12.3). On the other side of the coin, the Financials industries with miserable ytd performances include: Regional Banks (-38.4%), Investment Banking & Brokerage (-17.4), Asset Management & Custody Banks (-8.8), and Diversified Banks (-4.7) (Fig. 2).
With Q3 earnings reports kicking off on Friday, we decided to look for what might go right for these beleaguered monetary giants. Here are a few of the optimistic nuggets that might offset some of the gloom:
(1) Capital markets thawing. Firms involved with capital markets activity may have benefitted from the reopening of the IPO market and stabilization in the fixed-income markets. This week, deal flow included an IPO from comfy shoemaker Birkenstock and ExxonMobil’s announcement that it has struck a deal to acquire Pioneer Natural Resources for $59.5 billion.
Improvement in the capital markets was evident in Jefferies Financial Group’s Q3 results reported on September 27. Revenue in its Q3 debt and equity underwriting businesses jumped 16.2% y/y, and its equities and fixed-income capital markets business jumped 14.0% y/y. The only area still lagging was the firm’s investment banking advisory business, due to a decline in global M&A volume. Revenue in this area dropped 30.4% y/y but rose 31.9% q/q.
(2) Loan losses could rise slowly. Most consumers are gainfully employed, with the unemployment rate remaining remarkably low at 3.8%. Those with a job should be able to make credit card and home mortgage payments, though banks have been slowly increasing their reserves. In Q2, even the impenetrable JPMorgan more than doubled its provision for credit losses in consumer lending to $1.9 billion due to a jump in provisions in the credit card area. As long as provisions can rise slowly, banks should be able to absorb them. Even after increasing provisions, JPMorgan earned $14.5 billion in Q2.
More concerning is the health of commercial real estate loans, particularly those involving office buildings given that many employees have been unwilling to return to the office more than three days a week. Tales of half-empty buildings in downtown areas have filled the headlines. And some small, less diversified banks may indeed have problems.
But PNC Financial Services Group’s Q2 earnings report indicated that larger banks may be able to manage their way through whatever office real estate bankruptcies lie ahead. PNC’s office real estate loans total $8.7 billion; that’s 24% of its $35.9 billion commercial real estate loan portfolio but only 5.0% of the bank’s $177.6 billion commercial and industrial loan portfolio and a mere 2.7% of its total loans.
Nonperforming office loans totaled 3.3% of the office loan portfolio, but that number is sure to increase, as 22.5% of the portfolio is criticized—i.e., the loans are still performing but exhibit some weakness in safety or soundness, perhaps due to high leverage or deteriorating collateral values. The bank’s filing says it has established reserves that reflect expected losses in the office loan portfolio.
Loan losses and provisions for loan losses across the banking industry are rising, with the best part of the credit cycle in the rear-view mirror. FDIC-insured institutions increased their provisions for loan and lease losses by $21.5 billion in Q2, compared to a much smaller increase of $11.1 billion in Q2-2022 and decrease of $10.8 billion in Q2-2021 (Fig. 3).
(3) Problematic Treasuries. Banks that have been caught holding long-dated Treasuries and mortgage-backed securities in their held-to-maturity accounts, such as Bank of America, may underearn their peers for a few quarters. But those securities, if held to maturity, will be paid back in full and replaced with higher-earning investments. These are not the CDOs of 2008 that ended up being worth pennies on the dollar. And if we’ve seen the peak in interest rates for this cycle, worries about the banks’ paper losses on these securities may have peaked as well.
(4) Pessimism so bad it’s good. Perhaps most importantly, Wall Street’s analysts are a relatively pessimistic bunch when it comes to banking-related financials. For the banks in the S&P 500 Regional Banks industry, they’re forecasting a collective 7.9% drop in earnings this year and a 6.2% decline in 2024 (Fig. 4). The S&P Diversified Banks industry is expected to post solid earnings growth of 16.0% this year, but that disappears next year when earnings are forecast to drop 4.9% (Fig. 5). Only the S&P Investment Banking & Brokerage industry is expected to see earnings growth of 30.3% next year after a projected earnings decline of 11.9% this year (Fig. 6).
Forward P/Es for the Regional Banks and the Diversified Banks industries are both under 10, at 7.6 and 8.5, respectively (Fig. 7 and Fig. 8). Only the Investment Banking & Brokerage industry’s forward P/E has risen modestly from its June 23, 2022 low of 9.5 to a recent 10.8 (Fig. 9).
Health Care: M&A Biotech Boost. It hasn’t been a great year for biotechnology stocks. The S&P 500 Biotechnology stock price index has fallen 3.8% ytd through Tuesday’s close, and the iShares Biotechnology ETF, known by its ticker IBB, has declined 6.3% ytd (Fig. 10). That leaves these biotech stock indexes lagging the S&P 500 Health Care sector’s ytd return of -3.6% and the S&P 500’s 13.5% gain so far this year.
Biotech shares, many of which don’t generate profits, have come under pressure from the jump in interest rates this year. But continued momentum in the M&A market may underpin stock prices. So far in 2023, there have been 28 biotech acquisitions valued at more than $500 million. That compares to the 43 deals of 2022, 35 in 2021, 28 in 2020, 29 in 2019, and 24 in 2018, according to data from BiopharmaDive in an October 8 article. Here’s a quick look at what’s driving the industry:
(1) Lots of dry powder. Global pharmaceutical companies have $700 billion in cash and leverage available to make acquisitions and bolster their research pipelines as patents expire, according to calculations by Goldman Sachs. “There’s tremendous interest in M&A driven by the fact that pharmaceutical companies are facing big cliffs toward the end of the decade with roughly $200 billion in revenue that will erode as a result of patent expirations that will allow for competition from generic drugs,” said Goldman healthcare analyst Asad Haider in July.
(2) Bristol makes its move. M&A deals are almost always good news for biotech targets. This week, Bristol-Myers Squibb announced it will acquire Mirati Therapeutics for up to $5.8 billion to gain access to Mirati’s oncology drugs that target genetic drivers of specific cancers. Mirati’s portfolio includes its lung cancer drug, Krazati, which was approved in December. The company’s shareholders will receive $58 a share in cash and one non-tradeable contingent value right for each Mirati share. Mirati shares jumped to $56.60 as of Tuesday’s close, up from a 2023 low of $28.06 in August and high of $54.26 in February.
This deal follows Bristol’s acquisition of Turning Point Therapeutics for $4.1 billion last year, and it helps to boost Bristol’s drug portfolio now that two of its largest drugs, Revlimid and Eliquis, face generic competition.
(3) Modest earnings expectations. Analysts are looking for companies in the S&P 500 Biotechnology index collectively to produce revenue that inches up by 1.6% in 2024 after decreasing by 8.2% this year (Fig. 11). Earnings for index members are forecast to fall 22.4% this year and improve by 3.4% in 2024 (Fig. 12).
Disruptive Technologies: China Pushes Digital Yuan. For years, the Federal Reserve and other federal agencies have been studying the viability of a digital dollar. Their job has gotten harder now that many mainstream Republicans, Silicon Valley libertarians, and anti-establishment leftists have opposed a digital US currency. Some opponents prefer bitcoin and/or oppose the control and information that a digital dollar would give the government.
While we study and bicker over the possibility of a digital dollar, the Chinese government has already rolled out its digital currency, the e-CNY, with mixed success. The digital yuan was available in 26 cities, and 5.6 million merchants have registered to use it as of last year. There have been 120 million wallets opened to hold e-CNY, and 950 million transactions valued at 1.8 trillion yuan ($249.9 billion) have occurred as of July, according to an October 10 article in the South China Morning Post (SCMP).
Those figures, while large, have much room left to grow if the digital currency is broadly adopted by China’s massive population. The government appears to be finding ways to encourage (dare we say “push”?) its citizens and others to use the digital currency. Here’s a look at some of them:
(1) Tourists using e-CNY. Starting last month, foreigners in China are allowed to sign up for an e-CNY wallet using their international phone number and their Visa or Mastercard. The wallet can be used to make purchases at stores that display the e-yuan acceptance sign and on online platforms, like Meituan and Ctrip.
The e-CNY wallets are also linked to the Faster Payments System of the Hong Kong Monetary Authority. Tourists from Hong Kong can open an e-wallet, use e-CNY for purchases, and pay lower transaction costs. This feature was introduced in advance of the Asian Games, held recently and used by attending athletes, an October 9 article on Bitcoin.com reported.
In September at the China-Asean expo, a large trade show held in Nanning, many banks set up e-CNY experience zones at their booths, the SCMP article reported.
(2) E-CNY for bus fare. Some Chinese provincial and city governments have begun to pay their employees in e-CNY, including Jiangsu province and the city of Changshu.
Meanwhile, the city of Suqian plans to adopt digital yuan wallets for government budget units. In the city of Jinan, citizens will use digital wallets to pay for bus rides. And the e-CNY can be used for subway tickets in the city of Ningbo.
(3) WeChat and Alipay onboard. One reason why the adoption of the e-CNY has been slow is because most Chinese citizens already use digital wallets from WeChat and Alipay for their transactions. “The payment market structure formed by cash, bank cards, and third-party payment platforms are currently satisfying the needs for daily consumption in China,” a former director-general of research at the People’s Bank of China (PBOC) said at a conference, according to a December 31 article on Bitcoin.com.
With this in mind, the PBOC has worked to improve the compatibility and the integration of the e-CNY with the WeChat and Alipay wallets, a July 5 Bitcoin.com article reported. WeChat announced in March that the e-CNY would be integrated into its system, and Alipay did the same in December.
(4) Bridging countries. The PBOC joined the central banks of the United Arab Emirates, Thailand, and Hong Kong and the BIS Innovation Hub Hong Kong Center in 2021 to develop the mBridge. It uses digital currencies and blockchain to facilitate cross-border payments.
The organization’s stated goal is to allow cross-border payments to be immediate, cheap, and universally accessible with secure settlement. In September, Tencent became one of the first organizations chosen to participate in the project’s pilot. And presumably from China’s government’s perspective, if the program happens to help the yuan replace the dollar, all the better.
Bonds & Stocks
October 11 (Wednesday)
Check out the accompanying pdf and chart collection.
Executive Summary: Fitch’s downgrade of US debt on August 1 was triggering for both the bond and stock markets. Bond yields since have soared, while S&P 500 companies’ collective valuation has staggered. Today, we examine the underlying issues that have kept yields elevated and the question of whether they’ve now risen high enough to attract sufficient demand to clear supply. … And: Joe shares stats on the MegaCap-8’s valuation declines since the end of July. Notwithstanding their valuation hits, these eight stocks now represent a slightly bigger slice of the S&P 500’s market cap, at a record-high 27.4%, than they did in July.
Bonds: Explanations for the Recent Rout. Why did the 10-year Treasury bond yield soar from 3.97% on July 31 to 4.81% on October 3 (Fig. 1)? There are several explanations, and the answer is probably “all of the below.” Consider the following:
(1) Too much supply of Treasuries. We’ve been arguing that the deluge of Treasury supply has been the main driver of this rout in the bond market. The rapidly widening federal deficit forced the Treasury to announce during the summer a significant increase in the securities that would have to be sold over the rest of the year. During August and September, the amount of US Treasury debt held by the public rose $335 billion and $286 billion, respectively (Fig. 2). The bond yield rose quickly to a level that should stimulate enough demand to clear the increased supply of Treasuries over the rest of this year through next year.
(2) Higher for longer short-term interest rates. Another thesis that also makes sense is that the rout was exacerbated by Fed Chair Jerome Powell when he reiterated at his September 20 press conference that the FOMC intended to remain restrictive through next year by maintaining the federal funds rate higher for longer. Specifically, he said: “We’re prepared to raise rates further if appropriate, and we intend to hold policy at a restrictive level until we’re confident that inflation is moving down sustainably toward our objective. In determining the extent of additional policy firming that may be appropriate to return inflation to 2 percent over time, the Committee will take into account the cumulative tightening of monetary policy, the lags with which monetary policy affects economic activity and inflation, and economic and financial developments.”
The big shock that same day was the release of the FOMC’s latest quarterly Summary of Economic Projections (SEP). Instead of four rate cuts totaling 100bps next year (as was projected in June’s SEP), the latest SEP showed two cuts totaling 50bps.
(3) Stronger-than-expected economic growth. Meanwhile, the yield-curve spread between the 10-year and 2-year Treasury notes has narrowed significantly from a recent low of -108bps to -30bps on Friday (Fig. 3). The disinverting yield curve might suggest that a recession is less likely now. After all, Q3’s economic indicators have been mostly stronger than expected, as evidenced by the Citigroup Economic Surprise Index (CESI) (Fig. 4). Since the summer, it has been hovering around 60.0, which is a relatively high reading. The 13-week change in the bond yield tends to track the CESI closely (Fig. 5).
In the past, inverted yield curves disinverted during recessions when the Fed cut interest rates to revive economic growth. Short-term rates fell faster than long-term rates. This time, the 10-year Treasury bond yield is rising faster than the 2-year yield. If that continues, the chances of something breaking in the credit markets will increase. If something breaks, it could precipitate a credit crunch and a recession after all!
(4) Demand for Treasuries has decreased. Exacerbating the bond rout has been the weakening demand for Treasuries. The Fed started its quantitative tightening (QT) program on June 1, 2022. Since then, through the October 4 week, the Fed’s holdings of Treasuries has declined by $841 billion (Fig. 6). In effect, QT has widened the consolidated federal deficit of “T-Fed” by that amount over that period. The Fed is on pace to continue to reduce its holdings of Treasuries by $60 billion per month.
The Fed’s QT program has put downward pressure on the demand deposits of the commercial banking system. So the banks stopped increasing their holdings of US Treasury and agency securities when QT started. Instead, they’ve been letting them mature and using the funds to offset the weakness in their deposits (Fig. 7 and Fig. 8). The banks’ holdings of Treasuries and agencies is down $554 billion from the week of June 1, 2022 through the September 27 week. (There’s no data for just Treasuries held by the banks.)
While the Fed and the banks have been letting their Treasury and agency securities mature without rolling the proceeds into more securities, foreign private investors added $755 billion to their portfolios of US Treasuries over the 12 months through July (Fig. 9). That’s the latest available data from the US Treasury International Capital System (TICS). There’s no evidence in the TICS that foreign central banks and other official institutions have been major sellers of US Treasuries, on balance, as widely feared. From 2015 to 2020, they were mostly selling, but they haven’t done much buying or selling since then.
(5) Why are foreign bond yields also soaring? By the way, the supply-demand imbalance theory has been disputed by economists who observe that yields have also soared overseas, where fiscal profligacy isn’t as much of a concern as in the United States (Fig. 10 and Fig. 11). That’s true, but the bond market is a global one, and yields overseas tend to follow the path of comparable US yields.
(6) The bottom line. The question is whether the backup in the bond yield is enough to attract enough demand from domestic and foreign individual and institutional investors to boost demand for the increased supply of demand. We think so. So we expect that the bond yield can stabilize between 4.50% and 5.00% through the end of this year into next year.
That’s mostly because we expect that inflation will continue to moderate. We also think that the Fed is done raising the federal funds rate (FFR), especially after two Fed officials acknowledged on Monday that the recent surge in the bond yield might have mitigated the need for any additional FFR hikes given that the bond market has done all the heavy lifting in the fixed-income market recently.
(7) Stress tests ahead. The next auctions of the 10-year and 30-year Treasury bonds will be on Wednesday and Thursday. September’s PPI and CPI will be released on Wednesday and Thursday. We will be looking at the bid-cover and foreign participation stats for both auctions for indications that yields are high enough to stabilize the bond market.
Stocks: MegaCap-8 a Bigger Share of the S&P 500 Despite Valuation Decline. The MegaCap-8 group of stocks (i.e., Alphabet, Amazon, Apple, Meta, Microsoft, Netflix, Nvidia, and Tesla) currently accounts for a record-high 27.4% of the S&P 500’s capitalization and has led the index higher in a big way so far in 2023 (Fig. 12). The stocks’ performances this year in part reflect much improved revenues and earnings growth prospects for most of the eight companies.
However, the MegaCap-8’s valuation has pulled back since July amid stock investors’ angst over the bond market after Fitch Ratings downgraded US federal debt on August 1. The eight stocks’ collective market cap has shrunk accordingly. However, their share of the composite index’s market cap has increased, as they weren’t the only stocks to take valuation hits after Fitch’s downgrade (Fig. 13).
Currently, the group’s collective valuation is higher than when the year began, but it is substantially lower than it was during 2020-21, when the MegaCap-8’s forward P/E flirted with 39 (Fig. 14). We don’t expect a return to those heady valuations anytime soon. However, the Mega-Cap-8’s valuation has held up slightly better than the collective valuation of the S&P 500 companies in recent months. Supporting the MegaCap-8’s valuation have been earnings—mostly strong Q2 results and even stronger y/y growth results expected for Q3.
I asked Joe to update us on the MegaCap-8. Here’s his report:
(1) Market capitalization. The combined market cap for the MegaCap-8 stocks tumbled 41.5% in 2022 before rebounding 66.8% ytd to an 18-month high of $11.8 trillion through July 18. Since then, it fell 9.1% in a near-correction to $10.7 trillion on September 26 before rising 4.9% through Friday’s close. That leaves the group up 58.9% ytd compared to a 12.2% gain for the S&P 500 (Fig. 15).
Following their deep bear market decline of 45.0% through January 5, the MegaCap-8 stocks have now improved to 9.0% below their peak back on December 27, 2021. If their collective earnings expectations continue to improve faster than the rest of the market’s, as we expect, the group’s combined market cap may be on the road to new highs despite lower valuations.
(2) Market-capitalization share at a record high, again. As a percentage of the S&P 500’s market cap, the group was at new record-high of 27.4% during the October 6 week. Its market-cap share had soared from 19.4% at the start of the year to a then-record-high 27.3% during the July 14 week, before dropping to a low of 26.0% during the August 18 week.
(3) Valuations slipping amid higher rates. The MegaCap-8’s forward P/E rose above 30.0 in mid-June for the first time in 15 months but has since dropped below that mark, as investor activity has not maintained the group’s valuation despite strong Q2 earnings and upwardly revised forecasts for the future. After the forward P/E bottomed at 21.1 during the January 6 week, it soared 46% to its 2023 high of 31.2 as of the July 14 week. The forward P/E is now down 13% since then to 27.0 as of the October 6 week, which remains below the record high of 38.5 during the August 28, 2020 week.
Looking at the individual MegaCap-8 stocks, forward P/Es rose for all of them from January 6 through mid-July, before correcting along with the rest of the S&P 500’s collective valuation amid bond market’s turmoil. Illogically though, the growthier MegaCap-8 has dropped just 3.3% since the market’s July 31 high, less than the 5.5% decline for the S&P 500 through Monday’s close. While five of the MegaCap-8 stocks now—as of Friday’s close—are valued above their January 6 bottoms, all have declined since the end of July, as Joe shows below.
Here’s how much valuation has changed for each of the MegaCap-8 stocks since the S&P 500’s July 31 high through Friday’s close: Nvidia (down 38% to 29.8 from 48.4), Amazon (down 30% to 42.8 from 60.9), Netflix (down 16% to 25.8 from 30.6), Apple (down 11% to 26.7 from 30.2), Meta (down 11% to 19.5 from 21.9), Microsoft (down 6% to 28.4 from 30.3), Tesla (down 3% to 61.5 from 63.7), and Alphabet (down 2% to 21.1 from 21.6) (Fig. 16).
The sharp valuation declines for Nvidia and Amazon come despite sharply increased forward revenues and earnings guidance relative to their MegaCap-8 cohorts, but that likely reflects investors taking some of their ytd gains off the table. Nvidia’s stock had tumbled 16.9% through September 21 from its August 31 record high, but has since risen 10.4% through Monday’s close to a ytd gain of 209.8%. (FYI: Forward revenues and earnings are the time-weighted averages of industry analysts’ estimates for the current year and following one.)
While Nvidia’s forward earnings are at a record high now, Amazon’s remains challenged. Its forward EPS, though up 82% ytd, remains 9% below its record high in July 2021, and Amazon’s stock price reflects that. It tumbled 55.7% from its November 18, 2021 record high to its bottom on December 28, 2022, and remains in a deep 30.6% bear market through Monday’s close.
(4) Reviewing the MegaCap-8’s y/y forward revenues and earnings performance. Seven of the MegaCap-8 companies have enjoyed both rising forward revenues and rising forward earnings so far in 2023 (Fig. 17 and Fig. 18).The only laggards are Apple’s forward revenues and Tesla’s forward earnings. As a group, the MegaCap-8’s forward revenues has jumped 7.3% y/y, and its forward earnings has soared 17.2%—trouncing the S&P 500’s forward revenues rise of 4.3% ytd and forward earnings gain of only 4.7% ytd.
Here’s how each of the MegaCap-8 companies’ forward revenues and earnings forecasts has performed y/y: Alphabet (forward revenues up 5.1%, forward earnings up 12.7%), Amazon (6.6, 55.1), Apple (-1.3, 2.2), Meta (14.8, 51.3), Microsoft (6.6, 7.7), Netflix (11.1, 38.5), Nvidia (150.4, 263.5), and Tesla (2.6, -24.5). Nvidia’s surge in such a short period on expectations for AI chip sales is stunning, and certainly ranks among the all-time top performers (i.e., since consensus forecasts were first calculated over 40 years ago).
(5) Forward profit margins improving broadly. The S&P 500’s forward profit margin—which we calculate from forward earnings and revenues—dropped when this year began, from 12.6% at the beginning of January to 12.3% during the March 30 week, but since has recovered all of that decline, clocking in at 12.6% during the September 28 week. The MegaCap-8’s collective margin has surged from 18.0% at the year’s start to 20.8% at September’s end, with 1.5ppts of that gain coming since the Q2 earnings season started. Among the MegaCap-8s, all but Tesla have seen their forward profit margins rise ytd: Alphabet (up from 23.0% to 25.8%), Amazon (3.0 to 4.9), Apple (25.2 to 26.6), Meta (21.1 to 29.8), Microsoft (34.6 to 35.0), Netflix (14.1 to 17.8), Nvidia (36.7 to 51.3), and Tesla (15.9 to 12.4) (Fig. 19).
It can be disconcerting for investors when valuations disconnect sharply from a company’s earnings prospects. But opportunistic entry points are available for investors who take their cues from the profit margins implied by analysts’ revenue and earnings expectations, considered in the context of past levels.
Finally, we would add that, while higher bond yields tend to weigh on the valuations of Growth stocks more than on those of Value stocks, investors may be buying the MegaCap-8 because their exposure to rising bond yields tends to be less than that of many companies, having relatively less debt exposure.
Reassessing Recession Risk
October 10 (Tuesday)
Check out the accompanying pdf and chart collection.
Executive Summary: The prospects of a prolonged war in the Middle East heighten the chance of a recession in the US. That’s not our base-case outlook, but we are raising the odds we see of a recession before year-end 2024 to 30% from 25%. The other 70% represents the rolling recessions/recoveries scenario we expect to continue; it’s tough to envision a recession when consumers have the support of such a robust labor market. … But our worry list has expanded with the recent addition of a potential debt crisis and now the escalation of Middle East hostilities. Additionally, we’re monitoring the banking industry for any sign of an emergent credit crunch.
Weekly Webcast. If you missed Monday’s live webcast, you can view a replay here.
Worry List I: New Worries & Unchanged Hopes. We are raising our odds of a recession before year-end 2024, though that’s still not our base-case outlook. Our subjective probability of a recession is now 30%, up from 25%. We raised it from 15% to 25% on September 18.
The September increase reflected our new concern about a US debt crisis attributable to the widespread recognition that US federal government deficits are too d@mn wide. Today’s increase reflects a new concern: the start of the latest war in the Middle East on Saturday. This one isn’t likely to lead to a quick ceasefire between Israel and Hamas, as occurred in the past, because it is in fact a war between Israel and Iran. For Israel, it is existential. This time, Israel’s goal is to wipe out Hamas, which is Iran’s surrogate in Gaza. The war is also existential for Iran’s mullahs, who need it to distract the population from discontent over their authoritarian regime by moving forward on their machinations to wipe out Israel.
Our base case remains a rolling recession with rolling recoveries, now with a 70% subjective probability. The economy-wide recession scenario has been based on the widely held view that the Fed’s aggressive rate hiking combined with quantitative tightening since early last year would trigger a credit crunch and a recession. Lending credence to that forecast have been the inversion of the yield curve and falling leading indicators. However, the Godot recession has been a no-show so far because the economy has proven remarkably resilient in the face of rolling recessions that have rolled through the single-family housing and retailing industries. There was a banking crisis in March, but the Fed contained it quickly.
Meanwhile, the labor market remains strong, as evidenced by the latest payroll employment and job openings reports (Fig. 1). Consumer spending has held up very well thanks to record-high employment (Fig. 2). The Atlanta Fed’s GDPNow tracking model is currently forecasting that real GDP rose 4.9% (saar) during Q3, led by a 3.7% increase in consumer spending.
While the Index of Leading Economic Indicators is down 10.5% since it peaked on December 2021 through August of this year, the Index of Coincident Economic Indicators (CEI) rose to new record highs during that period (Fig. 3). Payroll employment is one of the four components of the CEI (Fig. 4). It is the first one of them that is reported at the beginning of every month and tends to predict the other three. We’ve said it before: It’s hard to have a consumer-led recession when payroll employment is rising to record highs month after month.
Nevertheless, let’s discuss the latest risks to this happy outlook to explain why we’ve ratcheted up our odds of a recession.
Worry List II: Debt Crisis. The potential for a debt crisis became apparent after Fitch Ratings downgraded US Treasury debt from AAA to AA+ on August 1. Fitch’s reasons for doing so were well known; however, the downgrade suddenly brought the deficit issue to the fore.
I’ve often said that I will care about the deficit issue when the financial markets care about the issue. They clearly care now. So does the financial press, which has been running lots of stories about the unmanageable size of the deficit now and in the future. And most importantly, the Bond Vigilantes seem to have saddled up and formed a posse of rough riders aiming to bring law and order back to fiscal policy. Consider the following:
(1) Bond yield soaring too much. The 10-year Treasury bond yield was 3.97% on July 31. Following the Fitch downgrade, it soared to 4.78% on Friday (Fig. 5). The 30-year Treasury yield rose from 4.02% to 4.95% during this same period. Both are back to their Old Normal levels, i.e., where they were from 2003 to 2007, which preceded the “New Abnormal” period from 2008 to early 2022, i.e., from the Great Financial Crisis through the Great Virus Crisis.
We still expect that the 10-year Treasury bond yield will settle around the Old Normal range of 4.50%-5.00%. That will happen only if inflation continues to moderate, as we’ve been predicting. Inflation is turning out to be relatively transitory after all, in our opinion. As we’ve noted previously, the headline and core CPI inflation rates excluding shelter rose just 1.9% and 2.2% y/y through August (Fig. 6). We know that rent inflation is heading lower in coming months (Fig. 7).
(2) Yield curve disinverting the wrong way. Meanwhile, the yield-curve spread between the 10-year and 2-year Treasury notes has narrowed significantly from a recent low of -108bps to -30bps on Friday (Fig. 8). Does a disinverting yield curve signal that a recession is now less likely?
In the past, yield-curve inversions disinverted during recessions when the Fed cut interest rates to revive economic growth. Short-term rates fell faster than long-term rates. This time, the 10-year Treasury bond yield is rising faster than the 2-year yield. If that continues, the chances of something breaking in the credit markets will increase. If something breaks, it could precipitate a credit crunch and a recession.
(3) Dalio’s debt crisis. Our baseline scenario requires that the bond yield is now high enough to equilibrate the supply and demand for Treasury securities without causing a recession. The “immaculate disinflation” (i.e., without a recession) that we expect should facilitate such an equilibrium. We will be watching the Treasury’s bond auctions in coming months, along with everyone else, to see whether the bond yield is stabilizing or needs to go higher to clear the Treasury market’s supply.
If the auctions are sloppy, yields will continue to rise above 5.00%. That would increase the odds of Ray Dalio’s debt crisis scenario in which the yield rises to levels that crowd out demand for the private sector’s debt, triggering a financial crisis, credit crunch, and a recession (see our October 4 Morning Briefing).
Worry List III: Geopolitical Crisis. The debt crisis scenario is a relatively new worry for the markets and for us. We all started to worry about it this summer, as noted above, especially after the 10-year Treasury bond yield jumped above last year’s high of 4.25% on August 16.
The new worry is that the war that broke out on Saturday between Hamas, Iran’s proxy in Gaza, and Israel will widen and be prolonged. That would be the case if Hezbollah, Iran’s proxy in Lebanon, enters the war.
It’s unlikely that the result will be a direct confrontation between Iran and Israel, but that scenario isn’t out of the question. More likely is that the Biden administration will tighten sanctions on Iran’s oil exports, which plunged 1.6 million barrels per day during the Trump administration and rose 0.6 mbd during the first three years of the Biden administration (Fig. 9).
The tightening of sanctions on Iran oil could cause oil prices to spike above $100 a barrel, which could trigger a worldwide recession. More likely is that Saudi Arabia would increase its production and exports to keep the price of oil below $100 a barrel. Producers just recently learned that the 23% increase in the price of a barrel of crude oil during Q3-2023 immediately depressed oil demand, especially gasoline usage in the US (Fig. 10).
Worry List IV: US Credit Risks. Of course, we continue to monitor the weekly commercial bank data compiled by the Fed for signs of a bank-led credit crunch. The latest data show slowing growth in loans but not a sudden credit contraction:
(1) Here are the y/y growth rates of the major bank loan categories through the September 27 week and their recent peaks either last year or earlier this year: commercial & industrial (C&I) loans (0.4%, 15.0%), residential real estate (5.2, 10.2), commercial real estate (6.8, 13.5), and consumer loans (5.2, 12.8) (Fig. 11).
The most notable slowdown is in C&I loans. Last week, we attributed this development to a lack of demand to finance inventories as a result of the rolling recession in the goods sector. So the weakness reflects a weakening of credit demand rather than a tightening of credit supply.
(2) We are on high alert for a credit problem in commercial real estate. Here, too, we are seeing a slowdown; but we are certain it is heading for a credit crunch as long as bond yields remain high or go higher (Fig. 12). Interestingly, commercial real estate loans secured by multi-family properties are up 14.4% y/y through August, but that’s down from a red-hot peak of 27.7% during December 2022.
(3) We are also monitoring provisions for loan losses at the large and small banks (Fig. 13). They have been rising for both, but not in an alarming fashion.
Consumers: Hotter For Longer
October 9 (Monday)
Check out the accompanying pdf and chart collection.
Executive Summary: Today, we challenge another aspect of the hard landers’ narrative: the notion that consumers will retrench, leading the broad economy into a recession. True, many consumers must resume paying the student-debt piper soon, and many have depleted their excess pandemic saving. … But bigger forces are supporting consumer spending: Consumers simply don’t halt the spending they love to do when their incomes are secure and growing, as now, with wages rising and plenty of jobs to go around. And it’s retired Baby Boomers’ time to kick back and spend their ample nest eggs. … Also: Dr. Ed reviews “The Sixth Commandment” (+ +).
YRI Weekly Webcast. Join Dr. Ed’s live webcast with Q&A on Mondays at 11 a.m. EST. You will receive an email with the link one hour before showtime. Replays of the weekly webcasts are available here.
US Consumers I: The Quick Employment Theory. On Friday, after September’s employment report was released, CNBC’s ace anchor Becky Quick suggested that the unexpected surge in payrolls might indicate that more people are going back to work because they are running out of the excess saving they accumulated during the pandemic. That’s a refreshingly optimistic insight.
The widely held pessimistic view has been that once consumers run out of their excess saving, they will have to retrench. The resumption of student loan payments will cause consumers to cut back, according to this glum view. And of course, tighter lending conditions will force consumers to buy less on credit, as evidenced by rising consumer credit delinquencies. In other words, a consumer-led recession is coming and probably sooner rather than later. JP Morgan Chase Chairman and CEO Jamie Dimon has been an especially vocal proponent of this scenario since May 2022.
Debbie and I have been among the optimists on the outlook for consumer spending. We’ve observed that it’s hard to have a consumer-led recession when employment is rising and real wages are trending higher. We’ve countered the excess saving story with our own story about the massive retirement saving accumulated by the Baby Boomers.
We are members of this cohort. While we are still working, many of our friends are retiring and starting to spend their nest eggs. They are spending less on goods and more on services like restaurants, airlines, hotels, and health care providers. All of these are labor-intensive service-providing industries that have been scrambling to add workers to accommodate the booming demand for their services, especially from Baby Boomers.
That’s how we’ve explained the resilience of the consumer. If the trend in real disposable incomes remains upward, consumer-led growth should continue to fuel gains in GDP.
What should the Fed do, considering the resilience of payroll employment? Nothing! Wage inflation continued to moderate during September despite the strength in employment and the low unemployment rate. Meanwhile, the 10-year bond yield has jumped by 43bps since the FOMC met on September 19-20. The bond market has tightened for the Fed. Any more tightening by the Fed risks causing a credit crunch and a recession, which clearly isn’t necessary to bring inflation down. That’s because inflation is turning out to be a transitory pandemic-related phenomenon after all, as we have been suggesting.
By the way, Sunday’s WSJ features an article titled “The U.S. Economy’s Secret Weapon: Seniors With Money to Spend.” It is subtitled: “Americans 65 and older account for record share of spending and are less susceptible to interest rates.” Debbie, Melissa, and I have been making the same points since the summer. See for example, our June 26 Morning Briefing titled “Baby Boomers Retiring On $75 Trillion In Net Worth.”
US Consumers II: Born To Shop. We’ve often observed that Americans go shopping when they feel good. When they feel bad, they go shopping too because it releases dopamine in their brains, which makes them feel better. They always feel bad during recessions, but not as many have the income to shop away their troubles, especially if they have lost their jobs. In the current situation, consumers feel relatively bad, but the labor market is running hot. So they have jobs and can go shopping to make themselves feel better, if not great.
From this perspective, let’s review that latest batch of relevant consumer indicators:
(1) Confidence. Debbie and I track the Consumer Optimism Index, which we construct by averaging the Consumer Sentiment Index and the Consumer Confidence Index (COI) (Fig. 1). The overall index was 85.6 in September. That’s up from last year’s low of 73.4 during July. But it is still around the low readings that preceded past recessions. Similar observations apply to the current conditions and expectations components of the COI.
Consumers should be less miserable than they were last year because the Misery Index is down from a peak of 12.7 during June 2022 to 7.5 in August (Fig. 2). The index is the sum of the unemployment rate and the headline CPI inflation rate on a y/y basis (Fig. 3).
(2) Earned income proxy. Our Earned Income Proxy for private industry wages and salaries in personal income rose 0.4% m/m to another record high in September (Fig. 4). Aggregate hours worked and average hourly earnings each edged up 0.2% (Fig. 5).
The increase in aggregate hours worked was attributable to the 0.2% increase in payroll employment, while the average workweek was unchanged (Fig. 6). Payroll employment was revised higher in both July and August by a total of 119,000 (Fig. 7). Over the past three months, payroll employment is up 799,000, or 266,300 per month on average.
(3) Real income & spending. Inflation-adjusted consumer spending tends to grow at a relatively steady pace during economic expansions (Fig. 8). It naturally follows the upward trend of real disposable personal income (DPI), which is somewhat more volatile. During H2-2021 and H1-2022, the two diverged as real DPI fell while real consumer spending rose. The former was depressed by rapidly rising prices, while the latter was boosted by the spending of the saving accumulated during the pandemic.
Since mid-2022, real DPI has been trending higher, while consumption has continued to grow. The strength of the labor market should continue to support consumer spending.
US Consumer III: Disinflating Wages. Average hourly earnings (AHE) for all private industry workers fell to 4.2% y/y in September, down from last year’s peak of 5.9% and the lowest since June 2021 (Fig. 9). The three-month change was down to 3.3% (saar) through September, the lowest since March 2021. Fed Chair Jerome Powell frequently has said that wage inflation closer to 3.0% would be consistent with price inflation falling to the Fed’s target of 2.0%.
Here is the performance derby of major industries’ AHE in September on a y/y change basis compared with their peak rates in 2021, 2022, or 2023: natural resources (5.6, 7.1), construction (5.1, 5.9), leisure & hospitality (4.7, 14.0), utilities (4.6, 6.6), transportation & warehousing (4.4, 7.0), professional & business services (4.3, 7.1), retail trade (4.2, 6.7), education & health service (3.2, 7.3), and information services (0.9, 7.7) (Fig. 10).
The biggest declines in inflation from industries’ most recent peaks have occurred in leisure & hospitality (-9.3ppts), information services (-6.8), and education & health services (-4.1), professional & business services (-2.8), and transportation & warehousing (-2.6).
US Consumers IV: Lots of Jobs. The Godot recession is still MIA. Payroll employment is one of the four components of the Index of Coincident Economic Indicators. It rose to a record high in September. There’s no sign of a recession in the payrolls of the major industries. The following rose to record highs in September: wholesale trade, hospitals, ambulatory health care services, social assistance, construction, financial activities, and food services & drinking places, and educational services.
Movie. “The Sixth Commandment” (+ +) (link) is a British docudrama series based on the murders of Peter Farquhar and Ann Moore-Martin by Ben Field. Field was a fiend who preyed on two lonely elderly people by pretending to be in love with them. His motive was to get them to rewrite their wills to his benefit. He pretended to be a religious and caring young poet but was actually a cold-blooded embodiment of Hannah Arandt’s concept of the “banality of evil.”
Copper, Travel & AI
October 5 (Thursday)
Check out the accompanying pdf and chart collection.
Executive Summary: Investors worried about US inflation might want to take a look at copper prices, which have fallen ytd. Copper faces gleaming long-term fundamentals, with global demand poised to soar as the EV and other electrification markets take off. But the commodity’s recent price action has been dulled by investors’ economic pessimism. … Also: Jackie examines what’s been grounding the stock price indexes of most travel-related industries. … And: AI’s transformative reach extends way beyond OpenAI and Bard. A look at some startups’ popular AI offerings.
Materials: Mixed Signals. Fears of inflation and growing supply have sent Treasury bond yields up to levels not seen in more than 15 years. The price of copper, however, is not signaling any concerns about inflation or overheated economic growth. The price of the industrial metal was down 0.6% on Tuesday; it fell 0.8% during Q3 and 4.7% ytd through Tuesday’s close (Fig. 1). At a recent $3.62, the price of copper is below its 2022 high of $4.93 in March but well off its 2020 low of $2.12.
Copper prices typically move in lockstep with global economic activity. The copper market’s recent torpor likely reflects the depressed Chinese real estate market, a European economy that is teetering on recession, and rising interest rates that should slow US economic growth. The strong dollar isn’t helping (Fig. 2). And investors seem unmoved by offsetting factors that are bullish for copper demand over the long term, such as booming production of electric vehicles (EVs) and meager new copper production hitting the market.
Let’s take a closer look at what’s keeping copper prices so subdued:
(1) Inventories piling up. Last month, copper inventories in London Metal Exchange (LME) registered warehouses were at their highest levels since May 2022, an October 2 article at Oilprice.com reported. Copper stocks held there have more than doubled in the past two months. The article also noted that the LME copper futures curve was in extreme contango, with copper’s three-month futures price trading above the cash price.
(2) China’s property market weighs. Near term, there’s concern about Chinese economic growth. Some of China’s largest real estate developers continue to struggle to make debt payments, and many have thrown in the towel and filed for bankruptcy protection. The sector’s woes mean less property will be purchased for development from municipalities, which pinches their budgets. Meanwhile, lower home prices are hurting consumers and worries about bad property loans cloud the future of Chinese banks.
China’s real GDP rose 6.3% y/y in Q2, but it fell 1.7% (saar) q/q (Fig. 3). And the MSCI China share price index is down 10.5% ytd (Fig. 4).
(3) Bright future. Analysts remain optimistic about the future of copper prices because there’s little in the way of new capacity being built in the industry and demand should rise with the growing number of EVs being built along with other areas of electrification.
The world’s going to need two times as much copper over the next 30 years as it needed over the last 30 years, BHP CEO Mike Henry told CNBC on September 27. Meanwhile, the commodity is getting harder to find, what’s found is of lower quality, and old and new mines face tough environmental, social, and governance (ESG) requirements.
Bringing a new mine online takes time, effort, and money. “For the 127 new mines opened globally between 2002 and 2023, it took an average of 15.7 years after discovery to get to commercial production, although actual figures ranged from six to 32 years,” an October 3 WSJ article reported, citing S&P Global Market Intelligence data. Given the long road, some companies are opting to reopen closed mines, which can be slightly faster.
Running mines once they are opened is expensive too. In the 12 months through June, BHP’s output costs rose roughly 9%, and they are now higher than they were before the pandemic, a September 28 WSJ article reported. Beyond just operational costs, miners are paying fatter royalties to foreign governments and paying for offsets to their carbon emissions. Given the increases in the industry’s project costs and rising wages, Morgan Stanley analysts raised their real long-run price forecasts for copper, lithium, and other mined commodities, the WSJ article noted.
(4) The S&P 500 Copper stock price index only has one member, Freeport-McMoRan, which mines gold and molybdenum in addition to copper. Industry analysts have been modestly optimistic about the industry’s revenue, with forecasts of 1.9% growth this year and 6.2% growth in 2024 (Fig. 5). While earnings are expected to fall 31.0% this year, they’re expected to rebound and grow 26.4% in 2024 (Fig. 6).
So far, the industry’s stock price index isn’t betting on that earnings rebound. It’s down 4.4% ytd and down 18.6% from its July 31 summer high (Fig. 7). Perhaps that’s because net earnings revisions have been decidedly negative for six months; they came in at -16.3% in September (Fig. 8). At 18.1, the industry’s forward P/E is in between its typical lows when earnings are strong and its typical highs when earnings are low (Fig. 9).
Consumer Discretionary: Has the Travel Itch Been Scratched? This summer, travel-related stocks were on a tear, as it seemed that everyone was jetting off somewhere. Personal spending on air transportation was at an all-time high in August, and spending at hotels and motels was near record levels (Fig. 10). We wondered how long the investor enthusiasm could continue given three looming risks: higher oil prices, higher wage-related expenses, and excessive bullishness. A little less than three months later, travel-related industries’ stocks have fallen sharply.
The S&P 500 Casinos & Gaming industry stock price index has fallen 24.5% from its July 31 high. The S&P 500 Passenger Airlines industry’s index has nosedived 30.3% since its July 11 high. And the stock price index for the S&P 500 Hotels, Resorts & Cruise Lines industry has dropped 8.4% since July 31, a touch more than the S%P 500’s 7.8% drop over the same period (Fig. 11 and Fig. 12).
Here’s a look at the forces that have weighed on these travel-related stock price indexes since we last discussed them, in our July 13 Morning Briefing:
(1) Fuel prices take a toll. Production cuts by OPEC+ have sent the price of Brent crude oil futures up 27% from their low this year, and that’s causing turbulence for transportation companies of all stripes (Fig. 13).
Cruise line operator Carnival lowered its Q2 guidance because higher fuel prices and the stronger dollar are sinking results. The company warned last week that it expects a Q4 loss of between 10 cents to 18 cents a share even though occupancy rates have finally rebounded to 2019 levels, a September 29 Barron’s article reported. Analysts responded by lowering their estimates for the quarter to a loss of 13 cents a share, down from the loss of eight cents a share they expected three months ago.
(2) Wages flying higher. Many of the travel companies’ employees are members of unions that have demanded higher wages, successfully. Most recently, United Airlines’ pilots approved a new contract that includes pay raises of as much as 40% over the course of four years. That follows Delta Air Lines pilots’ new contract struck in March, which gives them 34% pay raises over four years. And American Airlines pilots’ contract grants wage increases of 46% over four years.
Higher labor costs and fuel expense led American Airlines to slash its Q3 adjusted earnings forecast last month to 20-30 cents a share from 85-95 cents previously, a September 13 Barron’s article reported.
(3) Falling prices for the holidays. Very early data about holiday travel indicates that “revenge travel” may have run its course. While it’s still early for holiday air bookings, most prices for holiday air travel and car rentals are down y/y even though both Christmas and New Year’s fall on weekends. For Thanksgiving travel, airfares are 14% lower and car rentals 17% lower than last year, an October 2 USA Today article reported. For Christmas, domestic flights are 12% cheaper than in 2022, but fares to many international locations are higher by mid-single-digit percentages.
Even Disney has resorted to lowering prices after seeing a slowdown in park attendance. Tickets for Disneyland can be purchased for as low as $50 each if used between January 8 and March 10, CNBC reported yesterday. And at Disney World, children’s tickets and dining plans will be half-off for those who purchase a four-day, four-night package at Disney resorts for use from March 3 through June 30.
Looking ahead, two groups of travelers could bolster travel stocks’ fortunes if they take to the skies in sufficient numbers: If business travelers return to their road warrior ways or if Chinese tourists decide to visit the US of A, travel stocks could improve. Otherwise, the stocks will be facing tough y/y comparisons over the next year.
(4) A look at earnings. The rate of earnings growth expected for some travel-related industries has been dropping in recent weeks and months, as analysts have been trimming their earnings estimates for the industries’ constituent companies.
The S&P 500 Passenger Airlines industry’s expected 2023 earnings growth has fallen to 150.7% from the high triple-digit percentages projected in March 2022. Looking into next year, the industry’s projected earnings growth has descended to 13.0% from an estimate of 38.0% about a year ago (Fig. 14).
The S&P 500 Casinos & Gaming industry’s earnings for 2024 have been revised downward sharply. In January 2023, earnings for 2024 were expected to grow by 177.4%, but now those earnings are expected only to inch up by 4.9% (Fig. 15).
The earnings growth expected for the S&P 500 Hotels, Resorts & Cruise Lines industry has held up the best. Earnings are projected to soar in 2023 from a very small profit in 2022; for 2024, projected earnings growth has held relatively steady at 27.7% (Fig. 16).
Disruptive Technologies: Developers Embrace AI. OpenAI and Bard have captured the headlines about artificial intelligence (AI), but there’s also a slew of small developers, working in small startups, that are harnessing AI engines to provide various services to customers. OpenAI and Bard can write copy and answer questions, but these small developers have created programs with consumer-friendly interfaces that perform various specific tasks faster and better than ever before.
Let’s have a look at some of their most popular offerings:
(1) Everyone’s a writer. Companies like Surfer and Jasper are using AI to write everything from blog posts to SEO-optimized articles. This video explains how users can pick the keywords they’d like to appear in an article and the article’s tone of voice, and SurferAI will generate an outline. The user then approves or amends the outline before SurferAI writes the article. SurferAI will score the article on how well it’s optimized for Google searches, and it will show similar articles composed by competitors.
SurferAI uses Open AI’s technology along with its own “proprietary optimization algorithms.” Soon it hopes to provide users with links to the source information used to write the copy. Other AI writers of SEO-optimized copy include Frase, GrowthBar, Copysmith, Article Forge, Writesonic, Content at Scale, and KoalaWriter.
There are many “AI-powered” programs to help with marketing tasks, including Phrasee, Optimove, Instatext, Grammarly, Acrolinx, Smartwriter.ai, Zapier, and Hemingway App, according an April 8 article at AnalyticsInsight.net. Phrasee specializes in increasing the “brand language used by businesses in their copy to achieve its goals.” Optimove gathers data from a company’s many information platforms and presents it in one dashboard so that a business can better analyze it. Grammarly checks copy for grammar and spelling errors, and Instatext does the same in addition to improving the readability of sentences.
The question is whether these independent apps can survive as Microsoft and Google integrate their AI programs into Word and Docs.
(2) Smarter teaching apps. Dulingo is an app that for many years taught users a new language a little bit every day. The company came out with a new and improved app that harnesses GPT-4. Its new Explain My Answer function allows users to learn why they didn’t get an answer right. And its Roleplay function “lets you chat with an AI bot in your chosen language in guided simulations, complete with tips to help you on your learning journey,” an article at lifehacker.com reported.
Meanwhile, Socratic uses Google’s AI to help with high school and college level homework. Coursework covered includes algebra, geometry, trigonometry, calculus, biology, chemistry, physics, earth and environmental studies, US and world history, and literature.
(3) AI lends an ear. Woebot Health dates back to 2017 and aims to help users reduce symptoms of stress, depression, and anxiety. “AI allows Woebot to create that empathetic environment with great specificity to both patient and situation. As a rules-based conversational agent, Woebot does not generate its own sentences, but rather selects an appropriate evidence-based response crafted by the company’s team of writers and clinicians,” noted a September 11 article by Kai Patel, CEO of BrightInsight, a digital health platform for biopharma and medical device companies.
The responses sound relatively human-like. “Say, for example, that a patient has had a difficult argument with a family member. Rather than delivering a formulaic output—‘That sounds like a relationship problem’—Woebot responds with true empathy: ‘Family situations can be hard—especially at this time of year.’” The response builds a relationship with patients, letting them know they’ve been heard. That motivates patients to use the actual therapeutic tool, which leads them through exercises based on cognitive behavioral therapy, such as encouraging them to reframe negative thoughts.
(4) Helping the blind. Be My Eyes uses GPT-4 to help blind and low-vision people with daily challenges. Its Virtual Volunteer tool lets users snap a picture of their problem, and the AI can identify what’s occurring and try to help. It can take a picture of your refrigerator and tell the user what ingredients are available and how they could be used for dinner. If the bot can’t help, a sighted volunteer is called to help via a video chat.
The Debt Crisis Scenario
October 4 (Wednesday)
Check out the accompanying pdf and chart collection.
Executive Summary: Are we headed for a debt crisis? Demand for Treasury bonds has fallen in the wake of Fitch’s federal debt downgrade at a time when supply has been escalating. Rising yields in response may clear the Treasury market but also reduce both demand for and supply of the private sector’s credit. A credit crunch and recession could ensue, possibly setting off a deflationary debt default spiral. … But that worst-case scenario isn’t inevitable. The Treasury bond yield may not soar above 5.00%, as increasingly feared, given our expectations for “immaculate disinflation” (i.e., without an economy-wide recession) and slowing real GDP growth. … Also: Joe’s analysis suggests the S&P 500’s Q3 earnings may hit a record high.
Debt Crisis I: A Plausible Scenario? “We’re going to have a debt crisis in this country,” Ray Dalio, the founder of hedge fund Bridgewater Associates, warned in an interview with CNBC’s Sara Eisen that aired last Thursday. The two were speaking at a fireside chat at the Managed Funds Association. “How fast it transpires, I think, is going to be a function of that supply-demand issue, so I’m watching that very closely.”
Melissa and I referenced Dalio’s debt crisis scenario yesterday. It’s a simple plot that makes sense. We’ve been covering the story but haven’t concluded that it must end as badly as Dalio expects. Consider the following:
(1) Fiscal policy is out of control, as evidenced by the rapidly widening federal government budget deficit. Over the past 12 months through August, the deficit totaled $2.0 trillion, up from a recent low of $1.0 trillion through July 2022 (Fig. 1). It’s simple arithmetic: The trend in outlays is steeper than the trend in revenues (Fig. 2).
In the past, the federal budget deficit was counter-cyclical. As a percent of nominal GDP, it widened when the economy fell into recessions and narrowed during expansions (Fig. 3). As a percent of nominal GDP, outlays rose during recessions and fell during expansions (Fig. 4). Receipts tended to do the opposite of outlays.
So it is disturbing to see that outlays are rising while receipts are falling during the current economic expansion.
(2) It is widely assumed that the recent widening of the federal deficit is mainly attributable to the spending programs enacted by the Biden administration during 2022. In fact, the recent widening is mainly attributable to inflation, which has boosted federal government outlays on Social Security and net interest (Fig. 5).
Net interest totaled $634 billion over the past 12 months through August (Fig. 6). It has doubled since April 2021. It is the fastest growing of the federal government outlays categories (Fig. 7). We calculate that the federal government is currently paying about 2.50% on its outstanding debt held by the public (Fig. 8). The 2-year Treasury note is currently above 5.00%.
The biggest contributor to the bulging deficit in recent months has been a decline in individual income tax revenues during the current fiscal year after they were boosted last year when investors sold lots of their stocks that had capital gains during the 2022 bear market. They paid lots of capital gains taxes.
(3) Outlays will get boosted even more in coming years by all the spending Congress approved last year. In addition, the net interest expense of the federal government will continue to soar, as it has been doing ever since the Fed started raising interest rates aggressively in 2022.
(4) The Treasury supply issue came to the fore during the past summer, when the Treasury securities outstanding held by the public jumped by a whopping $1.4 trillion from June through August (Fig. 9). Fitch Ratings downgraded the federal debt from AAA to AA+ on August 1 on concerns about the mounting federal debt and the lack of political will in Washington to do anything to rein in the deficit. That announcement really marked the start of the Treasury bond market’s concern about too much supply relative to demand. The 10-year bond yield was 4.05% on August 1. Now it is almost 4.80%.
(5) So the bond market is adjusting yields upward to clear the market, i.e., to boost demand to meet the increased supply. The risk is that the market yield will crowd out the credit demands of the private sector. That would amount to a credit crunch, which would cause a recession.
In the debt crisis scenario, a recession attributable to excessive fiscal deficits would require the federal government to reduce spending and increase taxes, which would exacerbate the credit crunch and the recession. In a worst-case scenario, it could unleash a deflationary debt default spiral. In this scenario, the Fed might be forced to lower interest rates and to terminate its quantitative tightening.
Debt Crisis II: It Doesn’t Have To End Badly. Okay, now let’s come up for some air from these lower depths. So far, the Treasury bond yield has essentially normalized to the yield levels of 4.00% to 5.00% that prevailed from 2003 to 2007, before the “New Abnormal” (Fig. 10). That was the period from the Great Financial Crisis through the Great Virus Crisis, when the major central banks worried about deflation and obsessed about raising the inflation rate up to their 2.0% targets. During that period, interest rates were abnormally low and quantitative ease proliferated.
So far, the economy has proven remarkably resilient in the face of the three-year jump in the bond yield from a record low of 0.52% on August 4, 2020 to almost 4.80% currently. This raises the possibility that the economy can live with the bond yield back to its old normal level.
Then again, the velocity of the rate backup has been head-spinning, as it took only three years to fully reverse the decline in the bond yield during the 12 years of the New Abnormal. Depressing lagged effects on the economy are likely still to emerge. However, they might continue to play out as a rolling recession rather than an economy-wide recession. The rolling recession is currently rolling into the commercial real estate market.
What would it take to stop the Treasury bond yield from climbing well above 5.00% other than a deflationary debt debacle? Possibly the “immaculate disinflation” we expect. That is, we think inflation can continue to fall without an economy-wide recession. We also expect to see a slowdown from Q3’s consumer-led boomlet, with real GDP rising to between 4.0% and 5.0%. We think that Q4 real GDP growth will be back down to 2.0%. In this scenario, demand for Treasuries should absorb the supply with the yield south of 5.00%.
Be warned: If we see the yield soaring over 5.00%, we (along with everyone else) will have to conclude that Dalio’s debt crisis might have started.
Earnings I: Eyes Back on the Earnings Ball. There are plenty of questions about the outlooks for the economy and stock market floating around nowadays and few solid answers. One thing’s for sure: The stock market follows earnings and profitability over the longer term, both of which have been improving so far this year (Fig. 11).
In Monday’s QuickTakes titled The Wild Bunch, we wrote: “[W]e believe that the Q3 earnings season during October and early November will be much better than widely expected. After all, Q3’s real GDP is turning out to be well above consensus forecasts. Looking ahead to Q4, analysts are predicting that S&P 500 operating earnings per share (EPS) will be at a record high during the final quarter of this year. That’s barring a long auto strike, a government shutdown, and surprising credit losses at the banks.”
However, Joe’s analysis of the consensus EPS estimate data for S&P 500 companies in the context of historical trends suggests a very real possibility that record-high operating earnings could come sooner, i.e., during Q3. Here’s what he says:
(1) The case for record-high quarterly S&P 500 EPS as soon as Q3. As of the September 27 week, analysts polled by I/B/E/S are estimating that Q3 earnings will be $55.92. That represents only a 3.7% upside earnings surprise hook, which is historically low so could well turn out to be greater. Also, the latest Q3 consensus is below the record-high actual EPS of $57.62 recorded by I/B/E/S for Q2-2022. A surprise surpassing that prior record high appears easily attainable given the historical surprise patterns of the past (Fig. 12).
By the way, we have been forecasting that the S&P 500 would report record-high EPS of $58.00 for the quarter since last November, when we first initiated our forecast.
(2) More sectors could see record-high quarterly earnings in Q3 than in Q2. Let’s take a look at what analysts are expecting for the 11 S&P 500 sectors’ Q3 earnings as of September 29 to see which look bound for hitting record highs in quarterly earnings (using data from Q1-2009 to Q2-2023).
During Q2-2023, quarterly earnings hit record highs for two sectors, Consumer Discretionary and Industrials. That was an improvement from Q1-2023, when no sectors hit that mark; but it fell well short of the seven sectors several years earlier, in Q2-2021 (Fig. 13).
The current Q3-2023 consensus estimate for Utilities, if realized, would be a record high. While the estimates for Communication Services, Consumer Discretionary, and Consumer Staples are still 3%-4% below their past record actuals, even a modest earnings hook would propel them to new highs too in Q3-2023. So we think four sectors’ Q3 EPS will be at record highs. For Communication Services, Q3 would mark its first record high in quarterly EPS since Q4-2021.
Looking further ahead to Q4, the consensus currently expects record-high quarterly earnings for the S&P 500 and two sectors: Communication Services and Information Technology.
Despite the recent improvement in its earnings estimates, Energy still has a long way to go before surpassing its record level in Q2-2022. However, Energy’s recovery is now having a negative impact on the profit forecasts for the Airlines industry and the sector where it’s housed, Industrials.
While the remaining seven sectors currently don’t have record quarterly earnings forecast for Q4-2023, a continuation of this year’s upward estimate revision trend in response to the Q3-2023 earnings releases could propel many of them higher, possibly into the record-high realm (Fig. 14 and Fig. 15).
(3) Revisiting the S&P 500 sectors Q3 earnings growth outlook. S&P 500 companies’ collective earnings growth is expected to be positive y/y in Q3-2023 following declines in the prior three quarters. These are the S&P 500 sectors’ expected earnings growth rates for Q3-2023, on a proforma basis, versus their final earnings growth rates for Q2-2023: Communication Services (34.0% in Q3-2023 versus 15.7% in Q2-2023), Consumer Discretionary (23.0, 57.0), Utilities (12.4, 0.6), Financials (11.9, 9.3), Industrials (8.6, 15.7), S&P 500 ex-Energy (6.7, 3.6), Information Technology (5.9, 5.0), S&P 500 (1.6, -2.8), Consumer Staples (1.3, 8.5), Real Estate (-7.1, -2.1), Health Care (-9.7, -26.7), Materials (-20.5, -26.4), and Energy (-35.0, -47.5).
Earnings II: Revisiting S&P 500 Growth Prospects Ex Energy & MegaCap-8. In the September 27 Morning Briefing, we presented the Q2 actual results for S&P 500 companies’ collective revenues and earnings growth along with the Q3 outlook. We included the outlooks on an ex-Energy-sector basis as well as an ex-MegaCap-8 basis (i.e., excluding the stocks of Alphabet, Amazon, Apple, Meta, Microsoft, Netflix, Nvidia, and Tesla). We’ve been asked by accounts to update the S&P 500’s growth rates excluding both groups. Here’s what Joe found:
(1) Revenues growth. During Q2, the S&P 500 revenues growth rate was 1.2% y/y with both groups included; that improves to 4.6% without them. Energy’s revenues tumbled 28.9% y/y in Q2, while the MegaCap-8’s revenues rose 10.2%.
Looking ahead to Q3, S&P 500 revenues are expected to rise 0.8% with both groups included, which improves to 2.8% without them. Analysts expect Energy’s revenues to fall 22.5% y/y in Q3 and the Megacap-8’s revenue growth to accelerate to 11.1% y/y.
(2) Earnings growth. S&P 500 earnings fell 2.8% y/y in Q2 with both groups but rose 4.6% without them. Energy’s earnings tumbled 47.5% y/y in Q2, while the MegaCap-8’s earnings rose 29.7%.
A 1.6% gain is expected for the S&P 500 in Q3, but that improves to 2.8% without both groups. Analysts think Energy’s earnings will fall 35.0% y/y in Q3, but they expect the MegaCap-8’s earnings to soar 39.1% y/y.
The Bond Vigilantes Are On The March
October 3 (Tuesday)
Check out the accompanying pdf and chart collection.
Executive Summary: What moves the bond market has changed recently and disconcertingly. The 10-year Treasury bond yield’s recent action—and nonreaction to economic news that typically moves it—suggest a shift in bond investors’ focus from what monetary policymakers may do to rising alarm about what fiscal policymakers are doing. The worry is that the escalating federal budget deficit will create more supply of bonds than demand can meet, requiring higher yields to clear the market; that worry has been the Bond Vigilantes’ entrance cue. Now the Wild Bunch seems to have taken full control of the Treasury market; we’re watching to see if the high-yield market is next. We are still counting on moderating inflation to stop the beatings in the bond market.
Weekly Webcast. If you missed Monday’s live webcast, you can view a replay here.
The Wild Bunch I: Unrelenting Climb. The latest batch of economic indicators was weaker than expected. On Friday, we learned that real personal consumption expenditures rose just 0.1% during August. The core PCED edged up by only 0.1% during the month. September’s Consumer Sentiment Index fell 1.4 points to 68.1. As a result, the Citigroup Economic Surprise Index (CESI) fell to 45.1% from a recent high of 81.9% on July 27 (Fig. 1).
The 10-year Treasury bond yield should have declined on the news since its 13-week change tends to track the CESI closely (Fig. 2). Instead, the yield has continued to march higher, up to 4.70% on Monday morning. Most of the bond indicators that worked in the past haven’t been working for a while. For example, the bond yield was highly correlated with the ratio of the prices of copper to gold from 2005 through 2019 (Fig. 3). They’ve diverged significantly since then, with the ratio currently showing that the bond yield should be closer to 2.00% than to 5.00%.
The same can be said about the usually tight correlation between the bond yield and the M-PMI—i.e., they’ve decoupled (Fig. 4). The bond yield didn’t flinch to the downside when September’s M-PMI was reported Monday morning showing that the index remained below 50.0 for the eleventh consecutive month. Even the decrease in the M-PMI’s prices-paid index from 48.4 in August to 43.8 didn’t move the bond yield lower. The index suggests that the CPI goods inflation rate remained moderate last month (Fig. 5).
The Wild Bunch II: Disinverting. In the past, inverted yield curves provided strong buy signals for bonds. The 10-year US Treasury yield usually peaked at about the same time as the 2-year Treasury yield rose to match or exceed it (Fig. 6). That’s because bond investors started to anticipate that further hikes in the federal funds rate by the Fed were increasingly likely to cause a financial crisis, a credit crunch, and a recession. In the past, those expectations typically were met, forcing the Fed to lower interest rates as the economy tanked and inflation plunged.
The federal budget deficit widened during past recessions. But the increased supply of Treasuries was no problem, since private-sector credit demands dropped during those periods. So in the past, the balance between supply and demand in the Treasury market was not a significant issue for bond investors. Instead, they focused mostly on actual and expected inflation and the Fed’s actual and expected response to rising, falling, or stable inflation.
The yield curve has been disinverting since the 10- vs 2-year yield spread bottomed around -100bps in June. It was back up to -43bps on Monday. Perversely, now that the Fed seems to be on the verge of terminating its rate hiking, bond investors might have concluded that short-term rates aren’t high enough to cause a financial crisis, credit crunch, and a recession. There was a regional banking crisis in March, but the Fed provided a liquidity lending facility that contained the crisis quickly.
While the Fed’s restrictive stance of keeping the federal funds rate around the current level for longer might help to bring inflation down, the problem in the Treasury bond market is too much supply because of profligate fiscal policy. The supply problem has been exacerbated by the Fed’s quantitative tightening (QT) since last June. The Fed’s QT has depressed bank deposits (as have high interest rates on money market securities). So the banks have also stopped buying Treasury and agency securities and haven’t replaced their maturing securities. Consider the following:
(1) Since the start of QT in 2022, the Fed’s portfolio of Treasuries and agencies is down by $1,015 billion through the September 20 week (Fig. 7).
(2) The comparable portfolio held by commercial banks since the start of QT is down $544 billion through the September 20 week.
(3) We’ve previously observed that since the start of QT in 2022, the Fed’s Treasury bond holdings actually has increased, by $75 billion through the September 27 week. The Fed isn’t selling its Treasury bonds, as widely feared (Fig. 8).
The Wild Bunch III: High Yields. While the 10-year Treasury bond yield has increased by 81bps since the end of last year from 3.88% to 4.69% on Monday, the yield on US high-yield corporate bonds has been remarkably flat and stable around 9.00% (Fig. 9). So the yield spread between the latter and the former has narrowed, suggesting that credit conditions remain relatively easy, at least for high-yield corporates (Fig. 10).
While the Wild Bunch—a.k.a. the Bond Vigilantes—has wreaked havoc in the Treasury bond market, they’ve left the high-yield market alone. Could it be that some of them view the government’s securities as riskier than high-yield corporates? The result of their rampage in the Treasury market suggests as much.
Melissa and I are watching for signs that the credit market unrest unleashed by the Bond Vigilantes is spreading to the high-yield market.
The Wild Bunch IV: Uncharted. “We’re going to have a debt crisis in this country,” Ray Dalio, the founder of hedge fund Bridgewater Associates, warned in an interview with CNBC’s Sara Eisen that aired last Thursday. The two were speaking at a fireside chat at the Managed Funds Association. “How fast it transpires, I think, is going to be a function of that supply-demand issue, so I’m watching that very closely.”
Based on our analysis above, he may be right. The Wild Bunch has caused the Treasury bond market to fully reverse the drop in the 10-year bond’s yield from the Great Financial Crisis through the Great Virus Crisis in the past three years (Fig. 11).
We aren’t ready to join Dalio’s camp, yet. We still expect that inflation will continue to moderate, making bonds look even more attractive to investors. We suspect that Fed officials may soon be alarmed by the unyielding climb in yields. If they aren’t already, they should be. If a debt crisis becomes more apparent, the Fed probably would suspend its QT program to calm the situation.
Meanwhile, the current message of the Bond Vigilantes to fiscal policymakers in Washington is: “Take meaningful actions to reduce the federal deficit now and in the future or we will push the bond yield up to whatever level it takes to get you to do so!”
Some Good News & Not So
October 2 (Monday)
Check out the accompanying pdf and chart collection.
Executive Summary: Last week’s plentiful economic news netted out to support our optimistic economic outlook through next year, bringing more signs of improving productivity, surging investment in manufacturing, and manageable inventories. Last week also brought some mixed news and some outright bad news, but we still see a 75% chance of a soft-landing scenario with disinflation and a 25% chance of a hard landing. Longer term, we’re still convinced that improving productivity will set the stage for a “Roaring 2020s” decade. Nevertheless, for the here and now, we are worrying quite a bit about the Bond Vigilantes’ hostile response to profligate fiscal policy. ... And: Dr. Ed reviews “A Good Person” (+ +).
YRI Weekly Webcast. Join Dr. Ed’s live webcast with Q&A on Mondays at 11 a.m. EST. You will receive an email with the link one hour before showtime. Replays of the weekly webcasts are available here.
Good News I: Signs of Improving Productivity. There was lots of economic and financial news last week that mostly supports our optimistic economic outlook through the end of 2024. Debbie and I are still currently assigning subjective odds of 75% to a soft-landing scenario with immaculate disinflation (i.e., disinflation without a recession) and 25% to a hard-landing one.
We are also optimistic about the outlook for productivity growth over the rest of the decade. We still expect the decade will deserve to be called the “Roaring 2020s,” though we’ve acknowledged that it could also turn out to be a repeat of the Great Inflation of the 1970s. Our current subjective odds on the former versus the latter are 75% and 25%. Like the Fed, we will continue to assess the data to guide our odds-making.
Let’s start with the productivity story. As we’ve previously noted, there is a very good correlation between productivity and real hourly compensation growth, both on a 20-quarter percent change basis at an annual rate (Fig. 1). The standard of living as measured by consumers’ purchasing power is driven by productivity.
The boom-and-bust cycle in real hourly compensation growth is nearly identical to that of productivity growth. Their peaks and troughs tend to coincide in both timing and magnitude. There have been three productivity growth booms since the 1950s. There was a major bust in productivity growth from the mid-1960s through the early 1980s that coincided with the Great Inflation period (Fig. 2).
In our opinion, the latest productivity boom started during Q4-2015, when productivity growth troughed at 0.4% at an annual rate and rose to 1.4% during Q4-2019, just before the pandemic. The pandemic initially boosted productivity during the lockdowns then depressed it when quits soared. But now productivity is normalizing. It was back to 1.6% during Q2-2023.
Last week, the personal consumption expenditures deflator was up 0.4% m/m in August, above the 0.2% increase in average hourly earnings (of production & nonsupervisory workers) during the month. This measure of real wages stagnated last year but is up 0.9% since the start of this year through August (Fig. 3). It is back growing on its 1.2% upward trendline, which started in 1995. This can happen on a sustainable basis only if productivity is growing. What about August? The core PCED was up only 0.1%, just below the increase in the wage measure.
Another encouraging sign for our upbeat productivity story is that the S&P 500 profit margin seems to have bottomed during the first half of this year around 11.5%, not much below its record high of 13.7% during Q2-2021 (Fig. 4). Furthermore, the weekly series for the forward profit margin of the S&P 500 has been rebounding for the past 21 weeks through the September 21 week.
Good News II: Onshoring & Infrastructure Boom. Last week’s real GDP report caused one of the series that we’ve been following very closely recently to soar off our chart’s scale. It was fixed investment in manufacturing facilities (Fig. 5). It’s up 64.5% y/y through Q2-2023 and 74.9% since Q4-2019, just before the pandemic. That’s on an inflation-adjusted basis!
American and foreign manufacturing companies clearly are onshoring to the US. Supply-chain disruptions during the pandemic and growing geopolitical tensions between the US and China have stimulated the onshoring rush. So has a shortage of workers in China.
The onshoring boom and the federal government’s increased spending on public infrastructure are boosting new orders for construction machinery, which is up 8.4% y/y through July (Fig. 6). Onshoring and infrastructure investment also explain why construction employment rose to yet another record high of 8.0 million during August despite the recession in single-family housing starts (Fig. 7). Employment in heavy & civil engineering construction has been rising to record highs in recent months as well, at 1.1 million in August (Fig. 8).
There was one piece of bad news in the building trade two weeks ago. Multi-family housing starts plunged 26.3% m/m during August (Fig. 9). As we noted previously, that might have been a fluke or it might reflect that soaring commercial mortgage rates and disinflating rents are starting to depress the construction of rental housing, which may be facing a glut in some areas. That would be good news for our optimistic outlook for inflation. Meanwhile, the rolling recession in single-family housing starts may be bottoming (Fig. 10).
Good News III: Inventories Manageable. Thursday’s real GDP report showed that inventory investment remained close to zero during the first half of this year (Fig. 11).
That followed five quarters of significant unintended inventory accumulation, particularly by wholesale and retail distributors (excluding auto dealers’ inventories). That pileup occurred when inventories were depleted by consumers’ buying binge for goods during the pandemic years of 2020 and 2021. Retailers scrambled to order more merchandise, which jammed the ports and overloaded the trucking industry. By the time all the goods finally were delivered to distributors in 2022, consumers had pivoted away from binging on goods to purchasing a lot more services.
Now inventories seem to be more in line with demand. In current dollars, they’ve been flat since mid-2022, consistent with flat retail sales in current dollars (Fig. 12). So an inventory-led recession is less likely now.
Mixed News I: Corporate Cash Flow at a Record High. Thursday’s GDP report showed that after-tax profits as reported to the IRS fell 7.8% y/y during Q2-2023, but we think that might mark the bottom (Fig. 13). After-tax profits from current production fell 4.1% y/y over the same period. We refer to this series as “cash-flow profits” because it is adjusted for the historical cost basis used in profits tax accounting for inventory withdrawals and depreciation to the current cost measures used in GDP.
After-tax cash flow profits plus tax-reported depreciation edged up to $3.2 trillion (saar) during Q2-2023 (Fig. 14). This measure of corporate cash flow matched its record-high three quarters ago. This abundance of corporate cash flow following a very mild profits recession suggests that corporations have ample homegrown liquidity to avoid the adverse consequences of tightening credit conditions.
Mixed News II: Inflation Mostly Moderating. The bad news is that August’s PCED rose 0.4% m/m and 3.5% y/y. Excluding food and energy, it was up just 0.1% m/m but 3.9% y/y. We are especially encouraged to see that the headline and core PCED, both excluding rent, rose only 2.8% and 3.2% y/y through August (Fig. 15). We know that the rent inflation component of the PCED is heading lower based on indexes of current rents. On the other hand, the non-housing services component of the PCED has been stuck at a pace of around 4.5% y/y since late 2021 (Fig. 16). We expect that it will moderate along with wage inflation in the coming months.
Meanwhile, in July, there was deflation in the price deflators of goods sold by manufacturers (-4.1% y/y), wholesalers (-5.6%), and retailers (-0.3%) (Fig. 17). Such deflation is consistent with what occurred during past recessions. However, so far this time, the recession has been a rolling recession among goods producers and distributors rather than an economy-wide recession.
Mixed News III: Consumers Cooling. Consumers continued to spend more on services than on goods during August. The 0.1% increase in real personal consumption expenditures in August reflected an increase of 0.2% in spending on services and a decrease of 0.2% in spending on goods (Fig. 18). Within services, the leading contributors to the increase were transportation services (led by air transportation) and health care (led by hospitals and nursing homes). Within goods, the largest contributor to the decrease was motor vehicles and parts (led by new motor vehicles). We like these numbers because in our outlook consumer spending slows; it doesn’t fall.
Mixed News IV: Banks Lending Cautiously. Bank loans has stopped growing. The series is essentially unchanged over the past 18 weeks through the September 20 week. Over this same period, commercial & industrial (C&I) loans is down $99 billion. This sounds like bad news, but the other loans are up $74 billion collectively. In addition, the weakness in C&I loans reflects reduced demand because inventories have been holding steady, as noted above (Fig. 19).
Bad News I: Bond Vigilantes Are P.O.’d About Deficits. The September 30 WSJ features an article by Spencer Jakab titled “America’s Debt Problem Is Too Big for the Bond Vigilantes.” It discusses a festering problem that has come to the fore since Fitch Ratings downgraded US Treasuries on August 1. Simply put: The federal budget deficits are too d@mn wide!
In our August 8 Morning Briefing, we wrote: “The Bond Vigilantes may be turning more vigilant following the Fitch downgrade. They are happiest when the economy is weak and inflation is subdued. They are not so happy right now. ...
“Over the years, we’ve frequently been asked why we aren’t more concerned about the widening US federal government budget deficit. We’ve consistently responded that we will be concerned about it when the financial markets are concerned about it.
“We believe that supply and demand for bonds isn’t usually as important to the determination of the bond yield as are actual and expected inflation and the expectations of how the Fed will respond to them. So given that we expect inflation to continue to moderate, we currently predict that the bond yield won’t rise above 4.25%. If we are wrong about that, and the bond market has trouble financing the government’s huge deficits at current market interest rates, then the Bond Vigilantes will go wild. If that happens, head for the hills for the rest of the summer and maybe September too.”
We’ve been wrong about 4.25% because the Bond Vigilantes are mad as h€ll about profligate fiscal policy. They have no quarrel with the Fed’s tough monetary stance. But seeing the federal deficit widen so rapidly this year with no relief in sight has provoked the Wild Bunch.
We are still counting on falling inflation to stabilize the bond yield. In the August 22 Morning Briefing, we wrote that the bond yield has normalized, returning to where it had been during 2003-07, before the period of abnormally low interest rates from the Great Financial Crisis through the Great Virus Crisis. We concluded that “the 10-year nominal bond yield should be around 4.50%.”
In the past, the Bond Vigilantes didn’t care much about federal budget deficits because it was normal to see them widen during recessions when inflation was moderating and the Fed was easing. Now that the Bond Vigilantes do care about deficits, we care about deficits too. Indeed, the biggest risk to our optimistic outlook for the economy is that the Bond Vigilantes are about to send a very loud message to Washington: “Cut the deficits or we will raise bond yields until they cause a credit crunch and a recession.”
Bad News II: Round Up the Usual Suspects. There are lots of bricks in today’s wall of worry. Fed Chair Jerome Powell in his press conference on September 20 noted: “So there is a long list, and you hit some of them. But, you know, it’s the strike, it’s government shutdown, resumption of student loan payments, higher long-term rates, oil price shock.”
We are placing our bets on relatively happy outcomes over the next few weeks: The strike and the shutdown (in 45 days, maybe) are short. Employment and real wage gains support consumer spending, though at a slower pace than during Q3-2023. Bond yields and oil prices stabilize. Most importantly, core inflation continues to moderate. Wish us luck!
Movie. “A Good Person” (+ +) (link) is about dysfunctional people dealing with the adversities that life can deliver. There’s a terrible car accident, alcohol and drug addiction, and abusive fathers. So the movie is depressing, though it might be uplifting to be reminded that things aren’t all that bad in our own lives compared to the miserable fate that others suffer. The movie is slow and a bit long, but the acting performances of Florence Pugh and Morgan Freeman are superb and worthy of Oscars.
Semis, Earnings & Musk’s Robot
September 28 (Thursday)
Check out the accompanying pdf and chart collection.
Executive Summary: A new trend among big tech companies: DIY AI. Amazon, Google, Tesla, Meta, and Microsoft are developing AI chips in house rather than paying up for Nvidia’s products. … Also: Analysts expect much improved earnings growth for S&P 500 companies on the whole next year, but some industries with the strongest projected growth also have stock price indexes in the doghouse this year to date. Jackie points out which. … And: Inside the neural networks of Elon Musk.
Technology: Everyone’s Making Semis. Large tech companies have been jumping into the semiconductor industry. Amazon, Google, Tesla, and others have developed semiconductors for use in their own operations instead of buying all of their semiconductors from Nvidia, Intel and the like. Custom-made chips tailored to their company’s specific requirements can perform better and are cheaper to make than buying other companies’ chips in the market.
In the case of AI server chips, companies undoubtedly are looking to save money by developing an alternative to Nvidia’s chips, which in the case of its A100 GPUs can sell for $20,000 to $25,000 each on eBay. The costs can add up quickly. OpenAI, for example, will need more than 30,000 of Nvidia’s A100 GPUs for the commercialization of ChatGPT, an April 18 article at TheVerge.com reported.
Here’s a look at the progress some tech companies are making in designing their own chips:
(1) Amazon chips in. Earlier this week, Amazon said it will invest up to $4 billion in Anthropic, an artificial intelligence (AI) firm with an AI chatbot called “Claude 2.” Anthropic will use Amazon Web Services (AWS) as its primary cloud provider, and it will use AWS-designed semiconductors when training the AI models on vast amounts of data.
Anthropic will use AWS Trainium and Inferentia chips to build, train, and deploy future foundation models. The two companies will also collaborate on the development of future Trinium and Inferentia technology. The two chips are considered a less expensive, more accessible alternative to Nvidia chips used for the same purposes.
Amazon jumpstarted its efforts in chip development in 2015 when it purchased Annapurna Labs, an Israeli startup. Since then, it has produced Graviton and Nitro, chips used in its servers. Now Amazon has an AI package to offer clients. In addition to Anthropic, Amazon can offer clients its Trainium and Inferentia chips; Titan, a large language model; and Bedrock, a service to help developers enhance software using generative AI. Some believe that having its own AI chips—which Microsoft does not have—will become a differentiator for Amazon, an excellent August 21 CNBC article on Amazon’s efforts reported.
(2) Google has AI chips too. Google has custom developed Tensor Processing Units, chips designed to accelerate machine learning tasks like image recognition, natural language processing, and predictive analysis. Only customers of Google Cloud access the chips.
Google has also developed Tensor chips for its Pixel phones in conjunction with Samsung. Google reportedly is working to design its first fully custom chipset, the Tensor G5, by 2025 without the aid of Samsung, a July 7 Tom’s Guide article reported. TSMC would handle the production of the chip.
(3) Tesla has Dojo. Tesla has built the Dojo chip to train AI networks in data centers. The chips are designed and built for “maximum performance, throughput and bandwidth at every granularity,” the company’s website states. The chips are used in the company’s Dojo supercomputer, first revealed in 2021, and used to train Tesla’s self-driving AI models. It can quickly analyze the company’s extensive video from its fleet of vehicles, a September 25 article on DriveTeslaCanada.ca reported. The system could also be used in robotics and other autonomous systems. Tesla uses Taiwan Semiconductor Manufacturing Co. to manufacture the Dojo chips and reportedly has doubled its order this year, the article stated.
(4) Meta & Microsoft in the mix. Microsoft is working on developing the Althena AI chip, which could replace Nvidia chips. The project, which began in 2019, reportedly will result in chips that will be made available to Microsoft and Open AI employees as soon as next year.
Meta is also working on a chip for its AI services. The Meta Training and Inference Accelerator—or MTIA chip—in combination with GPUs purportedly delivers better performance, decreased latency, and greater efficiency, a May 18 article at TheVerge.com reported. It’s not expected to come out until 2025.
(5) Semi industry performance data. The S&P 500 Semiconductors stock price index has risen 66.2% ytd through Tuesday’s close, though it’s down 11.5% from its record high on August 1 (Fig. 1). Nvidia has had a huge impact on the industry this year. Its shares have risen 188.9% ytd through Tuesday’s close. If the company were removed from the S&P 500 Semiconductors stock price index, the index would be up only 23.2% ytd.
Semiconductor stocks have rallied in advance of the rebound anticipated in revenues and earnings growth next year. The industry is expected to see its revenue growth flip from a decline of 2.1% this year to an increase of 17.4% in 2024 (Fig. 2). Likewise, earnings are expected to decline 7.5% this year but surge 37.0% in 2024 (Fig. 3). If Nvidia’s earnings were eliminated from the Semiconductors industry, the industry’s forward revenues growth rate would drop to 7.9% from 15.6% and its forward earnings growth drops to 20.6% from 35.5%.
The Semiconductors industry’s forward P/E peaked at 29.5 in mid-July, and it currently stands at 22.7 (Fig. 4). But as earnings rebound next year, the cyclical industry’s forward P/E should fall. If Nvidia’s forward P/E of 28.3 were eliminated from the calculation, the industry’s forward P/E would be only 19.0.
Strategy: Looking at 2024. You’d never know it by this week’s stock market performance, but analysts actually are quite optimistic about the S&P 500 companies’ earnings prospects in 2024. They’re collectively forecasting an 11.7% earnings increase next year, following flattish growth this year of a projected 1.1% and last year’s actual 7.1% increase.
Notably, earnings growth is expected for all 11 of the S&P 500’s sectors next year. Here’s the performance derby for Wall Street analysts’ consensus 2024 earnings forecasts for the S&P 500 and its 11 sectors: Communication Services (18.2%), Technology (15.3), Consumer Discretionary (15.1), Health Care (13.1), Industrials (13.1), S&P 500 (11.7), Utilities (8.6), Financials (8.5), Consumer Staples (7.4), Materials (6.1), Real Estate (3.6), and Energy (2.1) (Table 1).
Several of the industries expected to enjoy the strongest earnings growth in 2024 nonetheless have stock price indexes that have fallen ytd through Tuesday’s close. Here those industries are, ranked by their 2024 earnings growth forecasts: Property & Casualty Insurance (46.6% 2024 earnings growth forecast, -2% ytd return), Gold (38.3, -16.5), Investment Banking & Brokerage (30.8, -14.9), Aerospace & Defense (29.6, -12.2), Housewares & Specialties (26.8, -27.5), Copper (26.4, -3.8), Broadcasting (25.6, -9.9), Pharmaceuticals (23.6, -2.5), Home Furnishings (22.7, -17.0), and Reinsurance (22.5, -0.7).
Three industries from the Financials sector are expected to have an impressive earnings turnaround in 2024: Property & Casualty Insurance, Investment Banking & Brokerage, and Reinsurance. Some observers have been optimistic that recent IPOs from ARM and Instacart would signal the beginning of a new IPO cycle. The market selloff might squash this nascent optimism. Insurance industry analysts may be hopeful that the companies will be able to raise the premiums they charge in the wake of recent disasters. Stock investors don’t seem quite so sure.
The strong earnings expected for both the Copper and Gold industries stands in sharp contrast to the poor performance of their stock price indexes. As for the underlying commodities, the price of copper is down 4.7% ytd through Tuesday’s close, and the price of gold is up 4.6% ytd. The Gold industry contains the shares of Newmont Mining, which have been under pressure since the company offered to purchase Australian gold and copper miner Newcrest Mining for $17.5 billion.
Disruptive Technologies: Musk’s Neural Networks. While Elon Musk is best known for manufacturing electric cars and space rockets, he’s also juggling some smaller projects that are equally as interesting. They include developing human-like robots and mind-reading devices, both of which involve neural networks and both of which have made progress recently. Let’s take a look:
(1) Optimus grows up. Last weekend, Tesla released an impressive video on X (a.k.a. Twitter) of Optimus, its human-like robot. It showed Optimus using “vision” to pick up and sort small blocks. The robot has human-like fingers and moves smoothly, more like a human than a herky-jerky robot. When a human moved around the blocks, Optimus was able to react to the changes and continue sorting. When one of the blocks fell on its side, Optimus knew to set the block upright.
Optimus has a neural network, which is also used in AI and in Tesla’s autonomous cars. “A neural network is a method in artificial intelligence that teaches computers to process data in a way that is inspired by the human brain. It is a type of machine learning process, called deep learning, that uses interconnected nodes or neurons in a layered structure that resembles the human brain. It creates an adaptive system that computers use to learn from their mistakes and improve continuously. Thus, artificial neural networks attempt to solve complicated problems, like summarizing documents or recognizing faces, with greater accuracy,” explains the AWS website.
Tesla switched to using neural networks over the last year. Previously, Tesla’s Autopilot system was trained using a rules-based approach. The car’s camera would identify a red light, and its software program would create rules instructing it to stop at red lights.
Neural networks learn by watching “millions of examples of what humans have done … It’s like the way humans learn to speak and drive … [W]e might be given a set of rules to follow, but mainly we pick up the skills by observing how others do them,” explained Dhaval Shroff, a member of Tesla’s autopilot team in an excerpt from Water Isaacson’s Elon Musk biography. The Autopilot system is shown millions of videos of humans reacting properly to driving situations, which have been recorded by Tesla vehicles. By learning this way, the system reacts to unusual situations and breaks the rules when necessary, just as humans do when driving. The driving system based on neural networks is awaiting approval from regulators.
While no time has been given for Optimus’ release, it’s easy to imagine the robot working in Tesla factories; if the company slashed its labor costs as a result and passed the savings onto customers by lowering the price of a Tesla, it could gain a competitive advantage. Never one for humility, Musk said earlier this year that the “Optimus stuff is extremely underrated,” and demand could be as high as 10-20 billion units, a September 24 Electrek article reported. “He went as far as ‘confidently predicting’ that Optimus will account for ‘a majority of Tesla’s long-term value.’”
(2) Harnessing brain waves. Neural networks are something Musk is familiar with from another of his companies, Neuralink. It has developed a device that’s implanted in a monkey’s head and can transmit the monkey’s thoughts to a lever, allowing the monkey to play the “Pong” video game without ever touching a controller.
The brain’s neurons send information to different parts of the body. Neurons connect to each other in a neural network and communicate using chemical signals called neurotransmitters. “The reaction between different neurons will create an electric field, and these reactions can be recorded by placing neurotransmitters nearby. The electrodes will then translate these signals into an algorithm a computer can interpret,” explained November 2020 article published in Medium.
Neuralink received FDA approval in May to test its device on humans in a six-year trial that will evaluate whether the system can help those with paralysis control devices by using their thoughts. The PRIME (Precise Robotically Implanted Brain-Computer Interface) study is looking for people with quadriplegia due to vertical spinal cord injury or ALS who are over the age of 22 and have a consistent caregiver, a September 19 article at TheVerge.com reported. The brain device, a surgical robot that implants the device, and the user app each will be evaluated. Neuralink and Musk have come under criticism for Neuralink’s treatment of monkeys during the development of the product.
Some have speculated that the system could be used to treat conditions such as obesity, autism, depression, hearing loss, and schizophrenia. There are also reports that the device could be used to download a new language or stream music into your head. The company does face competition. Precision Neuroscience, formed by a Neuralink co-founder, has developed a thin piece of tape that sits on the brain’s surface, and Blackrock Neurotech implanted its first brain-computer interface back in 2004, noted a September 21 BBC article.
Consumers, Earnings & MegaCap-8
September 27 (Wednesday)
Check out the accompanying pdf and chart collection.
Executive Summary: The US economy has been doing well thanks to consumers, defying the gravitational pull of aggressive Fed tightening. Driving the consumers’ record-high real spending is rising real disposable income. Rising real incomes are a function of strong employment. … Supporting the hot labor market are robust construction activity, consumer spending trends, and Baby Boomers’ lifestyles in retirement. … Also: Joe examines the rates of Q3 earnings and revenues growth that analysts expect for the S&P 500 with and without two sets of stocks that sway results significantly: the MegaCap-8 and the S&P 500 Energy sector.
Weekly Webcast. If you missed Tuesday’s live webcast, you can view a replay here.
US Consumers I: What’s Been Driving Them? The main reason that the US economy has dodged a recession so far is that payroll employment remains strong. It’s hard to have a recession when employment is rising to record highs month after month (Fig. 1). Employment gains have bolstered consumer spending. So too has inflation-adjusted average hourly earnings, which has been rising since the start of the year (Fig. 2).
As a result, consumers’ real disposable personal income has been on an upward trend since the start of the year (Fig. 3). During July, it was up 3.8% y/y and 3.5% above its January 2020 reading, just before the pandemic. However, it is still below its pre-pandemic trendline.
So with consumers’ real disposable income growing at a slower pace than it was before the pandemic, how is it that real personal consumption expenditures was at a record high in July? In fact, it hit a then-record high in early 2021 and has resumed its pre-pandemic upward trend since then.
The answer, of course, is that consumers’ high rates of saving during the pandemic supported their record-high spending pace afterwards. Inflation-adjusted personal saving soared along with real disposable income during the pandemic as Americans saved more of their earnings and much of the three rounds of pandemic relief checks (Fig. 4). That allowed them to save less and spend more as the pandemic abated, even as inflation eroded their disposable income from mid-2021 through mid-2022.
Since then, the pace of consumers’ real saving has stopped falling but remains low compared to their pre-pandemic real saving. But their rising real disposable income has provided consumers with the purchasing power to drive real consumer spending to record highs along the same upward trend as before the pandemic.
US Consumers II: Why Is Employment So Strong? The resilience of the labor market has been one of the main reasons why the widely expected recession has been a no-show since early last year. It was widely expected that the Fed’s aggressive tightening of monetary policy would reduce consumer demand and depress employment, which would further weigh on consumer spending. In his press conference last Wednesday, Powell frequently stated that the labor market is coming into balance, but he still described it as “very hot.” Why hasn’t it cooled off, and will it do so? Consider the following:
(1) Many industries at record highs. Payroll employment was at a record high in August because many of its components were at or near record highs in August, including the following: construction, heavy & civil engineering construction, transportation & warehousing, wholesale trade, food services & drinking places, professional & business services, financial activities, educational services, hospitals, ambulatory health care services, and social assistance.
(2) No recession in construction industry. Record highs in construction employment don’t happen during recessions (Fig. 5). Single-family housing starts have been in a recession since early last year (Fig. 6). However, multi-family starts remained strong until they plunged in August. The result has been that construction employment in the residential building sector rose to a record high in August (Fig. 7).
Construction employment in the nonresidential building industry also rose to a record high in August, boosted by more spending by manufacturers on onshoring and by the government on infrastructure (Fig. 8).
(3) Online shopping is booming. Retail sales, excluding food services and online retail sales, has been relatively flat since May 2022 (Fig. 9). On the other hand, online shopping, which soared to record highs during the pandemic, has continued to do so (Fig. 10). Such sales on a per-household basis and at an annual rate have doubled from about $5,000 just before the pandemic to almost $10,000 currently (Fig. 11).
Over this same period, employment in warehousing and storage (i.e., mostly fulfillment centers for online retailers) has increased by more than 500,000, while employment in retail trade has been flat (Fig. 12).
(4) Baby Boomers dining out and visiting healthcare providers. Americans are going to restaurants in record numbers since the end of the pandemic. That’s resulted in a big increase in employment in food services & drinking places (Fig. 13).
Many of the Baby Boomers no longer have their children at home, and more of them are retiring with ample nest eggs. That explains the strength in restaurant sales and employment. The aging of the Baby Boomers also explains why employment in healthcare is booming, as older people tend to visit healthcare providers more often than younger ones (Fig. 14).
(5) The bottom line. Some of the post-pandemic strength in payroll employment is attributable to the abatement of the pandemic itself. Some is also related to more structural developments, including onshoring of manufacturing and the aging of the Baby Boomers. The labor market is showing some signs of cooling, but it is likely to remain a source of jobs and economic strength. In our opinion, that doesn’t mean that the Fed must continue to raise interest rates to subdue inflation. They are high and restrictive enough to do the job. Besides, the inflation shocks attributable to the pandemic are also abating.
Earnings I: With & Without MegaCap-8. During 2022, the collective revenues and earnings growth rates of the MegaCap-8 stocks (i.e., Alphabet, Amazon, Apple, Meta, Microsoft, Netflix, Nvidia, and Tesla) sagged considerably after surging for pandemic-related reasons during 2021. Quarterly revenues growth last year remained positive on a y/y basis but dropped to single-digit percentage rates. Earnings fared much worse, falling y/y for four straight quarters through Q1-2023. However, Q2 was a notable turning point for the MegaCap-8’s earnings and revenues growth. And both are expected to improve further in Q3, as Joe shows below:
(1) Q2 revenue and earnings results. During Q2-2023, the MegaCap-8’s collective y/y revenues growth reaccelerated to double-digit percentages, and its earnings growth turned positive for the first time in five quarters. The MegaCap-8’s revenues rose 10.2% y/y in Q2-2023 following a 4.6% rise in Q1-2023, and the group’s earnings jumped 29.7% y/y after declining 3.1% in Q1. In stark contrast, the S&P 500’s revenues growth slowed to 1.2% y/y during Q2-2023 from 4.6% in Q1, while its y/y earnings decline slowed to -0.4% on a proforma basis from -4.9% in Q1.
When we exclude the MegaCap-8 from the S&P 500, Q2-2023’s y/y growth metrics were substantially weaker for revenues and earnings. S&P 500 revenues growth without the MegaCap-8 fell to an anemic 0.2% y/y in Q2-2023 from 1.2%, and the y/y earnings decline worsened to -5.1% from -0.4%.
(2) Q3’s outlook for revenue and earnings growth. Looking ahead to Q3-2023, analysts collectively expect the S&P 500 companies’ aggregate y/y revenues growth rate to slow to a 0.8% crawl from 1.2% in Q2, and for earnings to drop 1.6% y/y following a 0.4% decrease in Q2. But they hold shining expectations for the MegaCap-8’s Q3 revenues growth, which they see accelerating to 11.1% y/y from 10.2% in Q2, and for the group’s earnings growth, projecting a jump to 39.1% from 29.7%. The former would be the strongest revenues growth the MegaCap-8 has experienced since Q1-2022, and the latter would be its best earnings growth since Q3-2021!
Looking at the Q3 revenues and earnings growth predicted for the S&P 500 minus the boosts provided by the MegaCap-8 is a sorry sight. Without these eight stocks, revenues would be expected to decline 0.4% y/y in Q3, compared to a 0.2% gain in Q2, and the earnings decline projected in Q3 would deepen from Q2’s decline, to -7.6% from -1.6%. If those forecasts come to pass, it would be the first revenue decline for the S&P 500 ex-MegaCap-8 since Q4-2020 and the third straight quarterly decline in earnings.
Earnings II: With & Without Energy. During 2023, the S&P 500 Energy sector’s revenues and earnings growth has tumbled deep into negative territory following the cyclically high double- and triple-digit percentage increases of 2022. Energy’s revenues growth turned negative in Q1-2023 and worsened in Q2, while the sector’s earnings growth turned negative on a y/y basis in Q2. However, analysts expect Q3 to be less bad for the Energy sector, and the S&P 500’s ex-Energy earnings results are expected to improve considerably, as Joe shows below:
(1) Q2 revenue and earnings results. During Q2-2023, Energy’s percentage y/y revenue decline worsened to -28.9% from 5.2% in Q1, and the sector’s earnings tumbled 47.7% y/y after rising 21.0% in Q1. This dragged down the S&P 500’s revenues growth to 1.2% y/y during Q2-2023 from 4.6% in Q1, while its y/y earnings decline slowed to -0.4% on a proforma basis from -4.9% in Q1.
When we exclude the Energy sector from the S&P 500, Q2-2023’s y/y growth metrics for revenues become substantially stronger and earnings growth actually turns positive. S&P 500 revenues growth without Energy jumps to 4.4% y/y in Q2-2023 from 1.2% with Energy, and the y/y earnings decline of 0.4% turns into a gain of 3.6%.
(2) Q3’s outlook for revenue and earnings growth without Energy. As mentioned above, the S&P 500’s y/y revenues growth rate is expected to slow to 0.8% in Q3 from 1.2% in Q2, and its earnings aren’t expected to grow at all y/y but to decline 1.6% versus a 0.4% decline in Q2. Analysts think that the worst is past for the Energy sector and that Q2 marked the worst of the y/y comparisons. They still expect revenues and earnings to fall on a y/y basis in Q3, but less so, as oil prices are recovering now, and consensus forecast declines have given way to upward revisions in recent weeks.
Analysts are calling for Energy’s revenues decline to lessen to 22.5% y/y in Q3 from -28.9% in Q2, and for the sector’s earnings growth to jump to 39.1% from 29.7%. The S&P 500’s revenue and earnings growth predictions are markedly better without the Energy sector: Revenues are expected to rise 3.4% y/y in Q3 compared to a 4.4% gain in Q2, and the earnings increase picks up to 6.7% without Energy from 3.6% in Q2. If those forecasts come to pass, the S&P 500 ex-Energy’s revenues growth rate will be positive yet again, and earnings growth would be positive for a second straight quarter after being negative for four quarters through Q1-2023.
On a brighter note, earnings seasons typically deliver an upside surprise for revenues and earnings. Just how much of a surprise, and whether the S&P 500’s earnings growth will be positive on a y/y basis instead of falling, the coming weeks will tell. This year’s quarters so far have pleasantly surprised, and we think Q3 will too.
Is Powell’s Path Forward Widening Or Narrowing?
September 26 (Tuesday)
Check out the accompanying pdf and chart collection.
Executive Summary: The Fed has paused its rate hiking for now but not without warning that resumed tightening is possible. Either way, monetary policy will be kept restrictive for longer than investors previously expected, Fed Chair Powell has said. What does that scenario imply for the economic outlook? Peaks in the federal funds rate are coincident indicators of financial crises caused by restrictive policy, which often trigger credit crunches and recessions. That’s the big risk of the Fed’s higher-for-longer rate path. ... We don’t expect that scenario—we’re in the soft-landing camp—but were it to occur, the highly leveraged commercial real estate market might be the epicenter of the financial crisis.
YRI Weekly Webcast. This week, join Dr. Ed’s live webcast with Q&A on Tuesday, September 26, at 11 a.m. EST. You will receive an email with the link one hour before showtime. Replays of the weekly webcasts are available here.
Credit I: Is Federal Funds Rate a Leading Indicator? Let’s say that the Fed is done raising the federal funds rate (FFR) for now. So far, so good: There hasn’t been a recession during this round of tightening. However, proponents of a hard-landing economic outlook observe that the FFR peaked before the last four recessions, implying that the peak might be a leading indicator of recession (Fig. 1).
It clearly was not a leading indicator of recessions during the 1970s and 1980s; it was a coincident indicator of the four recessions back then.
The soft-landers, including Debbie and me, observe that past peaks in the federal funds rate coincided with financial crises that were attributable to the tightening of monetary policy (Fig. 2). So the FFR actually was a coincident indicator of financial crises. The crises caused the Fed either to ease monetary policy or at least to pause its tightening until the financial crises morphed into widespread credit crunches that caused recessions.
This time so far, there has been a financial crisis that occurred in March, but the Fed contained it quickly. It didn’t precipitate a credit crunch, so there hasn’t been a recession.
Where are we now? The Fed has raised the FFR very aggressively, by 525bps, since March 2022. There have been 13 FOMC meetings since then. The Fed paused its rate hiking only twice so far, and that was at last week’s meeting and back in June (Fig. 3). Fed officials have said that there might be more rate hikes ahead if economic growth doesn’t slow and if inflation doesn’t continue to fall toward the Fed’s 2.0% target.
Even if both conditions occur, Fed officials have indicated that they will be in no rush to lower interest rates. Indeed, at last week’s FOMC meeting, the committee’s median forecast for the FFR in 2024 was changed from four rate cuts to two of them, totaling 50bps rather than 100bps.
If the Fed is done raising the FFR but keeps it at the current level for a prolonged period through 2024, that still would be a restrictive stance for monetary policy. In our opinion, that would be preferable to more rate hikes, which would increase the chance of something breaking in the financial market.
During his presser last week, Powell was asked by one of the reporters: “Would you call the soft landing now a baseline expectation?” Powell responded saying: “No, no. I would not do that. … I’ve always thought that the soft landing was a plausible outcome, that there was a path, really, to a soft landing. … I’ve said that since we lifted off. It’s also possible that the path is narrowed, and it’s widened apparently. Ultimately, this may be decided by factors that are outside our control at the end of the day. But I do think it’s possible.”
So a soft landing isn’t Powell’s baseline scenario; but it is still possible, and the path to it might have widened. The reporter was right to ask whether a soft landing is the Fed’s baseline since the FOMC’s Summary of Economic Projections (SEP) released last week maps out a soft-landing scenario:
(1) The latest SEP shows headline PCED inflation continuing to moderate from 3.3% this year to 2.5% next year, 2.2% in 2025, and 2.0% in 2026. That’s nearly identical to the path projected in June’s SEP.
(2) The committee boosted this year’s estimated real GDP growth rate from 1.0% to 2.1% and next year’s from 1.1% to 1.5%. As a result, the trajectory of the unemployment rate was lowered to 3.8% this year from 4.1% and to 4.1% next year from 4.5%.
(3) Last Thursday, we wrote: “It all adds up to a soft-landing scenario. Skeptics undoubtedly will claim that the Fed is always wrong, so a hard landing is an even more likely outcome. We are siding with the Fed. We think they’ve done a very good job so far. They’ve been guiding the markets to expect higher-for-longer interest rates since last year. Now they are guiding markets to expect that the Fed will hold the federal funds rate for longer. That’s a better way to keep monetary policy restrictive without raising the federal funds rate further (or much further). This approach reduces the chances of a financial crisis and credit crunch, in our opinion.”
(4) Powell mentioned and was asked about “external factors” that might possibly determine whether the economy experiences a soft or hard landing. He responded to the question as follows: “So there is a long list, and you hit some of them. But, you know, it’s the strike, it’s government shutdown, resumption of student loan payments, higher long-term rates, oil price shock. You know, there are a lot of things that you can look at. And, you know, so what we try to do is assess all of them and handicap all of them. And ultimately, though, there’s so much uncertainty around these things.”
He concluded his answer by noting that the economy has “significant momentum ... but we do have this collection of risks.”
Credit II: Cracks in Commercial Real Estate. Powell did not discuss the biggest risk of them all, namely that restrictive monetary policy could still trigger a financial crisis even if the Fed stops raising interest rates but maintains the FFR at the current level. It is widely recognized that there are long and variable lags between the tightening of monetary policy and its impact on the financial system and the economy.
Currently, our main concern is that the rolling recession is rolling into the commercial real estate (CRE) market, which tends to be highly leveraged. So CRE debt had been (during the S&L crisis of the late 1980s and early 1990s) and once again could be the epicenter of a financial crisis that could morph into a credit crunch and cause an economy-wide recession. Accordingly, Melissa and I are watching it closely. Consider the following:
(1) Most of the focus in the financial press has been on old office buildings in urban areas. They were hard hit by the pandemic when many workers worked from home. Many of those workers continued to work from home after the pandemic or went to their offices on a part-time basis, which reduced the amount of space that companies needed for their offices. Now many of those office buildings have lots of vacancies and face more as leases expire. Building owners must lower rents to keep or attract tenants. And now, many of the loans taken out to purchase the buildings will have to be refinanced at much higher interest rates. There are already delinquencies in the space and more to come.
(2) Of course, the issue of refinancing debt at much higher interest rates isn’t a problem just for old office buildings but for all commercial real estate with debts that are coming due. That makes it a problem for their lenders. During the September 13 week, commercial banks held $2.9 trillion in CRE loans (Fig. 4). Large banks had $0.9 trillion, while small banks had $2.0 trillion. So the smaller banks are especially vulnerable to loan losses.
Commercial banks had $484 billion in construction and land development loans during the September 13 week. Large and small banks had $133 billion and $337 billion of them, respectively (Fig. 5).
CRE loans secured by nonfarm nonresidential properties totaled $1.8 trillion during the September 13 week. The large banks and small banks held $0.5 trillion and $1.2 trillion (Fig. 6).
(3) Also vulnerable to refinancing risk are CRE loans secured by multi-family residential properties. They totaled $580 billion during the September 13 week, with $232 billion at the large banks and $328 billion at the small ones (Fig. 7). We noticed that multi-family housing starts dropped 26.3% m/m during August (Fig. 8). Here is what happened regionally last month: Northeast (+4.9), Midwest (+3.9), South (-34.6), and West (-32.6) (Fig. 9).
August’s weakness in multi-family starts might have been a fluke or it might be signaling that this CRE sector has overbuilt (especially down South and out West), as evidenced by rapidly declining rent inflation on new leases, while financing rates have soared (Fig. 10). In other words, the math may no longer work for the multi-family sector of the CRE market.
Credit III: Fed’s Assessment of CRE Risk. The path to a soft landing has “widened apparently,” according to Fed Chair Jerome Powell, as we noted above. We aren’t quite so sure, which is why we raised our subjective odds of a hard landing from 15% to 25% in the September 18 issue of our Morning Briefing. In other words, we think the path may be narrowing. Our main concern is profligate fiscal policy. It is causing mounting federal deficits that could keep bond yields at levels that stress out many borrowers who must refinance their debts at much higher interest rates. This is certainly a problem in the CRE market.
The Fed’s May 2023 Financial Stability Report included a review of the CRE credit market. After we read it, we concluded that troubles in that market shouldn’t cause an economy-wide credit crunch and a recession. We still think so, but we are on alert. The report observed:
“The shift toward telework in many industries has dramatically reduced demand for office space, which could lead to a correction in the values of office buildings and downtown retail properties that largely depend on office workers. Moreover, the rise in interest rates over the past year increases the risk that CRE mortgage borrowers will not be able to refinance their loans when the loans reach the end of their term. With CRE valuations remaining elevated (see Section 1, Asset Valuations), the magnitude of a correction in property values could be sizable and therefore could lead to credit losses by holders of CRE debt.”
For more of our analysis of the Fed’s report, see the July 24 issue of our Morning Briefing titled “Rolling Recession Rolling Over Commercial Real Estate.”
Money & Credit: Debatable Points
September 25 (Monday)
Check out the accompanying pdf and chart collection.
Executive Summary: Some economic prognosticators still believe that a credit crunch and recession are just around the bend. Today, we question two of their main arguments: We don’t believe that falling M2 presages anemic GDP growth; contrary to conventional wisdom, there is no reliable correlation between the two. And we can’t see consumers slamming the brakes on their spending and hobbling the economy; they don’t need to with their net worth at a record high and real disposable income growing. … Also: The inverted yield curve correctly predicted the banking crisis earlier this year, but there has been no credit crunch so far; we are monitoring commercial bank lending stats closely. ... And: Dr. Ed reviews “Golda (+ + +).
YRI Weekly Webcast. This week, join Dr. Ed’s live webcast with Q&A on Tuesday, September 26, at 11 a.m. EST. You will receive an email with the link one hour before showtime. Replays of the weekly webcasts are available here.
Money I: The Velocity Myth. Among the debating points proffered by the proponents of the hard-landing economic outlook since last year is that the M2 monetary aggregate has been falling since it peaked at a record high of $21.7 trillion in July 2022 (Fig. 1). It is down $801 billion since then through July of this year. They’ve observed that on a yearly percent change basis, it turned negative for the first time ever in December 2022; the data series is available since 1959 (Fig. 2). In July, it was down 3.7%.
On an inflation-adjusted basis, using the CPI as the deflator, real M2 peaked in December 2021 and fell 11.5% through July (Fig. 3). On a yearly percent change basis, it turned negative in April 2022 and was down 6.7% in July (Fig. 4).
The flaw in this hard-landing argument is the assumption that M2 and GDP are correlated. We point out that nominal and real GDP were up 6.1% y/y and 2.5%, respectively, during Q2-2023 (Fig. 5 and Fig. 6). This suggests that any correlation between M2 and GDP is debatable. Consider the following:
(1) Velocity is a fudge factor. It is widely believed that the growth rate of nominal (real) GDP is determined by the growth rate of nominal (real M2) multiplied by the velocity of money. That’s a myth because velocity is a meaningless residual variable that is calculated as the ratio of nominal GDP divided by M2 (Fig. 7).
There is no predictable relationship between M2 and GDP, in either nominal or real terms—because V is unpredictable. V was relatively stable and predictable from the 1960s through the late 1980s. Then it rose through the mid-1990s and mostly fell since then through the pandemic. It has been rising over the past seven quarters through Q2.
The quantity theory of money posits that M2 x V = GDP, in current dollars. From our perspective, this isn’t a theory at all; it is a meaningless tautology!
(2) Before M2 fell, it soared. The recent decline in M2 seems much less alarming when we recall that it soared during the pandemic because it was boosted by three rounds of pandemic relief checks dropped by the US Treasury into the deposit accounts of millions of Americans. In addition, many Americans saved more in the liquid assets included in M2 because they couldn’t spend much of their incomes during the pandemic lockdowns; they continued to save more for a while after that point for precautionary reasons. Indeed, the 12-month change in M2 has tracked the 12-month sum of personal saving very closely since the start of the pandemic (Fig. 8).
M2 soared by $6.3 trillion from January 2020 (just before the pandemic) to its record high on July 2022. It then fell $801 billion, as noted above. Our opinion is that it is simply falling back to its pre-pandemic upward trendline. In July, we reckon it was still about $3 trillion above that trendline. Meanwhile, M2 has been flat since May. The weekly commercial bank deposits series, which closely tracks M2, has been relatively flat for the past 24 weeks through the September 13 week (Fig. 9).
Money II: The Excess Saving Myth. The hard-landers have also been claiming that the reason that they have been wrong since early last year is that consumers have been holding the economy aloft by spending their excess saving accrued during the pandemic, which will soon be depleted. So a consumer-led recession is imminent, they figure.
They observe that personal saving soared during the pandemic years well above the pre-pandemic pace. It then fell below that pace. They claim that the excess saving with which consumers were left after the pandemic now mostly has been spent, as saving has fallen below the pre-pandemic pace since mid-2021. Presumably, consumers’ spending on goods and services will take a dive, probably soon when the excess saving is gone and the pace of saving returns to its pre-pandemic trend.
The hard-lander’s narrative seems to make sense, but it might be nonsense. There are good reasons to believe that consumer spending is not about to retrench. Consider the following:
(1) The sum of total deposits at all commercial banks plus money market mutual funds (MMMFs) jumped $2.8 trillion during the lockdowns from the last week of February 2020 through the last week of April 2020 (Fig. 10). This series has continued to climb to a record $22.9 trillion through the September 13 week. It is well above its pre-pandemic uptrend. Of course, consumers aren’t the only holders of these assets, but the sum of deposits plus MMMFs suggests that there is still plenty of excess saving that hasn’t been spent by consumers and may remain in liquid assets, especially now that the yields on deposits and money market securities are so high!
(2) The net worth of the household sector rose to a record $154.3 trillion at the end of Q2-2023 (Fig. 11). It is up a whopping $37.6 trillion since Q4-2019, just before the pandemic. There’s no pressing need for consumers to save more than they’ve been saving recently, in our opinion. There tends to be an inverse relationship between the personal saving rate and household net worth as a percentage of disposable personal income (DPI) (Fig. 12).
(3) Prior to the pandemic, the main driver of real personal consumption expenditures was real DPI (Fig. 13). During the pandemic years (2020 and early 2021), pandemic relief checks boosted real DPI, while consumption didn’t recover back to its pre-pandemic trend until mid-2021. Real DPI fell during most of 2021 and early 2022, but real consumer spending resumed its pre-pandemic upward trend because households saved less. Meanwhile, real DPI has been rising again since early 2022.
So in reality, consumers saved less of their real DPI to bolster their spending on goods and services when real DPI was falling. They could afford to do so because they enjoyed a huge windfall from the “helicopter money” dropped by the government in their accounts, much of which still seems to be sitting in liquid assets. They also enjoyed gains again in their stock portfolios since October of last year, while their home values remained elevated despite rising mortgage rates. So now there is no pressing need for consumers to boost their saving rate back to where it was just before the pandemic (i.e., at 9.1% during January 2020 from 3.5% during July 2023).
(4) The bottom line is that a significant portion of the pandemic relief checks might remain in consumers’ net worth. They saved rather than spent quite a bit of their so-called excess saving. Then when their DPI fell, they saved less of it, so their spending actually rose. Now growing DPI is supporting consumption without any compelling reason for consumers to save more of it.
Credit I: No-Show Credit Crunch Despite Inverted Yield Curve. The inverted yield curve has also been a favorite debating point of the hard-landers. The yield-curve spread between the 10-year US Treasury bond yield and the federal funds rate is one of the 10 components of the Index of Leading Economic Indicators (LEI) (Fig. 14). It has contributed to the decline in the LEI, which peaked at a record high in December 2021 and has been falling since then through July. The yield curve has been inverted since December 2022.
Yet so far, the inverted yield curve hasn’t correctly predicted a credit crunch, which is what caused previous recessions. So far, the credit crunch has been a no-show, just like the Godot recession. The inverted yield curve did correctly predict a financial crisis, which occurred in the banking system during March. But the Fed whacked that mole by quickly providing an emergency lending facility for the banking system.
So while the hard-landers still argue that Godot soon will make a belated entrance on stage, the Index of Coincident Economic Indicators (CEI) suggests not: It rose 0.2% m/m in August to yet another record high (Fig. 15). It tracks the y/y growth rate of real GDP closely. The former was up 1.4% y/y in July, while real GDP was up 2.5% y/y through Q2 (Fig. 16).
Meanwhile, the yield curve has been disinverting. From a daily perspective, the yield-curve spread between the 10-year and 2-year Treasuries narrowed to -66bps on Friday from a low of -108bps on July 3 (Fig. 17). That’s because the economic outlook currently appears to be “stronger for longer,” which is why Fed officials have been promoting a higher-for-longer outlook for the federal funds rate.
By the way, Melissa and I literally “wrote the book” on the yield curve in 2019; it’s titled The Yield Curve: What Is It Really Predicting? You can download a pdf of it at the provided link.
Credit II: Banks Lending As Usual. Notwithstanding the above, Melissa and I are on full alert watching for a credit crunch in the weekly balance-sheet data on the commercial banking system provided by the Fed. So far, so good. Keep in mind that commercial and industrial (C&I) loans at the banks is a component of the Index of Lagging Economic Indicators. In any event, here are our observations on the latest data, through September 13:
(1) All loans and leases rose 4.4% y/y through the September 13 week, down from a recent peak of 12.2% during the October 26, 2022 week (Fig. 18). The slowdown is widespread among the four major loan categories, and especially noticeable for C&I loans, which are up just 0.1% y/y (Fig. 19). Might this weakness signal a credit crunch? More likely is that it is coinciding with the business inventory cycle, especially for retailers that had to discount unsold merchandise late last year to clear it out of their stores (Fig. 20).
(2) Interestingly, commercial real estate loans were still up 7.3% y/y during the September 13 week to a record high of $2.9 trillion (Fig. 21). Nevertheless, we still believe that the commercial real estate (CRE) market is getting hit with a rolling recession. It is likely to be quite severe and spread beyond old urban office buildings as CRE borrowers are forced to refinance their properties at much higher interest rates. A glut of new multi-family residential housing is depressing rents and could cause distress in this sector of the CRE market. We note that multi-family housing starts dropped sharply in August.
(3) The only bit of bank loan data that, taken alone, could be construed as a sign of a credit crunch so far is that auto loans are down 2.2% y/y (Fig. 22). But credit card and other revolving plans are up by a much greater 10.8% y/y.
Movie. “Golda” (+ + +) (link) is a docudrama about Golda Meir, when she led Israel as prime minister during the Yom Kippur War in 1973. Helen Mirren does an incredibly good job in the lead role. The movie depicts Israel’s existential crisis attributable to the war and Golda’s adroit management of the near calamity. Israel succeeded in winning the war, which started with a surprise attack by a coalition of Arab states led by Egypt and Syria. Golda agreed to a ceasefire with Egyptian President Anwar Sadat. She lived to see the signing of the Camp David Accords in 1978. It was the first formal peace agreement between Israel and its Arab neighbors.
The Fed, The Deficit & Earnings
September 21 (Thursday)
Check out the accompanying pdf and chart collection.
Executive Summary: The Fed once again alerted the financial markets that the federal funds rate will remain restrictively aloft for longer than generally expected. Managing the market’s expectations in this way rather than raising rates further might lower the risk of a credit crunch and recession. We agree with the FOMC members who collectively anticipate a soft landing. … Also: Inflation has boosted federal entitlements and interest outlays, ballooning the federal budget deficit to worrisome heights, and soon the Biden administration’s spending spree will take it further north. … And: Get ready for a better Q3 earnings season; that’s the message from the earnings estimate data that Joe tracks for S&P 500 companies.
The Fed: Holding for Longer. The FOMC’s latest Summary of Economic Projections (SEP) shows that the median forecast for the federal funds rate (FFR) for 2023 is 5.6%, unchanged from June’s SEP. The 2024 forecast was raised to 5.1% from 4.6%. As we expected, the FOMC’s message is that the FFR might be lowered next year by 50bps rather than 100bps.
The latest SEP shows headline PCED inflation continuing to moderate from 3.3% this year to 2.5% next year, 2.2% in 2025, and 2.0% in 2026. That’s nearly identical to the path projected in June’s SEP.
So why did the committee raise the FFR trajectory to holding-for-longer? The economy has been stronger than expected. The committee boosted this year’s estimated real GDP growth rate from 1.0% to 2.1% and next year’s from 1.1% to 1.5%. As a result, the trajectory of the unemployment rate was lowered to 3.8% this year from 4.1% and to 4.1% next year from 4.5%.
It all adds up to a soft-landing scenario. Skeptics undoubtedly will claim that the Fed is always wrong, so a hard landing is an even more likely outcome. We are siding with the Fed. We think they’ve done a very good job so far. They’ve been guiding the markets to expect higher-for-longer interest rates since last year. Now they are guiding markets to expect that the Fed will hold the federal funds rate for longer. That’s a better way to keep monetary policy restrictive without raising the federal funds rate further (or much further). This approach reduces the chances of a financial crisis and credit crunch, in our opinion.
Bond and stock prices were hit hard yesterday. We did warn you that September isn’t over. Now that the FOMC’s blackout period has ended, we can expect more hawkish squawking from Fed officials. The only good news yesterday was that the price of oil also was knocked down.
US Budget Deficit: More To Come. It is widely assumed that the recent widening of the federal deficit is mainly attributable to the spending programs enacted by the Biden administration during 2022. In fact, the recent widening is mainly attributable to inflation, which has boosted federal government outlays on Social Security and net interest. The biggest contributor to the bulging deficit has been a decline in individual income tax revenues during the current fiscal year after they were boosted last year when investors sold lots of their stocks that had capital gains during the 2022 bear market. They paid lots of capital gains taxes.
So outlays will get boosted even more in coming years by all the spending Congress approved last year. To monitor this development, Debbie and I are tracking total outlays excluding spending on the major entitlement programs, defense, and net interest: Here is what the data show so far:
(1) Federal government outlays totaled $6.4 trillion over the past 12 months through August. Also on a 12-month basis, the sum of outlays on Social Security, Medicare, health, income security, defense, and net interest was $5.3 trillion (Fig. 1 and Fig. 2).
The difference between total outlays and the sum of the nondiscretionary spending categories listed above (including defense) is mostly attributable to discretionary spending on goods and services (Fig. 3). This series has been too noisy since the pandemic to be useful for our purposes.
(2) On a quarterly basis, we can track federal government spending on goods and service in nominal GDP to assess when Biden’s spending spree will hit the economy (Fig. 4). This series did rise 6.0% y/y during Q2 with more to come. By the way, federal government outlays on income redistribution account for 74.6% of total federal outlays during Q2 (Fig. 5).
Earnings: A Sweeter Outlook for Q3 Earnings Growth. Joe has been tracking the quarterly earnings forecast for S&P 500 companies collectively each week since the series started in Q1-1994. Each reporting season brings a typical playbook: Industry analysts cut their estimates gradually until reality sets in during the final month of the quarter, when some companies warn of weaker results. The combination of falling forecasts for companies that have underperformed earlier expectations, steady forecasts for those holding good news close to their vests, and insufficient estimate increases so close to reporting time to balance out the lowered expectations invariably creates an “earnings hook” pattern in the charted estimate/actual data as reported earnings exceed the latest estimates—i.e., a positive earnings surprise. In other words, the final month of quarters usually sets the stage for better-than-expected earnings reports.
That’s what usually happens, but the upcoming Q3-2023 earnings season has marked a departure in the data trend: Analysts have raised their estimates on a net basis over the course of the quarter so far.
Let’s recap briefly what brought us to this point: The strong earnings recovery following the Great Virus Crisis (GVC) had analysts scrambling to raise their forecasts for six straight quarters from Q2-2020 through Q3-2021, and not even coming close to catching up to the actual earnings results. The S&P 500 recorded unusually high double-digit percentage earnings beats for the first time since the aftermath of the Great Financial Crisis (GFC) during 2009-10.
The tide turned after Q1-2022, and y/y earnings growth has been slightly negative for three straight quarters through Q2-2023. The latest earnings downturn has been largely a mild profits recession, as revenue growth has remained positive throughout. But signs of a turnaround have emerged recently, as analysts’ earnings estimates have increased over the course of the quarter, not decreased as usual, and they now expect a return to positive y/y earnings growth in Q3-2023.
Below, Joe separates the good news in what the data tells us from the bad news:
(1) Q3 marks departure from quarters of estimate cutting. After falling slightly during H1-2022, the pace of estimate declines for the S&P 500 throughout the quarter accelerated in Q3-2022, when the estimate dropped 6.6%. Declines remained elevated during Q4-2022 and Q1-2023, abated for Q2-2023, and now have turned into a gain for Q3-2023. Specifically, the Q4-2022 estimate was down 5.9% during the runup to its earnings season, followed by a similar 6.2% in Q1-2023, then just 2.5% in Q2-2023. With two weeks left before the end of Q3-2023, the S&P 500’s Q3 estimate has risen 0.3% so far.
Q3-2023’s estimate gain is the first in seven quarters and the largest since Q3-2021. If the gain holds until the end of September, it would only be the 21st time that has occurred in the 118 quarters dating back to Q2-1994.
(2) Most S&P 500 sectors have rising Q3 estimates now. Analysts had been too bullish and overestimated the length of the post-GVC boom in earnings, resulting in very broad quarterly earnings declines at the sector level during their runup to the earnings seasons through Q1-2023. At the peak of optimism in Q2-2021, nine of the 11 sectors had their quarterly estimate rise during the quarter. By Q1-2022, that count was down to five sectors (Energy, Financials, Real Estate, Tech, and Utilities) before dwindling to just one sector during Q3-2022 (Energy), Q4-2022 (Utilities), and Q1-2023 (Utilities). During Q2-2023, the count recovered to four sectors and it has further improved to six sectors as of the September 14 week (Fig. 6).
Among the six sectors with gains, Consumer Discretionary’s Q3-2023 earnings estimate has risen 5.7% since the end of Q2-2023, ahead of Communication Services (4.7%), Information Technology (4.0), Energy (2.1), Real Estate (1.3), and Financials (1.1). Analysts who read the recession memo earlier this year since have tossed it into the recycle bin, reversing course to play catch-up, especially in the Energy, Financials, and Real Estate sectors.
Among the weakest sectors, here's how much their collective Q3-2023 estimate has changed over the course of the quarter: Materials (-12.0%), Utilities (-4.2), Industrials (-4.1), Consumer Staples (-3.4), and Health Care (-2.1).
(3) Seven sectors to show y/y growth in Q3-2023. Seven sectors are expected to record positive y/y percentage earnings growth in Q3-2023, unchanged from Q2-2023’s count, but five of the seven are expected to record double-digit percentage gains. That’s up from three sectors with double-digit gains in Q2-2023. With 34.5% expected y/y growth for Q3-2023, Communication Services is well ahead of Consumer Discretionary (22.2%), Financials (15.3), Utilities (13.1), Industrials (10.3), Information Technology (5.6), and Consumer Staples (1.4).
Along with the large number of sectors with double-digit positive percentage y/y growth, analysts now expect the S&P 500’s earnings growth rate to be positive on a frozen actual basis for the first time in four quarters. They expect 0.1% y/y growth in Q3-2023, up from -5.4% y/y in Q2-2023, -3.1% in Q1-2023, and -1.5% in Q4-2022. On a pro forma basis, they expect earnings to rise 1.9% in Q3-2023. That compares to a 2.9% decline in Q2-2023, a 0.1% gain in Q1-2023, and a 3.2% decline in Q4-2022. When the dust finally clears on the Q3 earnings reports, we think y/y growth will settle around 3.5%.
(4) Energy remains a drag on overall S&P 500 earnings. Looking at the data without the Energy sector is telling as well. On an ex-Energy-sector basis, S&P 500 earnings are expected to rise 7.3% in Q3 for its second straight gain and its biggest since Q4-2021. That compares to a 3.6% rise in Q2, a 1.6% decline in Q1-2023, and the 7.4% drop in Q4-2022. The typical earnings surprise hook again in Q3 could easily result in double-digit percentage y/y growth for the S&P 500 ex-Energy on a pro forma basis. Here's the four sectors expected to report a y/y earnings decline in Q3: Energy (-37.0%), Materials (-20.2), Health Care (-9.6), and Real Estate (-6.8).
(5) Y/Y growth streaks: winners and losers. In Q3-2023, the S&P 500 is expected to break its three-quarter string of y/y earnings declines on a frozen actual basis. The Industrials sector remains on a strong positive earnings growth path, with Q3-2023 on track for its 10th straight quarter of growth. Consumer Staples and Financials are expected to rise for a third straight quarter, followed by two quarters of growth for Communication Services and Information Technology. Materials is expected to mark its fifth straight y/y decline in quarterly earnings, followed by Health Care at four quarters (Fig. 7).
What’s Up With Earnings?
September 20 (Wednesday)
Check out the accompanying pdf and chart collection.
Executive Summary: Today, we examine the flight paths of S&P 500 companies’ revenues, earnings, and profit margins through Q2’s earnings season. … Forward revenues per share rose to a record high the week before last, and analysts project revenues growth more than doubling next year to nearly 5%. … Forward earnings rose to a record high last week; it does a good job of predicting the earnings outlook during economic expansions. … The forward profit margin has edged up since bottoming in March, after dropping from last year’s record high. … All things considered, we’re sticking with our upbeat earnings forecasts and S&P 500 price targets for now.
Earnings I: The Revenues Story. Joe reports that S&P has released Q2 revenues data for the S&P 500. S&P also compiles comparable earnings series. While for our purposes, Joe and I prefer to monitor the operating earnings-per-share data compiled by I/B/E/S, let’s review the S&P data, starting with revenues then proceeding to earnings:
(1) S&P 500 revenues per share & inflation. There has been no recession in S&P 500 revenues per share since the first half of 2020, when the pandemic lockdowns caused a 14.6% drop in this series from Q4-2019 through Q2-2020 (Fig. 1). Back then, it bottomed at $315.61 per share. Since then, it is up 46.4% through Q2-2023 to a record $462.16 per share.
S&P 500 revenues per share was up 7.1% y/y through Q2-2023 (Fig. 2). Of course, business sales have been boosted by rapidly rising inflation since late 2021. Inflation-adjusted S&P 500 revenues (using the GDP deflator) is up 25.9% since it bottomed in Q2-2020 and up 3.4% y/y through Q2-2023 (Fig. 3).
While S&P 500 revenues per share rose 7.1% y/y, aggregate revenues rose 6.1% y/y (Fig. 4). Joe derives the latter by multiplying S&P 500 revenues per share by the S&P 500 divisor for each quarter.
(2) S&P 500 aggregate revenues & business sales of goods. In current dollars, the trend and the cycles in S&P 500 aggregate revenues closely track those of nominal GDP (Fig. 5). Interestingly, they track business sales of goods (a.k.a. manufacturing shipments plus wholesale and retail sales) much better, even though S&P 500 revenues includes the sales of both goods and services (Fig. 6). That’s because the business cycle is usually more pronounced for producers and distributors of goods than providers of services.
The y/y growth rate in business sales of goods closely tracks the y/y growth rate of S&P 500 revenues (Fig. 7). The former is a monthly series. So it is usually a good leading indicator of the quarterly revenues series. It hasn’t been so good since the second half of last year. That’s because the rolling recession in the goods sector has been more than offset by strength in services. The monthly series was down 1.2% y/y through July, while S&P 500 aggregate revenues was up 6.1% during Q2.
Not surprisingly, the y/y growth rate in aggregate revenues closely tracks the y/y growth rate in nominal GDP of goods (Fig. 8). The former has been tracking better with the latter than with business sales of goods recently.
In the past, there wasn’t much of a correlation between the growth rates of aggregate revenues and nominal GDP of services, which was much less volatile than the growth rate of nominal GDP of goods (Fig. 9). Of course, since the pandemic, the services sector has been much more volatile than usual and more closely correlated with aggregate revenues.
(3) S&P 500 revenues per share and forward revenues. A much better coincident indicator of quarterly S&P 500 revenues per share is weekly S&P 500 forward revenues per share (Fig. 10). The series is monthly from January 2004 through December 2005, then weekly. It doesn’t catch every zig and zag in the quarterly series, but it certainly gets the trends and cycles right. It rose to a record high during the September 7 week.
Forward revenues per share is a time-weighted average of industry analysts’ estimates for the current and the coming years’ S&P 500 revenues (Fig. 11). As of the September 7 week, industry analysts expect that S&P 500 revenues per share will increase 2.2% this year, 4.8% next year, and 5.3% in 2025 (Fig. 12).
Earnings II: The Earnings Story. As noted above, in our work we tend to focus on S&P 500 operating earnings per share as reported by I/B/E/S rather than S&P. The big difference between the S&P and I/B/E/S measures of operating earnings per share is that the former determines which one-time items to exclude (or include) from reported earnings, while the latter is based on majority rule. In other words, it is based on the industry analysts’ consensus on operating earnings, which tends to be the same as the operating numbers reported by the companies in their quarterly filings.
That allows us to calculate the weekly series on S&P 500 forward operating earnings using the analysts’ consensus earnings estimates for the current and the coming years. Now let’s have a look at the latest earnings data:
(1) Earnings per share. S&P 500 operating earnings per share edged up 2.7% q/q during Q2, suggesting that earnings bottomed during Q1 (Fig. 13). On a y/y basis, it was still down 5.4% during Q2 (Fig. 14). But these comparisons should start to turn positive over the final two quarters of this year.
(2) Forward earnings per share. S&P 500 forward earnings rose to a record high during the September 14 week (Fig. 15). It closely tracks the actual quarterly operating earnings data as reported by I/B/E/S. The weekly forward series tends to lead the quarterly actual one by about a year (Fig. 16). So it is a great predictor of the outlook for earnings during economic expansions. However, it consistently fails to anticipate recessions. If you agree with us that a recession isn’t very likely over the next 52 weeks, then the prospect for earnings is bright over this period ahead.
(3) Annual consensus earnings estimates and growth rates. During the week of September 14, industry analysts estimated that earnings per share will be $221.37 this year, $247.94 next year, and $278.28 in 2025 (Fig. 17). They are expecting earnings per share to grow 1.1% this year, 11.6% next year, and 12.5% in 2025 (Fig. 18).
Earnings III: The Profit Margin Story. The weakness in earnings in recent quarters has been attributable to the decline in the S&P 500 profit margin per share since revenues have been trending upward to new record highs (Fig. 19 and Fig. 20).
The quarterly profit margin peaked at a record high of 13.7% during Q2-2021. It peaked last year at 13.4% during Q2. It then fell to 11.5% during Q4-2022. It edged up to 11.8% during Q2.
The forward profit margin peaked at a record 13.4% during the June 9 week last year. It bottomed at 12.3% during the March 30 week this year and edged up to 12.7% during the September 7 week.
Earnings IV: Their Forecasts & Ours. Joe and I promised to revisit our earnings outlook following the release of Q2’s results. We thought we might have to lower our projections, which have been among the most optimistic on Wall Street. We’ve decided to stay with them for now. Consider the following:
(1) Revenues. Joe and I are predicting that S&P 500 revenues per share will increase 4.0% this year, 4.0% next year, and 3.9% in 2025 (Fig. 21). We obviously are not expecting an economy-wide recession this year, though we did increase our subjective odds of one before the end of next year to 25% from 15% on Monday. Industry analysts have been raising their S&P 500 revenues-per-share estimates in recent weeks, and they almost match our projections.
(2) Earnings. The same can be said about their estimates for S&P 500 earnings-per-share and ours (Fig. 22). We are sticking with $225 this year (up 3.2% y/y), $250 next year (up 11.1% y/y), and $270 in 2025 (up 8.0% y/y).
(3) Profit margin. Industry analysts also recently have been raising their profit margin forecasts (implied by their earnings and revenues forecasts), which now are up to our forecasts (Fig. 23). We are projecting 12.3% this year, 13.2% next year, and 13.7% in 2025. Our optimism is substantially based on our view that productivity growth is likely to rebound over the rest of the decade.
(4) Forward earnings. Again, we are happy to report that S&P 500 forward earnings per share has risen to a record high of $240.28 during the September 14 week; it’s getting closer to our year-end estimate of $250 (Fig. 24). Our year-end forward earnings estimates for 2024 and 2025 are $279 and $290.
(5) S&P 500 valuation. Joe and I expect the S&P 500 forward P/E to range between 16.0 and 20.0 through the end of 2025 (Fig. 25). The historically high upper end of the range assumes that the MegaCap-8 stocks will continue to account for about 25% of the S&P 500’s market capitalization, and that they will continue to sport high valuation multiples.
(6) S&P 500 price targets. Applying these valuation ranges to our forward earnings projections yields the following S&P 500 stock price index ranges: 2023 (4000-5000), 2024 (4320-5400), and 2025 (4640-5800) (Fig. 26).
For those of you who prefer point estimates, here are our year-end forecasts for the S&P 500: 2023 (4600), 2024 (5400), 2025 (5800).
China: Party Tricks
September 19 (Tuesday)
Check out the accompanying pdf and chart collection.
Executive Summary: China’s recent efforts to stimulate its economy are likely too little too late after a decade of capitalism-eroding policies under President Xi Jinping, a huge property bubble, and a rapidly aging population. August’s economic data do show green shoots of revived growth from the stimulative policy initiatives recently enacted, but not convincingly enough to reinvigorate China’s stock market or global commodity markets. The copper price in particular is highly sensitive to China’s economic situation, but its range-bound price action suggests Dr. Copper is not impressed. … Moreover, China’s forward revenues and earnings metrics have been trending downward since 2014, suggesting that China peaked back then.
Weekly Webcast. If you missed Monday’s live webcast, you can view a replay here.
China I: Bad Policies. The Chinese Communist Party (CCP) has an implicit deal with the citizens of China. The CCP will deliver widespread economic prosperity with lots of jobs and rising real incomes. The citizens will accept less freedom under the authoritarian rule of the CCP. Their deal with the devil has worked so far. Never in the history of the world has the standard of living of so many people improved in such a short time as it did in China from the 1980s through the mid-2010s.
Ironically, much of China’s prosperity during that period occurred when the CCP turned less authoritarian. The party allowed capitalism to flourish for a while, and so did the Chinese economy. However, in recent years, under President Xi Jinping—who has served as the undisputed supreme leader since 2012—the CCP has turned increasingly authoritarian and hostile to capitalism.
That transition has been occurring just as the Chinese economy has started to sputter. That’s happening for several reasons:
(1) Geopolitical tensions & trade. The CCP under President Xi has turned increasingly bellicose in matters of international relations. The government has been building islands in the South China Sea to claim territorial sovereignty over more of the surrounding waters. The Chinese government has ignored the protestations of neighboring nations and others that dispute the practice as an illegal threat to international commerce.
The disruptions that occurred to global supply chains during the pandemic triggered a move toward onshoring that has weighed on China’s exports to the rest of the world. Rising political tensions between China and the West over Taiwan and China’s unfair business practices have convinced many foreign businesses that China isn’t a reliable trading partner.
China’s exports in yuan terms have been essentially flat since early last year (Fig. 1). China’s imports have been flat since late 2020, reflecting the weakness of domestic consumption and the lack of stimulus from exports. The weakness in exports has been most pronounced for those going to advanced economies (Fig. 2). Some of that weakness was offset by stronger exports to emerging economies.
(2) Anti-business policies. Since 2021, Xi has been promoting a vision for the country he calls “common prosperity.” It’s a progressive framework that emphasizes reducing inequality, balanced regional development, and a healthy “spiritual and moral culture.” Since then, the CCP imposed a rash of new regulations and fines on private capital and technology companies.
On July 1 of this year, the Chinese government substantially broadened its law on espionage. The changes “have raised legitimate concerns about conducting certain routine business activities, which now risk being considered espionage,” Craig Allen, president of the US-China Business Council, recently blogged. “Confidence in China’s market will suffer further if the law is applied frequently and without a clear, narrow and direct link to activities universally recognized as espionage.”
(3) Demographic issues. The CCP’s disastrous one-child policy, imposed from 1979 to 2015, has resulted in a rapidly aging demographic profile that is now weighing on economic growth. We’ve often described China as the world’s largest nursing home. China’s population is aging faster than those of nearly all other countries in modern history.
A March 22 article in Nikkei Asia reported: “By 2035, an estimated 400 million people in China will be age 60 and over, representing 30% of the population, according to the government’s own projections. And the ratio of old to young is expected to rapidly grow more unbalanced after deaths outnumbered births last year, for the first time since 1961.” China’s population declined in 2022, plummeting by 850,000 to 1.412 billion (Fig. 3). China’s fertility rate slipped to below 1.1 in 2022. A rate of 2.1 is required to sustain a population.
The rapidly aging population is weighing on inflation-adjusted retail sales in China. The 12-month average of the yearly percent change in real retail sales exceeded 10% from March 2005 through December 2014 (Fig. 4). It fell to 5.1% during December 2019, just before the pandemic. It’s been fluctuating around zero since then. Older people with a grown child don’t spend much money. Neither do married young adults, who must care for their older parents and maybe one child.
(4) Property bubble. For many years, one of the major drivers of Chinese economic growth was the property boom. The provincial governments sold land to developers, who built brand-new cities full of brand-new apartments, which were purchased as investments by Chinese households and often left vacant. The local governments used the revenues to build public infrastructure. That resulted in lots of economic growth and probably the biggest property bubble in history. The air is coming out of the bubble as the Chinese government scrambles to keep it from bursting. Developers are no longer buying more land, so the local governments are seeing their revenues dry up.
(5) Youth unemployment. In August, the Chinese government, rather than report an expected seventh consecutive monthly increase in youth unemployment, opted to suspend release of the information. The unemployment rate among 16- to 24-year-olds in urban areas hit 21.3%, a record high, in June and has risen every month this year through June. An August 15 article in The New York Times reported: “On top of the damage inflicted on the job market during the pandemic, the government cracked down on the country’s technology, real estate and education industries, where educated young Chinese had flocked for jobs. The regulatory actions caused hundreds of thousands of layoffs and left companies and investors more cautious about expanding their businesses. When businesses are wary, hiring typically suffers.”
China II: Same Old Tricks. Under pressure to get the economy growing faster, the Chinese government and related institutions have taken many small steps to encourage borrowing and lending and to bolster private industry:
(1) The government announced on September 4 plans to set up an agency to coordinate policies across various government bodies to help develop the private economy. This is quite a reversal from the Chinese government’s stance toward private companies and financial markets in 2021, when it blocked the IPO of Ant Group. Additional moves that China made recently to facilitate financial market activity include halving the stamp duty, a tax charged on shares traded; restricting share sales by major shareholders under certain circumstances; and lowering margin requirements.
(2) To boost the property sector, the People’s Bank of China (PBOC) and other agencies lowered the down payment for first-time home buyers to 20% and for second-time purchasers to 30%. Chinese state-owned banks are expected to help borrowers by lowering interest rates on existing mortgages or replacing them with new mortgages. Chinese banks cut deposit rates to encourage savers to become spenders, and the one-year loan prime rate was lowered by 10 basis points to 3.45% last month.
The PBOC’s ability to cut rates is somewhat limited if it aims to keep the yuan from falling below its current decade-low level. The yuan traded at 7.3 to the dollar yesterday, down from its recent peak of 6.7 and its lowest level since early November 2022 (Fig. 5). It rebounded on Friday following a slew of better-than-expected economic indicators, as discussed below.
(3) Regulators also have lent a hand by cutting reserve ratios. At large depository institutions, the reserve ratio has fallen to 10.50% from 12.00% two years ago (Fig. 6). The latest cut of 25bps occurred on Thursday.
By cutting reserve requirements, the PBOC aims to stimulate more bank lending. That doesn’t mean that banks haven’t been lending. On the contrary, over the past 12 months through August, bank loans are up 22.6 yuan, or $3.2 trillion (Fig. 7). Indeed, China’s economic growth since the end of the Great Financial Crisis has been fueled by lots of debt, especially bank loans. They’ve more than quintupled over the past 13 years, from $6.1 trillion at the start of 2010 to a record $32.4 trillion through August (Fig. 8). Over this same period, US bank loans only about doubled, from $6.4 trillion to $12.2 trillion through July.
China III: Green Sprouts vs the Red Metal. The latest batch of Chinese economic indicators, for August, suggests that the government’s stimulative policy initiatives may be providing a lift to the economy. While these green shoots are sprouting, Professor Copper, the red metal with a PhD in economics, isn’t convinced that the outlook for China’s economy is improving much if at all. The nearby futures price of copper has been trading just below $4.00 per pound since early this year (Fig. 9).
The government’s stimulus program announcements haven’t caused China’s MSCI stock price index in yuan to rally. Investors may be skeptical (as we are) that the CCP’s old tricks for boosting the Chinese economy will work. Perhaps Friday’s batch of economic indicators will rally stocks in the coming days and weeks.
Let’s review the latest batch of economic indicators:
(1) Industrial output rose 4.5% y/y in August, accelerating from the 3.7% pace in July (Fig. 10). The growth marked the quickest pace since April. It suggests that Q3’s real GDP will be up around 5.0% y/y.
(2) Retail sales also increased faster in August, at a pace of 4.6%, aided by the summer travel season; it was the quickest growth since May. That compared with a 2.5% increase in July. Inflation-adjusted retail sales rose 4.5% y/y (Fig. 11).
(3) Separate commodities data showed China’s primary aluminum output hit a record-monthly high in August, while oil refinery throughput also rose to a record.
On the other hand:
(4) Fixed-asset investment expanded at a lackluster pace of 3.2% during the first eight months of 2023 from the same period a year earlier, versus 3.4% in the first seven months.
(5) For August, property investment extended its fall, down 19.1% y/y from a 17.8% slump the previous month, according to Reuters calculations.
(6) Government revenue from state land sales fell for the 20th consecutive month in August, finance ministry data showed on Friday, weighing on the already debt-laden local governments’ finances.
(7) US and European firms are shifting investment away from China to other developing markets, a report from Rhodium Group showed, with India receiving most of this redirected foreign capital, followed by Mexico, Vietnam, and Malaysia. The September 13 Reuters reported: “These companies are turning their backs on the world’s second-largest economy even as its share of global growth continues to increase, highlighting how concerns over China’s business environment, economic recovery and politics weigh heavy on the minds of foreign investors.”
The value of announced US and European greenfield investment capital flowing into India shot up by $65 billion, or 400%, from 2021 to 2022, the report said, while investment into China dropped to less than $20 billion last year, from a peak of $120 billion in 2018.
(8) China’s CPI edged up by 0.1% y/y in August, reversing course slightly from a fall of 0.3% y/y in July (Fig. 12). Meanwhile, the drop in China’s PPI narrowed from -4.4% in July to -3.0% in August. The PPI has fallen for 11 months in a row, reflecting the weakness in China’s economy.
By the way, the China and US CPI inflation rates are highly correlated (Fig. 13). The same can be said about the two countries’ PPIs (Fig. 14). Some of America’s inflation is made in China, which has tended to have a disinflationary impact on the US.
China IV: Depressed Forward Metrics. Did China peak in 2014? The forward revenues of the China MSCI has been on a downward trend since 2014 after it soared dramatically during the previous 10 years (Fig. 15). The forward earnings of the China MSCI soared after the country entered the World Trade Organization in late 2001 (Fig. 16). This series has flattened since late 2011. The China MSCI stock price index rallied along with earnings from 2003 through 2007 (Fig. 17). It has been essentially flat, though volatile, since then.
Inflation: Twin Peaks Again?
September 18 (Monday)
Check out the accompanying pdf and chart collection.
Executive Summary: With oil prices spiking again, we can’t help but think of the 1970s when two peaks in oil prices fueled the Great Inflation and caused two recessions. We don’t see history repeating in this case, however. The big difference this time is the disinflationary tech-driven productivity boom we expect this decade. … But we are concerned enough about the oil price spike, the ballooning federal deficit, and other recent developments to return our subjective odds of a recession before year-end 2024 to 25% from 15%. Notably, we don’t view that as the most likely scenario but as a risk to our happier rolling recovery outlook.
YRI Weekly Webcast. Join Dr. Ed’s live webcast with Q&A on Mondays at 11 a.m. EST. You will receive an email with the link one hour before showtime. Replays of the weekly webcasts are available here.
US Economy I: Raising Odds of a Recession a Tad. On July 31, Debbie and I lowered our odds of a recession. We wrote: “Our script has played out as expected so far. The soft-landing scenario looks increasingly like a no-landing one. As a result, we are raising the odds of a no-landing scenario from 75% to 85% and lowering the odds of a hard-landing scenario from 25% to 15% through the end of next year.” On August 21, in response to the backup in bond yields, we wrote: “We currently are still assigning 85% odds to a no-landing scenario through the end of next year and 15% to a hard-landing one. However, we are leaning toward lowering the former and raising the latter.” Today, in response to several new developments, we are raising the odds of a recession before the end of next year from 15% to 25%.
We remain in the rolling-recession-and-recoveries camp for now. However, the 30% increase in a barrel of Brent crude oil since June 27 is a concern (Fig. 1). It has resulted in an 8.2% increase in the retail price of gasoline since late June to $3.94 during the September 11 week (Fig. 2). If the price of oil breaches $100 per barrel and the price of gasoline rises solidly above $4.00 a gallon and both remain above those levels for a while, they could trigger a renewed wage-price spiral and higher inflationary expectations.
That scenario would be reminiscent of the 1970s, when the first wave of inflation was followed by a second wave and both triggered recessions (Fig. 3). That is not the scenario we consider most likely, but it is the risk to our happier outlook. It’s partly because of this risk that we’ve raised our subjective odds of this alternative scenario to 25%.
US Economy II: Dueling Decades. Now consider the following comparison of the 1970s and the 2020s (so far):
(1) The dollar. The Great Inflation of the 1970s actually started during the second half of the 1960s. It was triggered by President Lyndon Johnson’s decision to deficit-finance the Vietnam War rather than to increase taxes to fund the war. The same can be said about his Great Society initiative. A result of this guns-and-butter approach to fiscal policy was higher inflation.
President Richard Nixon continued that approach during the early 1970s and exacerbated inflation by closing the gold window on August 15, 1971, which caused the dollar to depreciate significantly. The weaker dollar boosted commodity prices and caused OPEC to drive oil prices higher during the 1970s.
This time, several rounds of fiscal stimulus programs combined with ultra-accommodative monetary policies caused a demand shock that overwhelmed supplies, unleashing the current bout of inflation. The programs presumably were aimed at offsetting the negative impact of the pandemic on workers. More accurately, they were another example of Washington’s politicians “never letting a good crisis to go to waste” (in the words of Rahm Emanuel, spoken when he was chief-of-staff in the Obama administration).
What’s different this time is that the US dollar is strong. The Fed has been more aggressive in tightening monetary policy in response to inflation than the other major central banks. Also, the US economy is performing much better than the other major economies, which likewise supports the dollar.
(2) Oil & food prices. We have no doubt that the Great Inflation of the 1970s was caused by the two spikes in the price of oil during 1973/74 and again in 1979, both triggered by wars in the Middle East (Fig. 4). The price of a barrel of West Texas Intermediate crude oil jumped 213% and 166% during these two episodes. Both caused recessions.
This time, the price of a barrel of Brent crude oil jumped 46% during H1-2022, triggered by Russia’s invasion of Ukraine. But there was no recession. The rise in the price of oil so far this year isn’t likely to cause a recession either unless it is the start of a major spike resulting from another geopolitical crisis, particularly in the Middle East. That possibility cannot be ruled out given the hostilities between Israel and Iran.
The twin peaks in the headline CPI inflation rate during the Great Inflation of the 1970s were 12.3% and 14.8% (Fig. 5). Last year, it peaked at 9.1%. The twin peaks in the core CPI inflation rate during the 1970s were 11.9% and 13.6%. Last year, it was 6.6%.
The twin peaks in the CPI energy component during the 1970s were 33.7% and 47.1%. Last year’s peak was 41.6%. The twin peaks in the CPI food component were 20.3% and 13.1% during the 1970s, while the peak was 11.4% last year.
(3) Other prices. This time, supply-chain disruptions triggered a much greater spike in the inflation rate for durable goods (Fig. 6). The CPI durable goods inflation rate peaked at 14.3% and 11.3% in the 1970s. This time, it peaked at 18.7% last year and plunged much faster than during the 1970s. It was back down to -2.0% y/y through August, in the range of the mildly deflationary readings prior to the pandemic. This component of inflation has turned out to be quite transitory this time, while it was more persistent during the 1970s.
The jury is out on the CPI for nondurable goods, including food and energy. It peaked at 16.2% last year, comparable to the levels hit during the twin peaks of the 1970s. It too fully reversed last year’s spike. But oil prices have been rising again in recent weeks.
During the 1970s, services inflation was especially persistent, with three consecutively higher peaks at 8.5% (in 1970), 11.7% (in 1975), and 18.1% (in 1980). This time, so far, the CPI services inflation rate peaked at 7.6% last year and declined to 5.4% in August. Exacerbating the services inflation problem during the 1970s was a wage-rent inflation spiral (Fig. 7 and Fig. 8). This time, both wage and rent inflation rates peaked last year (at 7.0% and 8.9%, respectively, and are down to 4.5% and 8.1%). The rent component of the CPI is on track to moderate significantly, reflecting the trend in current rental leases.
(4) Wages & union contracts. Will wage inflation moderate along with rent inflation this time? Currently, union members make up a much smaller percentage of the labor force. The available data show membership is down to 6.0% of private-sector wage and salary employment from 16.8% in 1983 (Fig. 9). Nevertheless, today’s unions have been energized by stagnating real wages. They’ve achieved sizeable compensation gains in recent negotiations.
(5) Productivity & technology. The big difference we are forecasting between now and then is that productivity growth, which collapsed during the 1970s, will be improving significantly over the rest of the decade (Fig. 10). The average annualized five-year growth rate of productivity peaked at a record high of 4.5% during Q1-1966, then proceeded to plunge to a record low of 0.1% during Q3-1982. This time, productivity growth bottomed at 0.4% during Q4-2015. It rose to 1.4% during Q4-2019 just before the pandemic. It soared during the lockdowns and fell when quits rose sharply during the pandemic. Now it is settling down, with a 1.6% increase during Q2-2023.
But we expect that our measure of productivity growth will resume its pre-pandemic ascent to 4.0% by the end of the decade. That may seem farfetched, but that would be consistent with the peaks in the previous three productivity growth cycle booms. This time, we expect to see the plethora of technological innovations boosting productivity in many more companies in many more industries than ever before. In this sense, all companies are now technology companies.
The collapse in productivity growth combined with rapidly rising compensation caused unit labor costs inflation (ULC) to soar during the 1970s (Fig. 11 and Fig. 12). There actually were three peaks in this inflation rate, which closely tracks the headline CPI inflation rate. This time, ULC inflation peaked last year at 7.0% y/y during Q2 and fell to 2.5% during Q2-2023. The headline CPI inflation rate peaked at 9.1% last summer and fell to 3.7% during August.
(6) Bottom line. We’ve raised our subjective odds of a recession from 15% to 25%. The recent rise in the price of oil is somewhat reminiscent of what happened during the Great Inflation of the 1970s. So is the push by labor unions for higher wages to offset the rapid rise in the cost of living. Nevertheless, we don’t expect a replay of the 1970s. In our most likely scenario, productivity growth resumes its upward trend that started at the end of 2015, which was interrupted during the pandemic, and overall compensation inflation continues to moderate. So we don’t expect to see a second peak for inflation that would force the Fed to cause a recession to bring inflation down.
It isn’t just the recent upturn in oil prices that’s caused us to raise the recession warning flag a bit higher. We are also concerned about the widening federal budget deficit, with the government’s net interest outlays soaring. Bond yields might have to rise higher to attract buyers for the mounting supply of Treasuries, especially if there is an inflation scare along the way. More immediate concerns are the United Auto Workers’ strike and the likelihood of a government shutdown at the end of the month.
There’s never a dull moment in our business. Actually, there is occasionally: When the S&P 500 rose at the end of July to our year-end target of 4600, we predicted that the remainder of this year might be a dull one for stock prices, with the index still at 4600 by the end of the year. So far, so dull.
Transports Flying Into Headwinds
September 14 (Thursday)
Check out the accompanying pdf and chart collection.
Executive Summary: It’s a been train wreck: Investors have been bailing on the S&P 500 Transportation index in recent weeks, after sending it northward for most of the year. Jackie examines the business pressures they’ve been reacting to, including lighter loads to haul in the wake of the inventory correction at a time of increased fuel and labor costs. … Also: May the best battery developer win EV market dominance. Our Disruptive Technologies segment takes a look at where the top contenders are in this high-stakes race.
Industrials: Transports in the Slow Lane. The S&P 500 Transportation stock price index was gaining altitude ytd through the end of July; then its performance stalled. Demand for transportation services softened as US imports and exports fell, dragged down by consumers’ preference to spend more on services and less on goods in the wake of the Covid pandemic. The behavioral change has resulted in a US inventory correction that’s been exacerbated by the economic slowdowns in China and other economies. Making matters worse for the transporters of goods, costs have increased as fuel prices and employee wages have risen.
The S&P 500 Transportation index has fallen 10.7% from the end of July through Tuesday’s close, lagging far behind the S&P 500’s 2.8% decline over the same period. As a result, the S&P 500 Transportation index’s ytd gain, which stood at 15.8% on July 31, has shriveled to 3.5% as of Tuesday’s close.
Here’s the performance derby for the industries in the S&P 500 Transportation index from July 31 through Tuesday’s close: Passenger Airlines (-13.5%), Air Freight & Logistics (-12.9), Rail Transportation (-9.4), and Cargo Ground Transportation (-3.0). Each of the industries fell more than the S&P 500’s 2.8% decline over the same period.
Here’s the performance derby for the industries in the S&P 500 Transportation index from August 1 through Tuesday’s close: Passenger Airlines (-13.5%), Air Freight & Logistics (-12.9), Railroad Transportation (-9.4), and Cargo Ground Transportation (-3.0).
We’ll be watching for signs that the inventory correction has run its course. Perhaps by next spring, consumers will store their suitcases away and start spending more of their incomes on goods once again. Meanwhile, let’s look at the business pressures that have put the brakes on transportation stocks:
(1) Airlines lose altitude. With consumers traveling at home and abroad, the S&P 500 Passenger Airlines industry stock price index took off as the year started and gained 37.4% at its peak on July 11 of this year. The industry’s stock price index has since lost altitude, though it remains up 9.2% ytd (Fig. 1).
Like other transport industries, airlines are facing higher expenses. American Airlines and Spirit Airlines warned on Wednesday that higher fuel costs and wages will eat into Q3 profits. American cut its Q3 earnings estimate to 20-30 cents a share, down from its previous forecast of 95 cents a share.
Brent crude oil futures have risen from a low this year of $71.84 per barrel to a recent high of $92.06 (Fig. 2). Wages in the industry are also climbing due to a shortage of pilots and the renewed confidence of unions. “In January, JetBlue agreed to a two-year contract extension that provided a compensation increase of 21.5% over 18 months. In March, Delta agreed on a pilot contract that increases wages 34% by 2026. In July, United Airlines pilots agreed to a pilot contract that would increase pay up to 40% over four years. And [in August], American agreed to a similar 40% pay boost over its new four-year contract,” an August 25 Seattle Times article reported. Most recently, Alaska Airlines pilots received an 11.2% pay increase on September 1 because their contract stipulates the airline’s wages must keep pace with wages at rival airlines.
The airline industry has also struggled to buy enough planes to meet travelers’ desire for post-pandemic revenge travel. The industry’s capacity constraints increased this week for some airlines when RTX announced it would have to ground 600-700 Airbus jets to conduct quality inspections of Pratt & Whitney Geared Turbofan engines due to a manufacturing flaw, a September 12 Reuters article explained.
The RTX news follows Boeing’s ongoing difficulties ramping up output of new planes. The manufacturer’s deliveries dropped to 35 planes in August from 43 planes in July and 60 in June, as it has been fixing a manufacturing defect on the 737 Max. Despite the setback, Boeing’s deliveries this year are still an improvement over 2022’s deliveries, which were hampered by supply-chain and production difficulties.
Analysts expect the S&P 500 Passenger Airlines industry’s earnings growth to slow to 10.4% in 2024, down from the 165.3% surge expected in 2023 when the industry was rebounding from pandemic-related losses (Fig. 3). Notably, analysts have been trimming their 2024 earnings estimates for the industry, which had indicated growth as high as 43.8% in October 2022. The cyclical industry’s forward P/E has fallen to a record low of 5.9 as its earnings have recovered (Fig. 4).
(2) Trucking along. The S&P 500 Cargo Ground Transportation stock price index has been a top performer this year, climbing 32.7% ytd through Tuesday’s close (Fig. 5). The index has been boosted by Old Dominion Freight Line’s stock, which has risen 48.7% ytd, as investors hope it will benefit from the bankruptcy of its less-than-truckload competitor Yellow. Old Dominion has bid $1.5 billion for Yellow’s North American real estate holdings.
Shares of the index’s other constituent, J.B. Hunt Transport Services, haven’t fared as well, rising 4.3% ytd through Tuesday’s close. Hunt isn’t a large player in the less-than-truckload market, so it isn’t expected to benefit as much from Yellow’s bankruptcy. Hunt and others are facing a market where trucking demand has fallen as consumers slowed their goods purchasing, forcing retailers to shrink bloated inventories.
Business inventories stopped seeing sharp increases at the end of 2022 and were up just 2.2% y/y in June, the weakest since February 2022 (Fig. 6). Likewise, trade through the West Coast ports has slowed, hurt by US inventory destocking and softness in global economic growth. Outbound plus inbound West Coast port container traffic fell 19.0% y/y in July, and it declined 22.5% from its peak in June 2021 based on 12-month data (Fig. 7). Likewise, the real dollar value of exports and imports has been flattish since it peaked in March 2022 (Fig. 8).
The ATA Truck Tonnage index has fallen 3.4% from its recent peak in September 2022 and declined 0.7% y/y in July (Fig. 9). Softer demand for trucking services is reflected in the recent sharp 9.5% drop in purchases of new medium and heavy trucks since May and the 12.4% y/y decline in prices for trucking services (Fig. 10 and Fig. 11). The recent loss of truck transportation jobs may have been amplified by the Yellow bankruptcy (Fig. 12).
(3) Rails at a crossing. The S&P 500 Rail Transportation industry stock price index is the only industry in the transport area that’s in negative territory ytd, falling 3.0% through Tuesday’s close (Fig. 13). The rail index has been dragged down by a 19.4% ytd decline in Norfolk Southern’s share price, while CSX and Union Pacific shares have logged flattish performances over the same period (-1.3% and 3.3%, respectively).
Norfolk Southern has been cleaning up hazardous materials spilled in an Ohio train derailment, which the company estimates could cost $803 million. Costs could rise further if additional legal costs, fines, or penalties arise.
Fundamentally, the rail industry has faced the same headwinds that the truckers face: inventory destocking and less trade have meant less stuff to move. Intermodal railcar loadings have fallen 4.2% ytd and 14.5% since the late January 2021 peak, based on the 26-week average (Fig. 14). The good news: Loadings ticked up ever so slightly in August, boosted by a jump in shipments of chemicals and petroleum products, nonmetalic minerals, metals and products, and waste and scrap (Fig. 15).
Analysts are forecasting a 3.0% decline in rail revenues this year followed by a 3.3% increase in 2024 (Fig. 16). Earnings are expected to follow a similar pattern, falling 6.3% in 2023 and rising 9.6% in 2024 (Fig. 17). The S&P 500 Rail Transportation industry’s profit margins have been under pressure, falling from a peak of 30.4% in December 2021 to a three-year low of 26.9% (Fig. 18). But investors may be looking ahead to better times, as the industry’s forward P/E has risen to 16.8 from a low of 15.2 earlier this year (Fig. 19).
(4) Less freight and logistics. Inventory destocking and less trade also mean there’s less freight to ship and logistics to manage. The S&P 500 Air Freight & Logistics stock price index has gained only 3.7% ytd through Tuesday’s close (Fig. 20). The stocks in the index have had very different ytd returns: FedEx (45.2%), Expeditors International of Washington (12.1), C.H. Robinson Worldwide (-5.0), and UPS (-9.9).
FedEx shares have benefitted from a company-wide restructuring pushed by activist investor D.E. Shaw. The company’s ground and express delivery units were combined among other cost-saving moves. Conversely, its competitor UPS has struggled with union negotiations this summer that resulted in higher pay for employees and sent shares tumbling. The industry’s earnings are expected to fall 18.3% this year after declining by 5.2% last year. But analysts are optimistic that earnings will jump 14.6% in 2024 (Fig. 21).
Disruptive Technologies: The Race for Stronger Batteries. We’ve long believed that the winner in the race for electric vehicle (EV) dominance would begin and end with who has the best battery at the best price. So far, Tesla has passed that test, with cars that can drive for 300-400 miles on a charge. But scientists are developing new batteries that will add hundreds of miles to a car’s driving range on a single charge. Here’s a look at who’s making progress:
(1) 900 miles from Toyota. Toyota believes it can build a solid-state battery that delivers 900 miles of range. That’s quite a claim from a company that until now has sold hybrid cars but shunned fully electric models. Getting there will be a winding road. In 2026, the company plans to produce a lithium nickel cobalt manganese battery that offers 504 miles of range, improving that to 660 miles of range by 2028. Research on the 900-mile battery is ongoing with no delivery date disclosed, a June 13 Electrek article reported.
(2) 600 miles from WeLion. Chinese battery manufacturer WeLion New Energy Technology (WeLion) has built a “semi-solid-state” battery that gives the Nio ES6 SUV, which is currently for sale, 578-miles of range on one charge, an August 7 PC Magazine article reported. Were it used in a lighter, more aerodynamic passenger car, the battery could provide 621 miles of range.
WeLion, which is building four plants in China, reportedly plans an IPO by 2025 to help fund its expansion. “Founder Li Hong said he was targeting a 20 times increase in annual revenue to CNY10bn (US$1.4bn) by 2025 and noted that, in the latest private funding round, the company was valued at CNY16bn” ($1.2 billion), an August 8 article in JustAuto reported. WeLion’s battery reportedly has a solid electrolyte, an anode made of a silicon graphite composite, and a cathode with ultra-high nickel content, a July 4 Electrive article noted.
(3) Don’t count out Tesla. Tesla has simplified its battery manufacturing process and developed the 4680 battery, which allows the company to promise a $25,000 car that offers a range of 250-300 miles. Most low-cost EVs have a range closer to 100-200 miles. It’s believed that the 4680 batteries will use new single-crystal cathodes that battery supplier LG Chem is developing. The new cathodes are expected to increase battery lifespan by more than 30% and increase the capacity of the battery by 10% compared to current batteries, a June 30 article by InsideEVs reported.
(4) Batteries taking flight. NASA is working on a solid-state battery for use in planes. Solid-state batteries are preferred because they don’t catch fire, as some liquid electrolyte batteries can when exposed to heat. “A prototype sulphur selenium battery developed by the project produces 500 watt-hours of energy per kilogram of battery. That is double the energy density of a standard lithium-ion battery,” an August 17 Euronews.green article reported. The battery also weighs less and can release energy more quickly than a standard battery.
AI For All
September 13 (Wednesday)
Check out the accompanying pdf and chart collection.
Executive Summary: The day will come when all companies use AI just as all use the Internet today. The efficiency gains will be profound. Jackie discusses the three main skill sets that AI brings to the table and looks at ways that companies in diverse industries have found to leverage AI to their advantage. … Also: Washington lawmakers have been holding forums and hearings to explore how best to regulate AI usage, with industry execs and the Biden administration participating. … And: Technology industries that are heavily exposed to AI have helped the S&P 500 Tech sector outperform all but one other sector so far this year.
Information Technology I: Everyone’s Adopting AI. News headlines are filled almost daily with the latest ways companies are deploying artificial intelligence (AI). Just this week, we learned that Tesla is creating its own GPU chips to power a supercomputer that will train the AI to be used in its fully autonomous vehicles. It’s quickly become clear that all companies will adopt AI in some form or another, just as all use the Internet today.
AI has shown its ability to create, analyze large amounts of data, and supply answers and education distilled from vast troves of information far faster than any human could hope to in their wildest dreams. The sheer operating speed at which AI can perform these three sets of tasks holds great potential to make companies of all kinds far more efficient than ever before.
Here’s just sampling of the many ways companies have found to leverage AI’s three key skill sets:
(1) AI creates art. One of the things that makes AI fascinating, albeit creepy at times, is its ability to replicate human creativity. When fed the right information, AI can create movies, develop video games, and edit films, as we discussed in the March 9 Morning Briefing.
AI is even being used to make music. Warner Brothers signed Noonoouri, a 19-year-old avatar in the metaverse who has modeled for Dior, appeared in Elle and Vogue, and signed with top modeling agency IMG Models Worldwide, a September 8 New York Post article reported. Most recently Noonoouri released an AI-generated song, “Dominoes,” and a music video. An AI program used the voices of two human musicians, Leonardo Martinelli and Rafa Caivano, who receive royalties from the song.
AI’s threat to human jobs is one of the reasons why Hollywood actors are on strike. They’re asking for tighter regulation of AI’s use in creative projects, among other things. Actors don’t want their likenesses used to train AI programs nor do they want be replaced by AI, a July 19 CBS article stated. They don’t want the studios to be able to scan a background actor, pay them for one day’s work, and then use the scan in future projects. The studios say they would only have the right to use the digital copy of the background actor in the picture for which the scan was taken; to use the digital copy again, they’d need the actor’s consent.
Marketing campaigns are tapping AI to create text, video, and images for emails, blog posts, social media, chatbots, websites, and SEO content, a September 6 Forbes article stated. Marketers use ChatGPT for human-like text, Copy.ai for natural language processing, Jasper.ai for copywriting, Peppertype.ai for articles, Lensa for image editing, and DALL-E and MidJourney for image generation.
One example: A marketing video created for the Forbes author’s Restaurant Furniture Plus business by Synthesia’s AI technology. “It was produced in a couple of minutes from a simple copy and paste of our About Us copy on our website without any human involvement or professional actors involved,” he stated. The impressive video can be accessed in the article and is worth checking out.
(2) AI analyzes data. For years, companies have digitized their operations and collected reams of data. Now they’re hoping AI will help them analyze that data and make operations more efficient. Logistics companies, pharmaceutical companies, and even bakers are adopting the technology.
In the logistics arena, Pando has developed a platform that takes “the fire hose of data that [companies] manage and [applies] AI to sync it all together in various ways. The AI can essentially tell companies how to run their logistics differently to boost efficiency and revenue while cutting costs,” a September 8 WSJ article reported. Reliable Robotics is developing autonomous cargo planes that fly with little or no pilot involvement, and Cheetah is developing demand forecasting and inventory prediction systems for restaurants.
The pharmaceutical industry is using AI to accelerate drug development. At LabGenius, a “machine learning algorithm designs antibodies to target specific diseases, and then automated robotic systems build and grow them in the lab, run tests, and feed the data back into the algorithm, all with limited human supervision,” an August 9 Wired article explained. Meanwhile, Bayer has partnered with Google Cloud’s Tensor Processing Units to conduct large quantum chemistry calculations and identify new insights. It will also use Google Cloud’s Vertex AI and Med-PaLM2 in clinical trials to improve analysis of the data, a September 4 Forbes article reported.
The construction industry is sending information from cameras and sensors to AI programs to coordinate when new crews and materials should arrive or to determine when a window’s placement doesn’t match the project’s blueprint, an August 15 NYT article reported. The Internal Revenue Service is using AI to help it pinpoint which of the nation’s largest, most complex partnerships should be examined, a NYT article on September 8 reported.
Even bakers are using AI. Bimbo Bakeries USA makes Sara Lee cakes, Entenmann’s donuts, and Thomas’ English muffins in 59 bakeries around the US. It improved its demand forecasting by using an AI model developed by Antuit.ai. The model uses data provided by planners and route operators around the country, as well as more unusual inputs like information about the weather, local events, store inventory, and point-of-sale data, a September 8 article in AutomationWorld reported. Now that’s sweet!
(3) AI teaches. Perhaps the best-known use of AI is as the provider of information, whether via search engine or chatbot. Again, the ability to quickly scan through more information than any human could ever read makes these AI wizards extraordinarily smart, when they aren’t hallucinating and providing inaccurate information.
JLL developed JLL GPT, a chatbot trained on commercial real estate data that JLL has been collecting for years that now can be used by JLL clients, an August 1 company press release stated.
Morgan Stanley and OpenAI developed a virtual assistant that will listen to conversations between financial advisors and their clients and can quickly serve up research or forms discussed or requested, a September 7 Reuters article reported. In the future, the virtual assistant should be able to create a meeting summary, draft an email with suggestions on next steps, or schedule a follow-up appointment.
Meanwhile, the Connecticut Department of Education and Varsity Tutors, an online tutoring company, are developing one AI program that will connect students to the right online tutor and another that will design lesson plans. Similar programs are being used in schools in Indiana, Ohio, Texas, Florida, and California, a September 6 article in the CT Mirror reported.
Information Technology II: AI Titans Go to Washington. Washington’s legislators are clamoring to be seen as knowledgeable about AI, as they talk about creating legislation that protects the public but doesn’t stifle innovation. There are no fewer than four hearings just this week on the subject, and we’d expect many, many more to follow in the months and years to come.
“We see AI as the perfect Washington topic: It is infinitely broad in scope and can fuel endless think tank panel discussions and Congressional hearings without resulting in any new law,” wrote Robert Kaminski of Capital Alpha Partners. “The momentum to ‘regulate AI’ looks to us like the same momentum to ‘regulate Big Tech’ we saw starting in 2017-18, and we carry the same skepticism that any legislation will pass.”
Perhaps that’s why tech CEOs have acquiesced to testify on multiple occasions. By doing so, they look cooperative yet risk little, as restrictive legislation is unlikely to pass.
The most high-profile hearing occurs today: Senate Majority Leader Chuck Schumer (D-NY) is holding the first in a series of meetings entitled “AI Insight Forum,” at which industry executives will examine how to regulate AI and prevent human extinction at the theoretical hands of AI. Tech titans in attendance are expected to include the CEOs of OpenAI, Google, IBM, Meta, Nvidia, and Tesla as well as Microsoft co-founder Bill Gates, a September 11 NBC News article reported. There will also be representatives from labor and human rights groups, the CEO of the Motion Picture Association, and the American Federation of Teachers.
Unfortunately, the AI Insight Forum is occurring behind closed doors, without any reason given for excluding the public and the press. Only a post-forum summary and information leaks, if any, will shed light on meeting proceedings.
Another AI-focused hearing titled “How are Federal Agencies Harnessing Artificial Intelligence?” is also being held on Wednesday by the House Oversight subcommittee, led by Representative Nancy Aace (R-SC), with Biden administration tech officials in attendance.
Two AI hearings were held on Tuesday, one focused on how AI companies can boost transparency and the public’s trust (“The Need for Transparency in Artificial Intelligence,” held by the Senate Commerce and Science subcommittee) and the other on AI oversight and regulation (“Oversight of AI: Legislating on Artificial Intelligence,” held by the Senate Judiciary’s subcommittee on technology and privacy).
Information Technology III: A Look at Valuations. Almost every stock of every business even remotely related to AI has performed well so far this year—even if they’ve sold off from their summer peaks. In fact, the S&P 500 Information Technology sector as a whole rose 47.7% to a July 18 peak only to tumble 9.0% through mid-August before resuming its climb. The sector is up 41.3% ytd through Monday’s close, outperforming all other S&P 500 sectors except one.
Here’s the performance derby for the S&P 500 sectors ytd through Monday’s close: Communication Services (45.0%), Information Technology (41.3), Consumer Discretionary (36.0), S&P 500 (16.9), Industrials (7.1), Materials (5.3), Energy (2.9), Financials (0.2), Real Estate (-1.3), Consumer Staples (-2.5), Health Care (-2.5), and Utilities (-10.8) (Fig. 1).
Driving the S&P 500 Information Technology sector’s ytd outperformance are a handful of industries: Semiconductors (77.7%), Application Software (49.1), and Systems Software (42.1) with Technology Hardware, Storage & Peripherals (37.3), Semiconductor Equipment (25.6), and Communications Equipment (20.8) not far behind (Fig. 2).
Let’s take a look at the three best performing tech industries so far this year, all of which have gotten a helping hand from the market’s AI ebullience:
(1) Semiconductors. You can’t talk about semiconductors and AI without talking about Nvidia. The company’s stock has risen 209.1% ytd and is less than 10% from its August high. Companies are clamoring to get their hands on Nvidia’s AI chips, which the company believes will replace many of the CPU chips in the marketplace. A data center with more than 900-1000 CPU servers can be replaced by just 2 GPU servers, allowing Nvidia customers to save on the cost of server infrastructure, data centers, and energy, said CFO Colette Kress according to a transcript of Citi’s 2023 Technology Conference on September 7.
Nvidia makes up 57% of the S&P 500 Semiconductor industry’s market capitalization. Were it taken out of the industry, the industry’s ytd performance would sink to 34.2% from 77.7%, according to Joe’s calculations.
Including Nvidia, analysts expect the collective revenue of companies in the S&P 500 Semiconductor industry to fall 2.1% this year and jump 17.1% in 2024, as the industry’s inventory correction appears to have run its course (Fig. 3). Earnings are forecast to fall 7.5% this year and to rebound a hearty 36.4% next year (Fig. 4). The industry’s Net Earnings Revisions Index turned positive in August after 13 months of negative monthly readings (Fig. 5). And the industry’s forward P/E of 25.9 stands near its recent peak, reflecting investors’ restored confidence in the industry’s earnings prospects (Fig. 6). (FYI: Forward P/Es are based on forward earnings, which is the time-weighted average of analysts’ operating earnings-per-share estimates for this year and next.)
(2) Application Software. The S&P 500 Application Software industry has risen almost 50% this year yet still stands 17.2% from its highest level of 2021 (Fig. 7). Many members of the industry, which includes Salesforce and Adobe, are adding AI to their software offerings, which is expected to catalyze revenue growth to a projected 11.3% this year and 11.0% in 2024 and earnings growth to 24.2% this year and 14.5% next (Fig. 8 and Fig. 9). The industry’s forward profit margin (which we calculate from forward revenue and earnings) is at a record-high 28.8%, and net earnings revisions have been definitively positive in recent months (Fig. 10 and Fig. 11). The industry’s forward P/E multiple is 30.6, well below where it has been over the past 10 years and roughly twice its expected LTEG forecast (LTEG is the 5-year forward consensus expected earnings growth) (Fig. 12).
(3) Systems Software. The S&P 500 Systems Software industry stock price index is sitting near a new high, having finally rallied past its 2021 peak level (Fig. 13). Forward revenue and earnings per share are expected to continue hit new record levels (Fig. 14 and Fig. 15). Earnings growth is forecast to slow from its torrid paces of 2020 and 2021 but still reach a respectable 8.1% this year and 12.5% in 2024. The Systems Software industry’s forward P/E is 29.1, on par with the Application Software industry’s forward P/E (Fig. 16).
For more information consider reading the Disruptive Technology sections in the following 2023 Morning Briefings: AI Develops Drugs (July 13), The AI Job Interview (April 6), AI Everything (March 23), AI on the Big Screen (March 9), AI Copies Your Voice (March 2), The AI Race Is On (February 9), and Thinking About ChatGPT (January 19).
Europe Agonistes
September 12 (Tuesday)
Check out the accompanying pdf and chart collection.
Executive Summary: Will 2024 bring improved prospects for Europe’s economy and stock market? While analysts still project a resumption of earnings growth for Europe MSCI companies collectively next year, their 2023 earnings estimates have been falling and the Net Earnings Revisions Index turned negative in August. The outlooks for Europe’s economy and stock market hang in the balance of several uncertainties: whether the ECB can corral inflation without precipitating a recession, whether Europe’s shored up energy reserves will suffice this winter, whether Germany’s economic performance improves, and how well relying on China to meet green energy goals works out.
Weekly Webcast. If you missed this week’s webcast, you can view a replay here.
Europe I: Winter Advisory. Brighter days may be on the horizon for Europe. A resurgence of economic growth could begin as soon as spring 2024, provided that inflation recedes as Melissa and I anticipate and that the European Central Bank (ECB) halts its monetary policy tightening in response. However, for now, the upcoming winter could challenge Europe’s energy resilience, especially if is very cold. It might be prudent to wait out the chilly season in European markets.
Investors in European stocks seemed more optimistic than European consumers and producers during the first half of this year. Europe’s MSCI Index surged 8.5% in euro terms during H1-2023 (Fig. 1). However, this surge reflected a valuation catch-up after Europe was spared the gas shortage widely expected last winter. Investors’ enthusiasm cooled during the summer, with Europe’s MSCI Index slipping 3.6% in euro terms from its recent peak on April 21 through Friday’s close.
Analysts’ consensus estimate for the Europe MSCI’s 2023 earnings growth rate has slipped into negative territory recently, at -1.8% (Fig. 2). While the estimate for 2024 earnings growth has remained positive so far this year, it has plateaued around 6.5%. In August, the Net Earnings Revisions Index of the Europe MSCI turned negative again following three positive readings (Fig. 3).
Factors like inflation, energy resilience, Germany’s economic performance, China’s influence on Europe, and potential banking sector risks will continue to shape the region’s economic forecast—and therefore the potential risks and opportunities in European stock markets as well.
Europe II: Inflation Challenge. Given the persistence of high inflation in the Eurozone, the European Central Bank (ECB) remains committed to tight monetary policy. But the ECB may be up against formidable forces that lie beyond its sphere of influence, notably the prospect of surging energy prices in the event of a harsh winter. Elevated interest rates that curtail lending at a time of resurgent energy inflation could well plunge the European economy into a recession.
Let’s have a closer look at this dicey situation:
(1) Moderating headline CPI. The headline CPI inflation rate declined again in July, from a peak of 10.6% in October 2022, primarily due to significantly lower energy prices. However, inflation remains on the high side, showing a 5.3% increase compared to the previous year (Fig. 4).
(2) Stubborn core CPI. Eurozone core inflation—excluding energy, food, alcohol, and tobacco prices—proved stubborn in June, rebounding slightly to 5.5% and holding at that rate in July after a slight dip in May to 5.4% (Fig. 5).
(3) Determined ECB. While the headline CPI inflation rate may have reached its peak in the Eurozone, along with energy prices in recent months, the ECB remains unwavering in its efforts to curb inflation. However, the path ahead is long as the ECB strives to achieve its 2.0% target. Currently, the ECB’s main refinancing rate stands at 4.25%, surpassing levels seen since the period preceding the 2009 financial crisis. Notably, the central bank has raised rates nine times after maintaining them at zero from early 2016 through mid-2022 (Fig. 6).
(4) Sluggish lending. The ECB’s tightening has curtailed Eurozone bank lending. Total outstanding loans at the Eurozone’s monetary financial institutions dipped by €30.6 billion over the past three months through July (Fig. 7).
(5) Lagarde on guard. Admitting to a miscalculation, ECB President Christine Lagarde conceded in a September 4 speech, “We underestimated both the dynamics of inflation and its persistence.” This admission implies that the ECB sees a need to make up for lost tightening and suggests that the timing may be less than ideal. Lagarde went on to say, “We are entering a world of major transitions in labor markets, energy markets, and geopolitics, all of which can lead to larger and more frequent relative price shocks.”
(6) Toss-up meeting. However, some economists argue that a pause in the rate hikes at this week’s monetary policy meeting would be prudent (as expressed in this analysis and this perspective). They point to the turning tide in inflation, and they recall Lagarde’s July statements suggesting that the additional tightening phase was over. It’s worth noting that these July remarks came several months before Lagarde’s recent comments.
In our opinion, the ECB won’t stop tightening to avert a hard landing as long as inflation remains too high. Even if this week’s meeting results in a pause, we doubt that would mark the end of this round of tightening. After all, the ECB’s paramount objective, to bring inflation in line with its target, has yet to be realized.
Europe III: Energy Security. Europe’s long-term price stability and energy security remain uncertain, as discussed in a September 7 CNN article. Europe continues to count on Russia for a portion of its energy supplies and will likely become increasingly reliant on China as a partner in it shift toward renewable energy.
Moreover, Europe remains especially exposed to the volatility of global liquified natural gas (LNG) markets; LNG makes up much of Europe’s energy reserves and imports currently. As a result, Europe is highly vulnerable to price fluctuations in the LNG market. Supplies are tight, and there is a potential for disruptions like the recent spike in European gas prices as a result of Australian LNG supplier strikes.
LNG is commonly traded on exchanges, with contracts based on volumes and no explicit reference to its origin. LNG’s inherent flexibility and tradability mean that Russia still has a role to play as a source. In fact, Russia supplied 13.2% of the European Union’s LNG supply in 2023, according to Eurostat.
The good news is that LNG terminals coming online from the US and Quatar should help to rebalance the market, noted Reuters. Also, EU gas demand is expected to move lower as renewable energy sources increasingly come onto the energy scene.
In its pursuit of enhanced energy independence, Europe is banking on a green energy transformation, embodied by the ambitious “Green Deal.” This initiative necessitates substantial investments in renewable energy sources. However, sluggish progress toward meeting the Green Deal’s emission targets may compel Europe to depend more on China. China has secured vital resources—including lithium for batteries and steel for wind turbines—and established manufacturing capabilities for green technologies, according to the CNN article.
China could leverage its energy influence in Europe to advance its geopolitical objectives, such as Chinese President Xi’s aspirations regarding the reunification of China and Taiwan. Furthermore, it’s worth noting that renewables themselves are not impervious to challenges, even without China’s involvement. As reported in a recent Bloomberg article, a few weeks of cloudy and rainy weather can significantly affect power output from both wind turbines and solar panels.
Europe IV: German Gloom. Germany, the powerhouse of Europe’s economy, appears to be on the brink of further contraction as its manufacturing sector continues to weaken. German manufacturers, heavily reliant on energy, have borne the brunt of surging energy costs in the wake of Russia’s invasion of Europe. Additionally, Germany faces persistent structural challenges, including an international trade environment that has depressed demand for German goods and a shortage of skilled labor, which has driven up production costs.
Let’s delve into key indicators highlighting the weaknesses within the Eurozone in general and Germany in particular:
(1) Eurozone. GDP grew a meager 0.5% (seasonally adjusted annual rate) during Q2-2023 following several quarters of sluggish growth (Fig. 8). On Monday, as we were writing this piece, the European Union lowered its GDP growth forecast for this year to 0.8% from its 1.1% forecast in the spring, the commission said. For next year, the growth expectation was lowered to 1.3% from 1.6%.
IFO, the economic institute, projected on September 7 that Germany’s GDP would contract by 0.4% in 2023. It’s worth noting that manufacturing contributed to approximately 20% of German GDP in 2021, the WSJ recently observed.
(2) Eurozone sentiment eroding. The Eurozone’s economic sentiment indicator (ESI) has remained below 100 since July 2022, deteriorating further as the war in Ukraine intensified and concerns grew over a harsh winter. It continued to decline through August this year, reflecting ongoing worries related to rising interest rates (Fig. 9). Consumer sentiment in the Eurozone has been consistently weak; that’s reflected in the volume and value of retail sales, which have slightly picked up in recent months but remain depressed through July (Fig. 10).
(3) Industrial performance weaking. German industrial production declined during July compared to the previous month, and it’s down 4.0% since February 2022, the month of Russia’s Ukraine invasion (Fig. 11).
Germany’s energy-intensive manufacturing sector also saw production dip during July as manufacturers adjusted to decreased demand and rising costs. Manufacturing orders dropped more on a m/m basis in July than in any other month since April 2020 as the backlog of orders from the pandemic era diminished (Fig. 12).
On a y/y percentage change basis, Eurozone industrial production has bounced around zero since late 2022 (Fig. 13).
(4) Business confidence declining. Germany’s IFO business confidence index, encompassing both manufacturing and service sectors, reached a recent low in October 2022 before briefly rebounding through April of this year. Since then, the index has steadily declined through August (Fig. 14). Both the current situation and expectations indexes have dropped recently, reflecting uncertainty and reduced confidence among German businesses (Fig. 15).
(5) PMIs disappointing. The latest Eurozone PMI data indicate continued weakening of economic activity across the region, providing further confirmation of our pessimistic outlook for the European economy (Fig. 16). While the pace of manufacturing activity decelerated somewhat in August compared to previous months, the pace of activity in the service sector slowed sharply.
Germany’s manufacturing PMI remained in contractionary territory during August, and now Germany’s non-manufacturing PMI has joined it there, plummeting below 50 during August (Fig. 17). The data adds to Germany’s economic woes and dashes hopes of stability in the Eurozone region’s services sector.
‘Talk To An Economist’
September 11 (Monday)
Check out the accompanying pdf and chart collection.
Executive Summary: It’s worrying investors big time, but the escalating federal budget deficit doesn’t even merit an explanation from the administration driving it out of historically normal proportions. A federal deficit that’s rising as a percentage of nominal GDP at a time when GDP is rising is highly unusual. At risk is the bond market’s ability to finance the deficit at current interest rates. ... This concern could make bond yields less sensitive to inflation (and the Fed’s reaction to it) and more sensitive to bond supply and demand. For now, we’re sticking with our back-to-the-old-normal bond yield forecast, based on our moderating inflation forecast, but we are increasingly concerned about the flood of Treasuries.
YRI Weekly Webcast. Dr. Ed is on vacation and has prerecorded his Monday webcast, which is available here along with replays of his past weekly webcasts. He will see you next week live on Monday at 11:00 a.m. for his next weekly webcast.
US Federal Deficit I: The Two-Trillion-Pound Gorilla. The September 5 issue of The New York Post reported:
“White House Press Secretary Karine Jean-Pierre on Tuesday called President Biden ‘fiscally responsible’—but couldn’t explain away the latest dismal deficit figures, saying dismissively, ‘Talk to an economist.’
“The Biden rep brushed off statistics indicating the federal deficit is on track to double this year, blaming the tenuous situation on ‘volatile’ factors—but then refusing to be more specific. ‘Deficits from year to year can be volatile, and so that’s kind of how we have tracked that, but the reality is the president has a real plan, as we have laid out multiple times, to reduce the deficit,’ Jean-Pierre claimed at her regular briefing in response to a question from a Time reporter.
“The scribe followed up, ‘What is the reason it’s going up, though? Why is the deficit increasing?’ Jean-Pierre responded, ‘I just said, it can be year to year—it can be very volatile.’ When challenged again for a reason, Jean-Pierre repeated, ‘I just laid out, it can be very volatile. … That’s the way it is, from year to year, it can be variable.’ A reporter from The Post interjected, ‘Why?’ She shot back, ‘Talk to an economist, and they’ll tell you specifically.’”
The nonpartisan Committee for a Responsible Federal Budget recently projected that the federal deficit for fiscal 2023, which ends September 30, will hit $2 trillion. That’s the highest ever excluding during the Covid-19 pandemic, despite Biden’s claim that his administration has implemented measures to slash the deficit.
If Jean-Pierre were to talk about the deficit with Debbie and me, we would make the following points:
(1) Deficit cycle. The federal deficit always widens during economic recessions as tax receipts fall and outlays increase owing to automatic federal income support programs and spending (and/or tax cuts) aimed at boosting the economy. As a result, the ratio of the deficit to nominal GDP is inversely correlated with the unemployment rate and the growth rate of real GDP (Fig. 1 and Fig. 2). So it is extremely unusual to see the ratio rising—as it is now—at times like now, when the economy is growing and the unemployment rate is near record lows, around 3.5% recently.
(2) Ballooning deficit. The federal deficit, on a 12-month sum basis, narrowed from a record $4.1 trillion through March 2021 to a recent low of $1.0 trillion through July 2022 (Fig. 3). Since then, it has ballooned to $2.3 trillion through July.
(3) Revenues. The recent widening of the federal deficit is partly attributable to a significant drop in federal individual income tax receipts so far this year (Fig. 4). Meanwhile, payroll tax receipts rose to a record high of $1.6 trillion over the 12 months through July, reflecting record employment. Corporate tax receipts totaled $430.7 billion, near their recent record high. But individual income tax receipts fell from a record high of $2.7 trillion over the 12 months through last April to $2.2 trillion over the 12 months through this July.
Last year’s individual income tax revenues were boosted by capital gains tax revenues, as individual investors bailed out of their stocks during the 2022 bear market. So this year’s decline reflects a more normal pace of income tax receipts. Unfortunately, without such one-time windfalls boosting revenues, the underlying trend in the federal deficit is to widen.
(4) Outlays. While revenues are falling (on a 12-month sum basis), outlays are rising at a more rapid pace led by net interest income, Social Security, and Medicare (Fig. 5 and Fig. 6). The former (on a 12-month sum basis) is up $628 billion y/y, while the sum of the latter two is up $2,151 billion.
US Federal Deficit II: Bond Drivers. How much higher might record federal deficits drive up the 10-year Treasury bond yield? In the past, we’ve often observed that supply and demand for bonds aren’t usually as important to the determination of the bond yield as are actual and expected inflation and the expectations of how the Fed will respond to them. So given that we expect inflation to continue to moderate toward 2%-3% by late next year, we currently predict that the bond yield should range between 4.25% and 4.50%.
That’s not so high in a historical context, as we’ve previously shown; it simply represents a return to the “old normal” yields of 2003-07, i.e., before interest rates were slashed to the “new abnormal” levels from the Great Financial Crisis through the Great Virus Crisis. From 2003-07, the 10-year TIPS yield averaged about 2.00%, and the expected inflation spread between the 10-year nominal Treasury and comparable TIPS yield ranged around 2.25%-2.50% (Fig. 7 and Fig. 8). They add up to a normal nominal bond yield of 4.25%-4.50%.
On August 1, Fitch Ratings downgraded US government debt from AAA to AA+ for all the reasons that have been concerning the investors for years. None of this is news. However, the Fitch downgrade serves as a reminder to financial markets broadly that fiscal policy continues to get more and more abnormally profligate.
As noted above, in the past, federal deficits tended to narrow during economic expansions and to widen during recessions. Now the federal deficit is widening even though the economy is expanding. This raises the possibility that the bond market might have trouble financing the government’s huge deficits at current market interest rates.
Let’s assess the outlook for the bond market based on a supply-and-demand analysis:
(1) The Fed and banks are sellers. The US Treasury will be selling lots of notes and bonds over the rest of this year and next year, while the Fed's quantitative tightening (QT) program will continue to reduce the Fed's holdings of Treasuries by about $60 billion per month (Fig. 9). Additionally, commercial banks are allowing their portfolios of securities to mature and using the proceeds to offset net deposit outflows (Fig. 10).
(2) Other investors are buyers. The Treasury, therefore, must increasingly rely on US households, US institutional investors, and foreign investors to purchase the rapidly increasing supply of US debt. They will undoubtedly do so. The only question is whether interest rates are high enough already to attract these buyers or whether rates would have to go higher to do so.
We have monthly data on net inflows into all bond mutual funds and ETFs in the US. On a 12-month-sum basis, they show net outflows from September 2022 through April 2023 (Fig. 11). Through July, there have been net inflows of $189 billion. That’s not much. Weekly data on money market mutual funds (MMMF) show significant net inflows of $1,060 billion over the past year through the September 6 week, with $599 billion in retail and $461 billion in institutional MMMF (Fig. 12 and Fig. 13).
Monthly data compiled by the US Treasury on net capital inflows show private foreign purchases of US Treasury notes and bonds at a record $989.5 billion over the 12-month period through October 2022 (Fig. 14). This pace slowed to $761.3 billion through June. That is still a very large number.
(3) Fed still buying Treasury bonds. By the way, the Fed has been trying to moderate the impact of its QT program on the bond market by continuing to purchase Treasury bonds with maturities of 10 years or longer (Fig. 15). The Fed’s holdings of these securities rose $74 billion since the start of QT through the September 6 week. The Fed’s total holdings of Treasuries fell $857 billion over this period.
(4) Bottom line. So: How much higher might record federal deficits drive up the 10-year Treasury bond yield? We are sticking with our back-to-the-old-normal bond yield forecast of 4.25%-4.50%. The yield has been trading in that range since early August. Staying in that range when the federal deficit is abnormally large requires that inflation continues to moderate as we expect.
We acknowledge that there could be temporary setbacks in the disinflationary trend since last summer. Those could send the yield temporarily above our range, but we would view them as temporary buying opportunities in the bond market.
Of course, we could be wrong about inflation. In a rebounding inflation scenario, the federal deficit obviously would exacerbate the rise in the bond yield. That would be a very ugly scenario for stock and bond investors as well as for the economy. That’s not our outlook. But that scenario is the risk to our outlook.
Oil, China & The Ocean
September 7 (Thursday)
Check out the accompanying pdf and chart collection.
Executive Summary: Oil prices have spurted skyward in recent months and recent days, as intended by the production cuts instituted by Saudi Arabia and Russia. The S&P 500 Energy sector’s share price index has spurted in sympathy, outperforming its counterparts this summer. Jackie looks at the countervailing forces affecting the global oil supply, including Saudi Arabia’s budget pressures and rising US oil production. ... Also: China’s economy is not doing well despite the stimulative efforts of its government and default-avoidance efforts of its largest property developer. … And: An update on The Ocean Cleanup’s daunting mission.
Energy: Saudis Play With Prices. Saudi Arabia and Russia continue to flex their muscle in the oil market, holding back production and pushing up prices. Saudi Arabia announced on Tuesday that it will extend its 1 million barrels per day (mbd) supply cut through the end of this year. On the same day, Russia announced that it will do the same with 300,000mbd. This is in addition to the 1.66mbd of production cuts through year-end that OPEC+ had agreed to earlier. The price of Brent crude futures responded to Tuesday’s news by rising to $90.04 a barrel that day, up from its recent low of $72.26 on June 27 (Fig. 1).
Before Tuesday’s announcement, Saudi Arabia and Russia had said their cuts were to extend through September. The US Energy Information Administration’s (EIA) August outlook anticipated that the global oil market would move from a surplus position during H1-2023 to a deficit during H2-2023. After the announcement, that deficit undoubtedly will grow, though it is tempered somewhat by unexpectedly strong US production.
The EIA no doubt will be revising its quarterly production and consumption forecasts through 2024 to reflect Tuesday’s news, but as of August 3 they stood as follows: Q1-2023 (101.00 mbd production, 100.16 mbd consumption), Q2-2023 (101.31, 100.97), Q3-2023 (101.03, 101.67), Q4-2023 (101.83, 101.95), Q1-2024 (102.33, 102.29), Q2-2024 (102.83, 102.36), Q3-2024 (103.38, 103.29), and Q4-2024 (103.47, 103.24).
The future course of oil prices is always a function of demand and supply. Determinants on the demand side include the rates of economic growth in China and the United States. But from a supply perspective, oil prices will be heavily determined by the production decisions of Saudi Arabia as well as US production levels. Let’s take a deeper look at the dynamics underpinning both:
(1) Saudis need prices high. Saudi Arabia’s budget deficit jumped by 80% to $1.4 billion in Q2-2023 due to spending on social benefits and capital expenditures. Non-oil revenues rose, but oil-related revenues inched up 0.6% q/q and fell 28% y/y, according to an August 4 article at OilPrice.com. In May, the International Monetary Fund said that the country needed oil prices at $80.90 a barrel to balance its budget this year. While that level seemed unlikely to analysts at the time, today it looks far more feasible.
Rising prices might also mean that Saudi Arabia could reverse recent production cuts and generate more revenue from exports, giving its economy a needed boost. The country’s GDP slowed to 1.1% in Q2 from 3.8% in Q1 and 11.2% in Q2-2022, a July 31 CNBC article reported.
High oil prices also would boost the share price of the stock offering that Saudi Arabia’s Aramco is considering. The company may sell as much as $50 billion of shares before year-end, which would make it the largest offering ever sold in the capital markets, according to a September 1 WSJ article. The higher the price of oil, the more likely the stock offering will occur. The country’s Crown Prince Mohammed bin Salman has been monetizing Saudi Arabia’s oil-related assets and investing the proceeds in industries outside of the oil patch. Oil priced at $80 a barrel or higher would also help fund the kingdom’s efforts to diversify its economy.
(2) US production on the rise. US oil production has risen to near-record levels, but that’s still not high enough to entirely offset the 1.3mbd production cuts by Saudi Arabia and Russia. The US produced 12.8mbd of crude oil in the week ending August 25; that’s only 0.3mbd shy of the record production level of 13.1mbd in February and March 2020.
The recent jump in US production comes even as the number of rigs used for drilling has fallen to 512 from a recent peak of 627 (Fig. 2). US shale producers have been lengthening the horizontal laterals they drill, and they’ve been using new techniques to get more oil out of old wells. ExxonMobil believes that shale producers can double crude output from existing wells by using new fracking technologies.
Exxon “is trying to frack more precisely along the well so that more oil-soaked rock gets drained. It’s also looking for ways to keep the fracked cracks open longer so as to boost the flow of oil,” a June 4 OilPrice.com article reported. In addition, oil companies are returning to old, fracked wells and using a high-pressured blast to get more oil out of them.
The EIA increased its forecast for US oil production by 360,000 barrels per day this year and by 240,000 in 2025, according to its August 23 report.
(3) Energy stocks on a roll. Although energy stocks fell during most of this year, they’ve gushed higher in recent months, helped by the surge in the price of crude oil. Since the end of May, the S&P 500 Energy sector has outperformed all other S&P 500 sectors.
Here’s the performance derby for the S&P 500 sectors from May 31 through Tuesday’s close: Energy (18.6%), Consumer Discretionary (12.5), Industrials (10.4), Materials (9.7), Communication Services (8.5), Information Technology (8.4), Financials (8.2), S&P 500 (7.6), Health Care (3.5), Real Estate (1.7), Consumer Staples (-0.8), and Utilities (-5.1).
Energy stocks may have started to price in a more optimistic future than industry analysts have anticipated. Industry analysts are expecting the S&P 500 Energy sector’s revenue to fall 17.4% this year and remain flat in 2024, while calling for the sector’s earnings to fall 27.4% this year and rise 1.7% next year (Fig. 3 and Fig. 4). Higher-than-expected crude oil prices could push analysts to revise those estimates up sharply. Thank Saudi Arabia.
China: Waiting for the Restructuring. In recent weeks, China and its property developers have taken steps to keep the Chinese residential real estate market and the broader economy afloat. China has made investing in real estate more attractive, and Country Garden Holdings, one of China’s largest property developers, has made an interest payment and extended the maturities on three of its bonds.
While this may allow the Chinese economy to continue limping along, it won’t reduce the excessive leverage that’s weighing down the real estate sector and local governments. We’ve long thought that the government ultimately will have to sponsor a debt restructuring program if it hopes to put China’s leverage problems in the rearview mirror anytime soon.
The most recent data about China’s economy arrived Tuesday: The Caixin/S&P Global services purchasing managers’ index fell to 51.8 in August from 54.1 in July. While the August reading marked a slight expansion, it was the lowest reading since December, when Covid-19 kept consumers in their homes (Fig. 5). Official figures out of China weren’t much better, with August’s nonmanufacturing PMI reported at 51.0 and manufacturing PMI at 49.7 (Fig. 6).
Here's a look at the steps the Chinese government and Country Garden have taken to keep the train moving down the tracks, albeit very, very slowly:
(1) Default averted—for now. Country Garden Holdings dodged default earlier this week by making a $22.5 million interest payment on US dollar-denominated debt; it also extended the maturities on $1.5 billion of local currency-denominated debt. The developer still has about $162 million of offshore bond interest payments due this year and nearly $15 billion of debt due within the next year in the form of bonds, notes, bank debt, and other borrowings—dwarfing the developer’s $13.9 billion of cash and equivalents, a September 5 NYT article reported. Country Garden has warned that default is a risk if its financial performance continues to deteriorate. During a tough H1-2023, it posted a record $7.1 billion loss, a September 4 Reuters article reported.
The company has total liabilities of almost $190 billion, which is smaller than China Evergrande Group’s more than $300 billion of debt. But don’t underestimate the impact that a Country Garden default would have on the Chinese economy. The company had more than 3,100 projects in development across every Chinese province at the end of 2022, with nearly 947 million square feet already presold, a September 2 South China Morning Post article reported. That far exceeds Evergrande’s 1,200 projects in June 2021, before its distress became apparent. If Country Garden defaults and can’t deliver units that have already been paid for, more than one million households could be affected.
(2) Government lends a hand. Under pressure to get the economy growing faster, the Chinese government and related institutions have taken many small steps to encourage borrowing and lending and to bolster private industry.
The government announced on Monday plans to set up an agency to “coordinate policies across different government bodies and help development of the private economy,” a September 4 WSJ article reported. This is quite a reversal from the Chinese government’s stance toward private companies and financial markets in 2021, when it blocked the IPO of Ant Group. Additional moves that China made recently to facilitate financial market activity include halving the stamp duty, a tax charged on shares traded; restricting share sales by major shareholders under certain circumstances; and lowering margin requirements.
In an effort to boost the property sector, the People’s Bank of China (PBOC) and other agencies lowered the down payment for first-time home buyers to 20% and for second-time purchasers to 30%. Chinese state-owned banks are expected to help borrowers by lowering interest rates on existing mortgages or replacing them with new mortgages. Chinese banks cut deposit rates to encourage savers to become spenders, and the one-year loan prime rate was lowered by 10 basis points to 3.45% last month. Regulators also have lent a hand by cutting reserve ratios. At large depository institutions, the reserve ratio has fallen to 10.75 from 12.00 two years ago (Fig. 7).
The PBOC’s ability to cut rates is somewhat limited if it aims to keep the yuan from falling below its current decade-low level. The yuan trades at 7.3 to the dollar, down from its recent peak of 6.7 and its lowest level since early November 2022 (Fig. 8).
(3) China’s stocks are down, but are they cheap? The MSCI China share price index is down 4.1% ytd, and the Shanghai-Shenzhen 300 has lost 1.5% ytd (Fig. 9 and Fig. 10). After recent government actions to boost the economy and the markets, China’s MSCI stock price index has outperformed most other international markets during the opening days of September, rising 1.4%. That beat the 0.2% decline in the US MSCI index over the same period.
The collective revenues of the companies in China MSCI stock price index are expected to rise 5.8% this year and 7.5% in 2024 (Fig. 11). Their earnings are forecast to increase 18.1% in 2023 and 14.9% in 2024 (Fig. 12). Net earnings revision have been decidedly negative over the past 24 months (Fig. 13).
The China MSCI’s forward P/E has fallen from a peak of 18.3 in February 2021 to a recent 10.0 (Fig. 14). The index’s valuations have fallen into the single digits during times of extreme stress in the past, and unless the Chinese government proactively works to reduce the leverage in its economy, more distressed valuations may be coming.
Disruptive Technologies: Oceans Getting Cleaned. The Ocean Cleanup, a group focused on ridding our rivers and oceans of trash, has made solid progress since we wrote about them in the November 17, 2022 Morning Briefing. At the end of August, the organization deployed System 03, its largest ocean cleanup system, into the Great Pacific Garbage Patch (GPGP). It’s goal: To make removing trash from the ocean faster and more cost effective.
Here’s a look at what the organization has accomplished and what’s left to do:
(1) Getting bigger. Over the past two years, System 002 cleaned more than 3,000 square miles of ocean and removed 623,439 pounds of plastic from the GPGP. On its last trip, it brought back more than 55 tons of trash back to shore, but there’s plenty left to do because the GPGP contains around 100,000 tons of plastic. That job will fall to System 03.
As in the past, System 03 uses two boats that each hold one end of a net that’s open at the bottom. As the boats move slowly through the ocean, trash is captured by the nets and pushed back into a large sack called the “retention zone.” When the sack is full, it’s pulled onto one of the boats and emptied.
System 03 has a 7,000-foot-long net that’s three times longer than System 002’s net. Hanging down from the net is a screen that reaches much deeper to catch plastic flowing underneath the surface. At peak efficiency, System 03 can clean an area the size of a football field every five seconds, according to the company’s website. The ability to clean up more of the ocean faster and using fewer resources lowers the cost per kilogram of plastic removal from the ocean. The Ocean Cleanup believes it will need a fleet of ships using 12 System 03s to successfully cleanup the GPGP and move onto other problem areas in the world’s oceans.
System 03 added a Marine Animal Safety Hatch (MASH) to provide an escape route for animals caught in the retention zone. The MASH is monitored on the ship by humans and underwater by cameras and artificial intelligence (AI).
(2) Kia steps up. Kia announced in April 2022 that it would enter a seven-year partnership with The Ocean Cleanup. Kia provides funding and in-kind contributions to support the environmental organization and agreed to use its recycled plastic. Kia will use “a portion” of the recycled plastic made from the last haul of System 002 in its electric vehicles, a September 4 Plastics Today article reported.
(3) What’s next. Looking forward, The Ocean Cleanup is evaluating how best to sort its hauls of trash. As the hauls increase in size, sorting by hand will not be scalable and may need to occur on shore instead of on the ship. Larger hauls will also require new systems on the ships to compact and store the trash. The Ocean Cleanup would like to move recycling operations to North America and find new ways to process items that aren’t currently recyclable.
Additionally, the organization remains proactive, with systems cleaning up rivers to prevent trash from ending up in the oceans.
From Strong To Soft Patch?
September 6 (Wednesday)
Check out the accompanying pdf and chart collection.
Executive Summary: Is the surprising Q3 strength in the economy sustainable? Clues in the latest data releases suggest not, and our forecast calls for a renewed soft landing. A stronger-for-longer economy wouldn’t jibe with the Fed’s higher-for-longer interest-rate stance. ... But the economic outlook hinges much on what consumers do next. We don’t see them slamming on the spending brakes, as the hard-landers predict will happen when excess savings are depleted. But they might start tapping on the brakes, especially given the imminent resumption of student loan payments and tightening credit conditions.
Weekly Webcast. If you missed yesterday’s live webcast, you can view a replay here.
US Economy I: Another Soft Landing Ahead. Our economic forecast has put us in the soft-landing camp since early last year. That worked out well so far. However, Q3 is turning out to be a very strong patch in the soft-landing scenario. We doubt it is sustainable.
The question is: What comes next? Will the strong patch be followed by a resumption of our rolling recession paradigm, which has been driving our soft-landing scenario? Or will it be followed by the recession that was so widely expected last year and early this year? A recession is still expected by many economic forecasters even now, but not as widely as at the start of this year.
Of course, from a contrarian perspective, the biggest surprise of all would be that the current strong patch is the start of better-than-expected economic growth for the rest of this year and into next year. Debbie and I like to be contrarians when it makes sense. But stronger-for-longer economic growth seems to be at odds with the Fed’s current higher-for-longer stance on interest rates. On the other hand, fiscal policy remains very stimulative. Capital spending might strengthen as business managers do what they can to boost productivity to offset the shortage of workers, especially skilled ones.
Then again, the rolling recession is rolling into the commercial real estate sector, hitting office buildings hard and boosting nonperforming loans at the banks. The rolling recovery in housing starts is likely to be aborted by the recent jump in mortgage interest rates. The consumer has been remarkably resilient. However, consumers’ excess savings could be depleted by the end of this year. Student loan payments are resuming. Delinquency rates on consumer loans are moving higher. Nevertheless, we don’t expect these developments to result in a hard landing.
Let’s review the latest data relevant to assessing which way the economy is heading:
(1) GDP. The Atlanta Fed’s GDPNow tracking model shows real GDP rising 5.6% (saar) during Q3 as of September 1. That follows increases of 2.0% and 2.1% during the first two quarters of this year (Fig. 1). Leading the way is a 7.2% increase in residential investment following declines of 4.0% and 3.6% during Q1 and Q2. Also strong is personal consumption expenditures with a gain of 4.2% compared to 1.7% during Q2. In capital spending, equipment is up 2.7%, while nonresidential structures is up just 0.2%.
(2) Coincident indicators. There may be a bust coming according to the Index of Leading Economic Indicators, which peaked during December 2021. But there is still no hint of a recession in the Index of Coincident Economic Indicators (CEI), which rose 0.4% m/m to yet another record high in July (Fig. 2). On the other hand, there’s no boom in the CEI, which on a y/y basis tracks real GDP very closely. The former rose 1.7% in July, while the latter rose 2.5% during Q2.
The CEI probably rose again during August. Payroll employment, which is one of the four components of the CEI, rose 0.1% last month to a new record high. Real personal income less government transfer payments, another CEI component, most likely rose too since aggregate hours worked increased 0.4% to a new record high last month (Fig. 3). Wages as measured by average hourly earnings rose 0.2% last month, which might have been a downtick on an inflation-adjusted basis.
Another CEI component, real business sales, might have been weighed down by some weakness in August retail sales after July was boosted by Amazon’s Prime Day. Auto loans suggest that autos sales may be weakening. Finally, the aggregate number of hours worked in manufacturing rose 0.2% during August, suggesting that manufacturing output remained relatively flat last month (Fig. 4).
None of the above confirms the strength in Q3’s real GDP or suggests that it is sustainable. Nor do they hint at an impending recession.
(3) Housing. Housing starts rebounded during the spring and early summer (Fig. 5). Single-family starts led the way. Meanwhile, multi-family starts remained high, but multi-family building permits have been falling since March, when the banking crisis first hit (Fig. 6). In addition to tightening credit conditions, rapidly falling rent inflation may also be weighing on multi-family starts (Fig. 7).
Real residential investment could very well increase during Q3, but it’s easier to imagine another leg down ahead rather than further gains (Fig. 8). Mortgage applications for new home purchases declined during August to the lowest since April 1995 (Fig. 9). That does not augur well for new and existing home sales.
(4) Capital spending. The Business Roundtable CEO Outlook Index stabilized during the first half of this year around 75.0, down from a record high of 123.5 during Q4-2021 (Fig. 10). Not surprisingly, it is highly correlated with the growth rate of capital spending in real GDP on a y/y basis. JP Morgan Chase CEO Jamie Dimon is a member of the Roundtable and might have depressed the other members with his warnings last year of a coming recession.
Real capital spending rose at a solid pace of 4.2% y/y during Q2, but could now start to slow. Nondefense capital goods orders have stalled this year through July at a record high (Fig. 11). However, on an inflation-adjusted basis, this series has been falling since early 2022. Industrial production of business equipment has also been relatively weak since the end of last year (Fig. 12). The regional business surveys conducted by five of the 12 Federal Reserve district banks have been showing relatively weak capital spending readings in recent months (Fig. 13).
(5) Construction. One area of strength in capital spending has been nonresidential construction, led by a building boom in factories (Fig. 14). Onshoring and federal government incentives have boosted these outlays. In addition, the federal government is spending lots of money on infrastructure, lifting public construction spending to a new high in June (Fig. 15).
(6) Bottom line. All of the above suggest that Q3’s strong patch isn’t likely to be sustainable. However, we still need to spend some time with the elephant in the room: The economic outlook will be mostly determined by consumers. Let’s turn to a review of what we know about them in the next section.
US Economy II: Born To Shop. Debbie and I have often observed that Americans are born to shop. We’ve also observed that they spend when they are happy and sometimes spend even more when they are depressed. That’s because shopping releases dopamine in the brain and makes us feel better.
Consumer confidence has been depressed by high inflation over the past couple of years; yet consumers continued to shop, no doubt frustrating the hard-landers with their dire forecasts. Nevertheless, the hard-landers are confident that a consumer-led recession is coming soon once consumers’ excess saving is depleted. Let’s review the outlook for consumers since they are likely to make or break the pessimists’ outlook:
(1) Excess saving. It is certainly true that personal saving rose significantly during the pandemic years of 2020 and 2021 (Fig. 16). It totaled $5.2 trillion over the course of those two years compared to $2.6 trillion over the prior two years. It was down to $658 billion in 2022 and has remained low so far in 2023.
The resulting drop in the personal saving rate since mid-2021 has meant that consumers spent more of their disposable income on goods and services (Fig. 17). If now they were to reverse that behavior abruptly, returning to saving at the pre-pandemic rate, that undoubtedly would cause a consumer-led recession.
However, if they were to increase their rate of saving gradually rather than abruptly or if they were to delay increasing their low saving rate for a while, a recession wouldn’t be a foregone conclusion. Those might be more likely scenarios because consumers shouldn’t be in a rush to replenish their savings, as they didn’t actually deplete their savings to spend more over the past two years. Rather, they accumulated less net worth (by saving less) because they had accumulated so much during the pandemic period!
In short, there’s no compelling reason for consumers to suddenly slam on their spending brakes. That’s especially true if both payroll employment and real wages continue to rise to record highs. In our scenario, real consumer spending should grow along with real disposable income, driven by rising employment and real wages. That’s assuming that consumers aren’t in a rush to save more of their disposable income than they’re now saving.
Collectively, US households’ net worth totaled a near-record $140.6 trillion during Q1, up a whopping $36.4 trillion since Q1-2020, just before the pandemic (Fig. 18). Are consumers really under pressure to suddenly save more? We don’t think so.
(2) Student loan payments. The Chamber of Commerce updated its fact sheet on Student Loan Debt on July 6. Student loan payments were put on hold during March 2020. They are set to resume on October 1. According to the US Department of Education, 43.6 million Americans have federal student loan debt, amounting to more than $1.64 trillion. The average amount of federal student loan debt is $37,717.
The resumption of student loan payments undoubtedly will weigh on consumer spending. That’s one reason why we expect that the recent strong patch in economic growth isn’t sustainable. However, we don’t expect that the resumption of student loan payments will result in a consumer-led recession.
(3) Delinquencies. Tightening credit conditions are starting to stress some low-and middle-income consumers. This year, credit card delinquencies have hit 3.8%, while 3.6% of car loan holders have defaulted on their car loans, according to credit agency Equifax. Both figures are the highest in more than 10 years.
There are 70 million more credit card accounts open now than before the pandemic in 2019, and credit card debt surpassed $1 trillion for the first time ever this year, according to the New York Federal Reserve. Also, retailers—including Macy’s, Kohl’s, and Nordstrom—have called out rising delinquency rates among their customers with private-label store cards.
(4) Mortgage payments. Last but not least: Let’s not forget that many of the approximately 50 million households with mortgages have refinanced them at record-low interest rates between 3%-4% in 2020 and 2021. They obviously have more cash to spend than they would have had they not refinanced. On the other hand, they aren’t likely to move to another home anytime soon, a situation that should continue to exert drag on housing-related consumer spending.
Powell’s Ideal Economy
September 5 (Tuesday)
Check out the accompanying pdf and chart collection.
Executive Summary: What would it take for the Fed to abandon its hawkish stance? Three things, suggested Fed Chair Powell’s recent Jackson Hole speech: core PCED inflation dropping closer to 2% y/y, demand for labor dropping closer to the supply of it, and consumer spending cooling off a bit. All that can happen without a recession, as it has twice before in recent history, and the latest data on all three parameters suggest progress in the right direction. … Today, we review the data showing rebalancing of the labor market, slowing consumer spending, and moderating inflation. … Dr. Ed also reviews “The Crowded Room” (+).
YRI Weekly Webcast. Join Dr. Ed’s live Q&A webinar today at 11 a.m. EST. You will receive an email with the link to the webinar one hour before showtime. Replays of the weekly webinars are available here.
Ideal Economy I: Rebalancing Labor Market. In his Jackson Hole speech on August 25, Fed Chair Jerome Powell sounded quite hawkish. He implied that he would turn less hawkish if price inflation continued to fall toward the Fed’s 2.0% target. In the past, he has indicated that wage inflation would probably have to slow to 3.0% (from 4%-5% currently) to get there, which would require that the supply of labor increase at a faster pace than the demand for labor. He also would like to see hot consumer spending cool off. Powell has said on numerous occasions that he believes monetary policy is on course to achieve this ideal outcome without a recession.
Powell’s naysayers say that he is naïve. History shows that only a recession can subdue price and wage inflation; it does so by depressing consumer spending. Debbie and I have been pointing to examples in the past when midcycle slowdowns (a.k.a. soft landings or growth recessions) subdued inflation without recessions. The clearest examples occurred during the mid-1980s and mid-2010s (Fig. 1 and Fig. 2). We think this is happening again now.
Thursday’s personal income report for July confirmed that price inflation remains on a downward path. Consumer spending was hot during the month, but we expect it to cool. Friday’s employment report for August showed that labor supply may be starting to outpace labor demand. Tuesday’s JOLTS report for July confirmed this development, as did the Consumer Confidence Index survey.
Let’s have a closer look, starting with the labor market:
(1) Labor supply. The unemployment rate jumped from 3.5% in July to 3.8% in August as the labor force swelled by 736,000, outpacing the 222,000 increase in the household measure of employment (Fig. 3 and Fig. 4). Notably, the household measure counts the number of people with jobs rather than the number of jobs, unlike payroll employment, which counts the number of jobs. The labor force participation rate rose from 62.6% in July to 62.8% in August, led by a jump in the labor force participation rate of women (Fig. 5).
(2) Labor demand. Payroll employment rose 187,000 during August, the third consecutive reading below 200,000 (averaging 150,000 over the period) (Fig. 6). It averaged gains of 287,000 during the first five months of this year. The average workweek in private industry edged up from 34.3 hours in July to 34.4 hours in August (Fig. 7). It’s down from a recent high of 35.0 hours during January 2021 and back to the more normal readings before the pandemic.
(By the way, July’s employment gain would have been over 200,000 but for the loss of 30,000 jobs in the trucking industry resulting from the bankruptcy of Yellow and the Writers Guild of America and Screen Actors Guild strike involving 16,000 workers. On the other hand, June and July payrolls were revised down by 110,000.)
Also heading back down toward more normal pre-pandemic readings is the JOLTS job openings series (Fig. 8). It is down from a record 12.0 million during March 2022 to 8.8 million in August. That’s still a very high reading, but it is falling. Also falling is the “jobs plentiful” series included in the Consumer Confidence Index survey from a peak of 56.7% saying so last March to 40.3% this August, which is below the pre-pandemic readings during 2019 (Fig. 9). However, the “jobs hard to get” series remained low at 14.1% in August.
(3) Wages. Average hourly earnings of all workers in private industry rose just 0.2% m/m during August. However, it was still up 4.3% y/y (Fig. 10). That’s still well above Powell’s ideal of 3.0%, but it is heading in the right direction given that it peaked at 5.9% during March 2022.
Ideal Economy II: Slowing Consumer Spending. Forecasters who’ve long been expecting a hard landing of the economy made a big mistake in betting against American consumers. But the hard-landers are not accepting that consumer spending isn’t going to retrench; instead, they’re doubling down by predicting that it will happen soon, because consumers are running out of pandemic-related excess savings now and have too much consumer debt. In addition, payments on student loans are about to resume.
Powell doesn’t want consumers to retrench. He just wants them to cool their jets. We think they will do just that. Inflation-adjusted consumer spending jumped 0.6% m/m during July (Fig. 11). But that was boosted by Amazon’s Prime Day (and maybe by Taylor Swift’s concerts). In current dollars, retail sales of non-store retailers jumped 1.9% during July.
Let’s have a closer look at the consumer-related data:
(1) Earned Income Proxy. Our Earned Income Proxy (EIP) for private wages and salaries in personal income rose 0.6% m/m during August, as aggregate hours worked rose 0.4% and average hourly earnings increased 0.2% (Fig. 12). That augers well for August’s personal income and retail sales reports.
(2) Disposable personal income and consumption. Inflation-adjusted disposable income fell 0.2% m/m during July, while real consumer spending on goods and services rose 0.6% m/m (Fig. 13).
(3) Personal saving. The personal saving rate fell to 3.5% during July, remaining near its post-pandemic lows and well below 9.3%, which was its reading in February 2020 just before the pandemic (Fig. 14). It is widely expected that the saving rate will start moving higher later this year or early next year once consumers deplete the excess savings they accumulated during the pandemic.
We don’t agree. We believe that as the Baby Boomers continue to retire, they are no longer saving. Instead, they are spending their retirement nest eggs. The oldest Baby Boomers turned 65 during 2011 and 75 during 2021. The youngest of this cohort will turn 65 in 2029 and 75 in 2039 (Fig. 15).
The Baby Boomers’ net worth at the end of Q1-2023 was $74.8 trillion (Fig. 16). That’s a huge pile of “excess saving.”
Ideal Economy III: Moderating Price Inflation. Both the headline and core PCED inflation rates rose 0.2% m/m in July. Powell anticipated in his August 25 Jackson Hole speech that these rates would be moderate in July, as they were in June. However, he said that two consecutive months of such moderation aren’t enough. He wants to see inflation drop closer to the Fed’s 2.0% target on a y/y basis. The headline and core PCED inflation rates were 3.3% and 4.2% on a y/y basis during July (Fig. 17). He focuses on the core rate, which, by the way, rose at an annualized rate of just 2.9% over the past three months.
Headline goods inflation was -0.5% y/y in July. Housing services inflation (for rent, etc.) peaked at the start of this year and is slowly heading lower. Non-housing services inflation has been stuck around 5.0% for the past two years and remains one of Powell’s major concerns about inflation (Fig. 18).
Excluding rent, the headline and core PCED inflation rates were only 2.6% and 3.6% in July on a y/y basis (Fig. 19).
We are still predicting that the core PCED inflation rate will fall close to 3.5% by the end of this year and 2.5% by the end of next year (Fig. 20).
Movie. “The Crowded Room” (+) (link), an Apple TV+ series, is a slow-paced psychological thriller. So it isn’t very thrilling and is only mildly entertaining. Tom Holland plays the lead role of a young man dealing with some major childhood trauma. His psychologist is played by Amanda Seyfried. Previously, he starred in a couple of Spiderman flicks, and she played scamstress Elizabeth Holmes in “The Dropout.” This series failed to provide either actor with a good script to show off their talents.
Hooray! The Job Market Is Rebalancing
August 31 (Thursday)
Check out the accompanying pdf and chart collection.
Executive Summary: The stock market has proven resilient so far this week, rallying despite the Fed chair’s hawkish speech Friday. Several tailwinds have helped: The JOLTs report on Tuesday suggested the labor market is rebalancing, upping the odds that the Fed is done tightening. Joe’s data show that analysts have been raising earnings estimates in recent weeks for all future periods they forecast and that more companies’ outlooks have improved over the past three months than was true at the data’s recent low point last year. The rolling recession in goods-related industries looks poised for a rolling recovery soon. … Also: Loan growth has been falling in the US and Europe, but the US economy remains resilient.
US Strategy: Forward Earnings Remains on Recovery Road. The stock market rallied from Friday through Wednesday despite Fed Chair Jerome Powell’s hawkish speech at Jackson Hole on Friday. The rally received a bullish jolt from July’s JOLTS report on Tuesday morning showing both fewer job openings and fewer quits than expected during the month.
These are bullish developments, as we discuss further below, because they suggest that the labor market is “rebalancing,” with demand for labor easing. Powell has stressed the importance of these two variables for the setting of monetary policy. Both are heading in the right direction, i.e., the one that increases the likelihood that the Fed is done raising interest rates.
Also heading in the right direction are analysts’ consensus expectations for the operating earnings of the S&P 500. During Q2, the actual result fell 5.3% y/y, led by a 48.0% y/y drop in the Energy sector. Excluding Energy, S&P 500 earnings rose 3.4%. Meanwhile, industry analysts have been raising their earnings estimates for 2023, 2024, and 2025 in recent weeks (Fig. 1). They’ve also been raising their estimates for the final two quarters of 2023 as well as all four quarters of 2024 (Fig. 2 and Fig. 3).
There’s no recession apparent in the analysts’ consensus earnings forecasts. Let’s review the latest data:
(1) Quarterly. Here are the actual and current expected y/y quarterly growth rates for 2023 (-3.1%, -5.3%, -0.1%, and 9.1%). Here are the expectations for 2024’s quarters (8.8%, 12.0%, 12.7%, and 12.8%).
(2) Annually. The analysts are currently expecting that earnings on a “frozen actual” basis will rise 11.8% y/y next year to $247.09 from $221.01 this year, which would be up 1.3% from 2022 (Fig. 4). They expect 2025 earnings to increase 12.6% to $278.10.
(3) Forward. During the August 24 week, S&P 500 forward revenues rose to yet another record high (Fig. 5). S&P 500 forward earnings is still below its record high of $239.93 during the week of June 23, 2022. However, it bottomed this year during the February 9 week and is up 5.4% since then to $238.06 during the August 24 week. (FYI: Forward revenues and earnings are the time-weighted average of analysts’ consensus expectations for the current year and following year. The forward profit margin is calculated by us from forward revenues and earnings.)
These two series suggest that the latest earnings recession was wholly attributable to the decline in the profit margin. Indeed, the forward profit margin fell from a record high of 13.4% during the week of June 9, 2022 to a recent low of 12.3% during this year’s March 30 week. It rose to a seven-month high of 12.6% during the latest week of August 24.
(4) Earnings breadth. Joe calculates a series showing the percentage of S&P 500 companies with positive three-month percent changes in forward earnings (Fig. 6). It was up to 73.3% at the end of August from a recent low of 44.4% during the December 30 week of 2022.
(5) Bottom line. Joe and I believe that the earnings recession ended in Q2. Revenues growth is likely to slow along with inflation in our forecast. However, that should be more than offset by the ongoing rebound in the profit margin.
We are still estimating that S&P 500 earnings per share will be $225 this year, $250 next year, and $270 in 2025 (Fig. 7). We haven’t changed these estimates since last November. They’ve been higher than the consensus of investment strategists mostly because we’ve been in the soft-landing rather than the hard-landing camp since last year.
Heads up: Once we have all the final numbers for Q2, we may shave our 2023 earnings estimate, but we will stick with our 2024 and 2025 numbers. Can you believe that we are already starting to think about 2025? That’s because the market is probably starting to do so, and industry analysts already have earnings estimates that far out. How time flies!
US Economy I: Job Openings & Quits Falling. Job openings fell by 338,000 to 8.8 million during July, the lowest since March 2021 (Fig. 8). This series is highly correlated with the “jobs plentiful” series included in the monthly survey of consumer confidence. The latter fell from 43.7% saying so in July to 40.3% in August, the lowest since April 2021.
In discussing the “rebalancing” of the labor market in his Jackson Hole speech, Powell said: “Demand for labor has moderated as well. Job openings remain high but are trending lower.” He views this as a favorable development. We do too, and so do the stock and bond markets.
In Powell’s previous recent remarks on the labor market, he noted that the quits rate (which is reported along with job openings in the JOLTS report) is highly correlated with measures of wage inflation. He has been rooting for the quits rate to decline to reduce wage inflation. That seems to be happening. The quits rate for private industry fell from 2.7% during June to 2.5% during July, the lowest since November 2020. It tends to lead wage inflation by about six months (Fig. 9).
Workers tend to have a higher propensity to change jobs when there are more opportunities to get a pay increase by doing so. That certainly was the case last year. It’s increasingly less so this year.
US Economy II: Rolling Recovery For Goods? Yesterday, Jackie reviewed the rolling recession that hit retailers especially hard during Q2 of this year; we reckon it actually started in late 2021 when consumers pivoted from buying lots of goods to purchasing lots of services. The good news is that the goods sector may soon experience a rolling recovery.
That’s based on our reading of August’s regional business surveys conducted by five of the 12 Federal Reserve district banks. The average of their general business indexes rose from a recent low of -16.5 during May to -6.2 during August (Fig. 10). This series is highly correlated with the national M-PMI, which was 46.4 during July. The August result will be released on Friday. We expect a reading up closer to 50.0.
Global Credit: Loan Growth Falling in US & Eurozone. Monetary policy works with a long and variable lag. The major central banks started tightening their monetary policies early last year in response to surging inflation. In the US, the yield curve inverted last summer, suggesting that the odds of a financial crisis triggering a credit crunch and a recession were increasing.
Sure enough, a banking crisis occurred during March of this year. However, it didn’t morph into a credit crunch because the Fed responded quickly with an emergency lending facility for the banks. At the same time, Credit Suisse imploded in Europe. However, Europe’s banking crisis also was contained; it didn’t turn into a credit crunch.
Nevertheless, the yield curve remains inverted in the US. The growth rates of bank loans in the US and in Europe are falling. The US economy remains resilient, while the European economy is less so. Both will be weighed down by tightening credit conditions. Let’s review the latest relevant data:
(1) US bank loans. The growth rate of loans and leases at all commercial banks in the US fell to 4.8% y/y during the August 16 week (Fig. 11). That’s down from a recent peak of 12.5% during the December 7, 2022 week. That’s a slowdown, but it isn’t a credit crunch.
Here are the latest y/y growth rates of the banks’ major loan categories: commercial & industrial (0.8%), commercial real estate (7.8%), mortgages (5.8%), and consumer credit (5.8%) (Fig. 12).
Also available on a weekly basis is consumer credit card balances at the banks, which is up 11.4% y/y (Fig. 13). Auto loans is down 2.2% y/y, signaling that credit conditions and demand are deteriorating in this segment of the banks’ loan portfolios.
(2) Eurozone MFI loans. Outstanding loans held by the Eurozone’s monetary financial institutions (MFIs) fell by €58 billion through July after having peaked at a record €13.1 trillion during last September (Fig. 14).
Consumers Spending Selectively
August 30 (Wednesday)
Check out the accompanying pdf and chart collection.
Executive Summary: The rolling recession hit the retail industry during the first half of this year. Demand for many retailers’ merchandise plummeted during Q2, even as consumers paid up for services like travel and dining and big-ticket items like new cars and homes. Jackie examines how the shift in consumer behavior affected the earnings of particular retailers last quarter as well as the ytd performance of particular Consumer Discretionary industries’ share price indexes. … Also: US households are in good shape right now with unemployment low. But consumer debt has been on the rise, and other factors may weigh on consumer spending soon—including the resumption of student loan payments.
Consumer Discretionary I: Retailing’s Rolling Recession. In recent weeks, many retailers have reported y/y declines in Q2 revenue, including Foot Locker, Home Depot, Lowe’s, Macy’s, Nordstrom, and Target. There were some exceptions, including Walmart and TJX; but in general, the rolling recession that we have tracked as it has rolled through various industries also has hit hard-goods retailers.
The tough retailing environment hasn’t held back the S&P 500 Consumer Discretionary sector, however. It handily beat the ytd performance of the S&P 500 and eight other sectors (through Monday’s close): Communication Services (40.0%), Information Technology (39.0), Consumer Discretionary (29.6), S&P 500 (15.5), Industrials (9.0), Materials (4.5), Energy (-0.2), Financials (-0.4), Real Estate (-0.9), Health Care (-1.9), Consumer Staples (-2.0), and Utilities (-10.3) (Fig. 1).
While consumers haven’t been shopping ’til they drop lately, they have been out and about, paying up for services and big-ticket items like cars and homes. Among the Consumer Discretionary sector’s top performing component industries so far this year are Hotels, Resorts & Cruise Lines (up 44.6% ytd), Casinos & Gaming (19.6%), and Restaurants (7.4%). Even more impressive, the Automobile Manufacturers industry is up 73.3% ytd thanks to shares of Tesla, which have raced ahead by 93.9% ytd. More modest ytd gains have been logged by other auto-related industries: Automotive Parts & Equipment (9.3%) and Automotive Retail (3.4%). The Homebuilding industry is another star performer in the sector, up 34.8% ytd, as the lack of home inventory has offset the impact of rising mortgage interest rates—so far.
Meanwhile, the Consumer Discretionary sector’s retail-related industries have had a miserable year, with most of them posting negative returns ytd: Housewares & Specialties (-20.3%), Apparel, Accessories & Luxury Goods (-15.8), Footwear (-14.9), Other Specialty Retail (-8.7), Computer & Electronics Retail (-7.7), Home Furnishings (-4.0), Household Appliances (-3.5), Home Improvement Retail (5.6), and Apparel Retail (10.4) (Table 1).
Apparel Retail, with star constituent TJX, is an exception, as US consumers love a bargain in good times and bad. Amazon’s shares also have bucked the downtrend; they rose 58.5% ytd, as revenue from the company’s cloud services and advertising business lines grew faster than expected last quarter. Amazon’s shares are in the Broadline Retail industry, which was created earlier this year and therefore doesn’t have a y/y comparison. If Amazon and Tesla stocks were eliminated from the S&P 500 Consumer Discretionary sector, the sector’s ytd return would be 5.5% instead of 29.6%, Joe calculates.
But outside of a few bright spots, most retailers are struggling regardless of whether they’re selling candles, high fashion, or sneakers. Growing sales is tough this year, and growing profits is even tougher. Let’s take a look at what’s ailing some of the retailers in the S&P 500 Consumer Discretionary sector:
(1) Tough times in the kitchen. Newell Rubbermaid, the sole constituent of the Housewares & Specialties industry, makes Rubbermaid kitchen products, Sharpie pens, Coleman gear, Yankee Candles, Paper Mate pens, and Elmer’s glue, among other things. It posted a 13.0% y/y decline in Q2 sales to $2.2 billion and adjusted Q2 earnings per share of 24 cents compared to 56 cents in the year-ago quarter. The company has a new CEO and is in the process of restructuring by reducing its number of brands, prioritizing the top countries in which it sells, and streamlining its manufacturing and distribution processes.
Analysts are hoping that next year brings better results. They’re forecasting a 1.4% increase in sales and 26.8% earnings growth in 2024, a fast improvement from the 12.2% and 45.9% declines expected this year (Fig. 2 and Fig. 3). Other home-related industries with stock price indexes that have fallen ytd include Household Appliances (-3.5%) and Home Furnishings (-4.0%).
(2) Fashion and footwear flounder. Consumers seem to be thinking twice before splurging, whether it be on high-end duds or kicks to lounge around in. The S&P 500 Apparel, Accessories & Luxury Goods industry includes retailers Ralph Lauren (up 7.7% ytd), Tapestry (-12.8%), and VF Corp. (-30.3%). Ralph Lauren’s international exposure helped boost its overall fiscal Q1 (ended July 1) performance, as weakness in North America was offset by strength in Europe and Asia.
The shares of Tapestry, which owns Coach and Kate Spade, fell sharply earlier this month following news that it plans to buy Capri Holdings, owner of Versace, Jimmy Choo, and Michael Kors, for $8.5 billion. Mid-tier or aspirational luxury brands have had a tough time attracting squeezed consumers and an even tougher time competing against European luxury conglomerates that dominate the high end of the industry, an August 25 WSJ article reported. Meanwhile, VF Corp. has struggled as its Vans shoes have lost their cool and the company recently hired a new CEO who lacks a background in apparel and footwear retail.
The S&P 500 Footwear industry’s sole member is Nike. It reported a 5% sales increase in fiscal Q4 (ended May 31) but a 28% drop in net income to $1.0 billion, citing higher operating and freight expenses, a higher tax rate, and product markdowns. Facing new competition from On, Hoka, and others, Nike—like many retailers—has needed to trim excess inventory. Nike has also been hurt by disappointing results at Footlocker, a major retailer of Nike products. Footlocker recently reported a 9.9% sales decline in its fiscal Q2 (ended July 29), and management has lowered its outlook guidance and suspended the stock’s dividend.
(3) Pressure on lotion & makeup. The S&P 500 Other Specialty Retail industry includes Bath & Body Works (-15.0% ytd), Ulta (-12.4%), and Tractor Supply (-2.7%). Bath & Body Works expects sales to decline 1.5%-3.5% in 2023. Investors looked past Ulta’s 10.1% revenue growth in the quarter ended July 29 and focused instead on the 110bps decline in gross margin to 39.3%, which was blamed on inventory shrink (goods stolen from stores) and higher supply-chain costs. The shrink problem has become a recurring theme for retailers as varied as Ulta, Macy’s, and Dick’s Sporting Goods.
(4) No new computers needed. During the Covid pandemic, consumers working from home and students learning from home scrambled to buy larger and faster computers. That surge of buying pulled forward sales and hurt the industry in the ensuing years. Yesterday, Best Buy reported big y/y declines in its fiscal Q2 (ended July) sales and earnings: Sales dropped by 7.2% to $9.6 billion and adjusted earnings per share fell 20.8% to $1.22. Best Buy shares rallied 3.9% on Tuesday nonetheless because those results beat analysts’ consensus expectations and management said that demand is likely to improve in 2024.
“[W]e continue to expect that this year will be the low point in tech demand after two years of sales declines. Next year the consumer electronics industry should see stabilization and possibly growth driven by the natural upgrade and replacement cycles and the normalization of tech innovation,” said CEO Corie Barry in a company press release. Best Buy is the sole member of the S&P 500 Computer and Electronics Retail industry. After two years of earnings declines, analysts are hopeful the industry will post earnings growth north of 10% in 2024.
(5) Consumers love a bargain. The one retail-related industry that has fared well this year is the S&P 500 Apparel Retail industry; its stock price index has risen 10.4% ytd. The industry includes Ross Stores (up 3.3% ytd) and TJX (13.4%). The off-price retailers always seem to have a following, as consumers love hunting for a bargain. TJX also benefits from having the HomeGoods and HomeSense stores, which likely have gained shoppers who had frequented the now defunct Bed Bath and Beyond stores. TJX sales rose 7.7% to $12.8 billion in its fiscal Q2 (ended July 29), and its net income jumped 22.1% to $989 million.
Consumer Discretionary II: Not Shopping Doesn’t Mean Not Spending. Even as interest rates have risen this year, consumers have continued to spend on travel, dining, and new homes. Most are employed, have received a raise or two in recent years, and still have low debt service costs relative to their incomes. Student loan payments are set to resume in October, and gasoline prices have been creeping up, which could crimp consumer spending. But generally speaking, consumers remain in solid shape.
Here's some of the recent data on the consumer’s financial state:
(1) Gainfully employed. Tuesday brought news from the JOLTS report that the labor market continued to cool off modestly this summer. Job openings declined by 338,000 in July m/m to 8.8 million seasonally adjusted, and the quits rate declined to 2.3% in July from 2.4% in June. Fewer quits suggests that employees may be growing slightly more concerned about the employment picture. That said, both statistics indicate that the labor market remains strong: Job openings is far above its 2019 average of 7.2 million, and the quits rate is back down at its 2019 average (Fig. 4).
The next reading on the job market comes on Friday with the release of the August employment report. In July, with the unemployment rate at 3.5%, almost everyone who wanted a job had a job (Fig. 5). The adult unemployment rate was even lower, at 3.2%, and the rate for people with a bachelor’s degree was only 2.0%. Even those with no high-school degree had an unemployment rate of only 5.2% (Fig. 6).
Those who have a job have also benefitted from rising wages. Average hourly earnings in private industry was $33.74 in July, up 4.4% y/y and up 10.1% over the past two years (Fig. 7). No doubt, some of the wage increases have been eaten away by inflation. Personal income rose 5.3% y/y in June, while real personal income rose only 2.3%. Likewise, the YRI Earned Income Proxy (aggregate weekly hours times average hourly earnings of total private industries times 52) rose 6.3% in June but only 3.3% adjusted for inflation (Fig. 8). (The Proxy’s nominal reading fell to 5.7% y/y in July; a real rate for July is not yet available.)
(2) Watching rising debt. Consumers have been borrowing more freely this year. Consumer credit outstanding is at a record high of $5.0 trillion as of June (Fig. 9). Revolving credit card debt has jumped 11.2% y/y to $1.3 trillion as of June, and nonrevolving debt—which includes auto and student loans—has jumped 4.0% y/y to $3.7 trillion as of June.
Some solace comes from the household debt service ratio, which at 9.6 as of Q1 remains low by historical standards (Fig. 10). However, it should continue to climb along with interest rates, which are up sharply since Q1; the 10-year Treasury bond yield is 4.20%, up from 3.48% at the end of Q1. And while personal savings has fallen to $742 billion as of June, well below its March 2021 peak of $3.5 trillion, it remains solidly above the 12-month change in consumer credit outstanding, which is $271 billion (Fig. 11).
This may explain why the percentage of credit card loans that are delinquent by 90 days or more remains relatively low at 8.0% as of Q2. That’s above its 2022 low of 7.6% but below the average of 9.2% from 2002 through 2008 (Fig. 12).
Last week, however, Macy’s warned that it has seen a spike in the number of customers delinquent on their credit card payments. The company had expected delinquencies to climb after the post-Covid lull, but the “speed at which the increase occurred for us and the broader credit card industry … was faster than planned,” COO Adrian Mitchell said in an earnings conference call, an August 23 CNN article reported. The problem “accelerated” in June and July.
(3) Student loans & gasoline. Retailers and investors are concerned that the resumption of student loan payments in October will prompt consumers to pull back on spending. Interest starts accruing on more than $1 trillion of student loans on Friday for the first time since it was paused beginning three years ago due to the onset of the Covid pandemic. The impact may be muted over the next 12 months when interest on student loans will accrue but loans won’t be marked as delinquent or reported to credit rating agencies if payments are missed, an August 28 WSJ article reported.
The resumption of student loan payments may disproportionately affect younger consumers. Here’s a breakdown of the percent of student loan holders by age group and the average amount they still owe, courtesy of Quill Intelligence data cited in an August 29 report from The Daily Shot: under 30 years old (23%, $23,857), 30-39 years old (32%, $42,748), 40-49 (22%, $44,864), 50-59 (15%, $44,020), 60 and older (8%, $35,897).
The weekly trip to the gas station may also begin weighing on consumers’ wallets. The price of a gallon of gasoline has jumped to $3.93 as of August 28. That’s up from a recent bottom of $3.20 during the final week of 2022 (Fig. 13).
Wishing Upon An R-Star
August 29 (Tuesday)
Check out the accompanying pdf and chart collection.
Executive Summary: The Fed has no North Star. Steering monetary policy toward the ideal outcome that would keep both inflation and unemployment low requires knowing where the “neutral” federal funds rate is, i.e., the rate that wouldn’t influence either—a.k.a. “r-star.” But r-star is a theoretical construct only, neither measurable nor constant. … Also: Joe provides an update on the MegaCap-8 stocks, which haven’t been the bullish driving force behind the S&P 500’s performance that they were for most of this year. Quite the opposite.
R-Star: Twinkle, Twinkle. In his Jackson Hole speech on Friday, Fed Chair Jerome Powell waxed poetic for an instant, saying: “[W]e are navigating by the stars under cloudy skies.”
Fed officials regularly suggest—even when their decision making happens under clear skies—that they are guided by their perception of “r-star.” The problem is that r-star is a theoretical construct and cannot be measured. Even if it could be measured, what if it isn’t constant like the North Star? In this case, even if an econometric model could measure r-star at a particular point in time, its value might move higher or lower unpredictably.
Melissa and I are reminded of the Heisenberg Uncertainty Principle in physics. It states that we cannot know both the position and speed of a particle, such as an electron, with perfect accuracy; the more we nail down the particle’s position, the less we know about its speed and vice versa. If we know where it is, we don’t know how fast it is going. If we know how fast it is going, we don’t know where it is.
What is r-star exactly? Even its various definitions sound fuzzy. Here are a couple of them:
(1) The New York Times interviewed John C. Williams, president of the Federal Reserve Bank of New York, on August 7. Williams said: “I think of monetary policy primarily in terms of real interest rates, and we set nominal rates.” The interviewer explained: “Real interest rates subtract out inflation, while nominal rates include it. Estimates of the so-called ‘neutral’ rate setting that neither heats nor cools the economy are usually expressed in inflation-adjusted, real terms.” The neutral rate is another name for r-star.
(2) A much more convoluted definition can be found in the boilerplate introduction to the FOMC’s quarterly Summary of Economic Projections (SEP). The SEP shows the median forecasts of the committee for real GDP growth, the unemployment rate, the PCED inflation rate, the core PCED inflation rate, and the federal funds rate. The latest SEP shows these projections for 2023, 2024, 2025, and the “longer run.”
The SEP explains: “The longer-run projections represent each participant’s assessment of the value to which each variable would be expected to converge, over time, under appropriate monetary policy and in the absence of further shocks to the economy. ‘Appropriate monetary policy’ is defined as the future path of policy that each participant deems most likely to foster outcomes for economic activity and inflation that best satisfy his or her individual interpretation of the statutory mandate to promote maximum employment and price stability.”
Buried in that Fedspeak is the notion that the projected path of the federal funds rate should be the ideal one that over the next three years (or so) takes us to the Promised Land of low unemployment and low inflation, consistent with the Fed’s congressional dual mandate. So r-star should be the value of the federal funds rate that over the long run “fosters” the ideal outcomes for economic growth and inflation.
According to June’s SEP, the federal funds rate’s path should be 5.6%, 4.6%, and 3.4% for 2023, 2024, and 2025 and settle at 2.5% over the longer run. That path should deliver longer-run real GDP growth of 1.8% and inflation of 2.0%. So is 2.5% r-star? No because the 2.5% is a nominal rate, unadjusted for inflation. Okay, then if long-run inflation is 2.0%, r-star would be 0.5%. But wait: Does it make any sense to adjust the federal funds rate, which is an overnight rate, by longer-run inflation, a y/y rate?
This is more astrology than astronomy.
(3) Yesterday, in our analysis of Fed Chair Jerome Powell’s Jackson Hole Speech, we wrote: “Powell said that the Fed is monitoring real interest rates and that they are ‘now positive and well above mainstream estimates of the neutral policy rate,’ which is widely referred to as r-star. However, he strongly suggested that r-star is a useless concept for policymakers. We agree. That’s because it can’t be measured: ‘But we cannot identify with certainty the neutral rate of interest, and thus there is always uncertainty about the precise level of monetary policy restraint.’”
(4) In the interview cited above, John Williams explained why he believes that real interest rates matter: “Assuming inflation continues to come down … next year, as many forecast, including the [FOMC members’] economic projections, if we don’t cut interest rates at some point next year then real interest rates will go up, and up, and up. And that won’t be consistent with our goals. So … from my perspective, to keep maintaining a restrictive stance may very well involve cutting the federal funds rate next year or [the] year after; but really, it’s about how are we affecting real interest rates—not nominal rates.”
That’s the scenario outlined in June’s SEP. It is the one we are rooting for, of course.
Strategy: MegaCap-8 No Longer Providing as Much Oomph. The MegaCap-8 group of stocks (i.e., Alphabet, Amazon, Apple, Meta, Microsoft, Netflix, Nvidia, and Tesla)—currently accounting for about a fourth of the S&P 500’s capitalization—has led the index higher in a big way so far in 2023. The stocks’ improved performances this year in part reflects much improved revenues and earnings growth prospects for most of the eight companies.
Recently, however, the MegaCap-8’s valuation has pulled back and the group’s collective market cap has shrunk some following the companies’ Q2 earnings releases. Even though the companies’ Q2 results were mostly strong and even though these eight stocks still account for a large part of the S&P 500’s market capitalization, their earnings strength hasn’t lifted the S&P 500’s performance the way it had been doing for most of this year. Stock investors’ angst over the bond market seems to be the gating factor.
Currently, the group’s collective valuation isn’t as cheap as it was when the year began but is a good deal cheaper than during 2020-21, when the MegaCap-8’s forward P/E flirted with 39 (Fig. 1).
I asked Joe to update us on the MegaCap-8. Here’s his report:
(1) Market capitalization. The combined market cap for the MegaCap-8 stocks tumbled 41.5% in 2022 before rebounding 66.8% ytd to an 18-month high of $11.8 trillion through July 18. Since then, it has corrected in garden-variety fashion, dropping 6.4% to $11.0 trillion; that leaves it up 56.2% ytd through Friday’s close (Fig. 2).
As a percentage of the S&P 500’s market cap, the group soared from 19.4% at the start of the year to a record-high 27.3% during the July 14 week, before dropping to 26.0% during the August 18 week (Fig. 3).
(2) Valuation slipping after rising sharply. The MegaCap-8’s forward P/E rose above 30.0 in mid-June for the first time in 15 months but has since dropped below that mark, as investor activity has not maintained the group’s valuation despite strong Q2 earnings. After the forward P/E bottomed at 21.1 during the January 6 week, it soared 46% to its 2023 high of 31.2 as of the July 14 week. The forward P/E is now down 12% since then to 27.4, which remains below the record high of 38.5 during the August 28, 2020 week.
Looking at the individual MegaCap-8 stocks, forward P/Es rose for all of them from January 6 through mid-July. With the stock market in decline since the end of July amid higher interest rates, just five of the MegaCap-8 stocks now—as of Friday’s close—are valued above their January 6 bottoms, as Joe shows below.
Here’s how much valuation has changed for each of the MegaCap-8 stocks since the S&P 500’s January 6 bottom through Friday’s close: Alphabet (up 23% to 20.5 from 16.6), Amazon (down 4% to 47.0 from 48.8), Apple (up 34% to 27.2 from 20.3), Meta (up 14% to 18.2 from 16.0), Microsoft (up 34% to 28.7 from 21.4), Netflix (down 1% to 29.2 from 29.4), Nvidia (down 4% to 33.2 from 34.5), and Tesla (up 152% to 55.5 from 22.0).
Counterintuitively, Nvidia’s sharp valuation decline followed the company’s stunningly good Q2 earnings release and sharply increased forward guidance, while Tesla’s eye-popping valuation gain occurred despite the company’s declining forward earnings. It can be disconcerting for investors when valuations temporarily disconnect from a company’s earnings prospects, but it can also provide an opportunistic entry point for investors.
(3) Forward revenues and earnings. Seven of the MegaCap-8 companies have enjoyed both rising forward revenues and rising forward earnings so far in 2023. The only laggards are Apple’s forward revenues and Tesla’s forward earnings. As a group, the MegaCap-8’s forward revenues has jumped 8.3% ytd, and its forward earnings has soared 23.4%—trouncing the S&P 500’s forward revenues rise of 4.0% ytd and forward earnings gain of only 3.4% ytd. (FYI: Forward revenues and earnings are the time-weighted averages of industry analysts’ estimates for the current year and following one.)
Here’s how each of the MegaCap-8 companies’ forward revenues and earnings forecasts have performed ytd: Alphabet (forward revenues up 6.8%, forward earnings up 11.9%), Amazon (9.4, 72.6), Apple (-1.3, 3.5), Meta (18.5, 97.3), Microsoft (6.3, 8.4), Netflix (8.3, 35.7), Nvidia (131.7, 228.8), and Tesla (4.0, -19.3). Nvidia’s surge in such a short period on expectations for AI chip sales is stunning, and certainly ranks among the all-time top performers (i.e., since consensus forecasts were first calculated over 40 years ago).
(4) Forward profit margin. The S&P 500’s forward profit margin has dropped this year, but barely, to 12.5% during the August 20 week from 12.6% at the start of the year (Fig. 4). The MegaCap-8’s collective margin has surged from 18.0% to 20.6%, with 1.3ppts of that gain coming since the Q2 earnings season started. Among the MegaCap-8s, all but Tesla have seen their forward profit margin rise ytd: Alphabet (up from 23.0% to 25.4%), Amazon (3.0 to 4.7), Apple (25.2 to 26.4), Meta (21.1 to 29.4), Microsoft (34.6 to 34.9), Netflix (14.1 to 17.5), Nvidia (36.7 to 51.5), and Tesla (15.9 to 12.7) (Fig. 5).
(5) Q2 revenue and earnings results. During 2022, the MegaCap-8’s revenues and earnings growth sagged. Quarterly revenues growth remained positive on a y/y basis but dropped to single-digit percentage rates. Earnings fared much worse, falling y/y for four straight quarters through Q1-2023.
During Q2-2023, y/y growth improved markedly for revenues and turned positive again for earnings. The MegaCap-8’s revenues rose 10.2% y/y in Q2-2023 following a 4.6% rise in Q1-2023, and the group’s earnings jumped 29.9% y/y after declining 3.5% in Q1. In stark contrast, the S&P 500’s revenues were up 1.2% y/y during Q2-2023, while its earnings dropped 5.4% y/y.
The Chairman’s Speech
August 28 (Monday)
Check out the accompanying pdf and chart collection.
Executive Summary: Today, we examine Fed Chair Jerome Powell’s Jackson Hole speech on Friday. The tone was more hawkish than we expected, with Powell saying that the Fed wouldn’t hesitate to raise interest rates further if needed to bring inflation back down to the Fed’s 2.0% target but failing to say what it would take for the Fed to lower interest rates given that inflation has been moderating. … We also examine 12 sets of economic data that Powell monitors, sharing what he said their recent readings indicate and our observations on each. … And Dr. Ed reviews “Painkiller” (+).
YRI Weekly Webcast. Join Dr. Ed’s live webcast with Q&A on Mondays at 11 a.m. EST. You will receive an email with the link one hour before showtime. Replays of the weekly webcasts are available here.
Fed I: ‘Navigating by the Stars Under Cloudy Skies.’ Everyone who has heard or read Fed Chair Jerome Powell’s speech at Jackson Hole on Friday probably agrees: It was hawkish on the whole. He did acknowledge that inflation has moderated since last summer and that it continued to do so over the past two months. However, he did not directly confirm or even suggest what Melissa and I were hoping to hear: that if inflation continues to moderate, the Fed will probably lower the federal funds rate sometime next year. That would have been totally consistent with the FOMC’s June Summary of Economic Projections (SEP). That’s also still our outlook.
Instead, Powell concluded by saying: “At upcoming meetings, we will assess our progress based on the totality of the data and the evolving outlook and risks. Based on this assessment, we will proceed carefully as we decide whether to tighten further or, instead, to hold the policy rate constant and await further data.” There was no mention of what it would take for the Fed to lower interest rates. Again, the latest SEP shows that the FOMC is expecting to lower the federal funds rate in 2024 and 2025 as inflation falls toward the committee’s 2.0% target.
Powell’s speech was all about inflation. Indeed, it was titled “Inflation: Progress and the Path Ahead.” He started the speech by stating: “It is the Fed’s job to bring inflation down to our 2 percent goal, and we will do so.” He clearly sought to dispel any notion that the Fed might raise its inflation target. Near the end of his speech, he said: “Two percent is and will remain our inflation target.”
Powell acknowledged that the federal funds rate is currently restrictive. However, Fed officials aren’t sure if it is restrictive enough to bring inflation down over time to 2.0%. He strongly reiterated that if inflation stalls or heads back up again, the Fed won’t hesitate to raise interest rates further.
Powell said that the Fed is monitoring real interest rates and that they are “now positive and well above mainstream estimates of the neutral policy rate,” which is widely referred to as r-star (or r*). However, he strongly suggested that r-star is a useless concept for policymakers. We agree. That’s because it can’t be measured: “But we cannot identify with certainty the neutral rate of interest, and thus there is always uncertainty about the precise level of monetary policy restraint.”
For an instant, Powell waxed poetic: “[W]e are navigating by the stars under cloudy skies.” These would make good lyrics for the Fed’s official anthem.
Complicating the Fed’s assessment of the restrictiveness of its monetary policy are the long and variable lags of monetary policy: “Since the symposium a year ago, the Committee has raised the policy rate by 300 basis points, including 100 basis points over the past seven months. And we have substantially reduced the size of our securities holdings. The wide range of estimates of these lags suggests that there may be significant further drag in the pipeline.”
Powell didn’t mention any of the specific factors—one of which was monetary policy—that caused inflation to soar in 2021 and 2022. He blamed “unprecedented pandemic-related demand and supply distortions.” He explained that the tightening of monetary policy aimed to “slow the growth of aggregate demand, allowing supply time to catch up.” He predicted that “the process still has a long way to go, even with the more favorable recent [inflation] readings.”
The speech ended with a pledge: “We will keep at it until the job is done.”
Fed II: Powell’s Inflation Dashboard. Of course, Fed policy remains data dependent. In fact, Powell mentioned “data” nine times in his speech (including the footnotes). Let’s review the various data series he flagged:
(1) Inflation (core PCED). Powell focused on the core PCED measure of inflation, which excludes food and energy, because these volatile components “can provide a misleading signal of where inflation is headed.”
Core PCED inflation peaked at 5.4% y/y in February 2022. It declined gradually to 4.1% in June, and only 3.3% at an annual rate over the past three months through June (Fig. 1 and Fig. 2). The Fed staff estimates that it edged back up to 4.3% in July based on the month’s CPI.
Nevertheless, Powell said that “lower monthly readings for core inflation in June and July were welcome, but two months of good data are only the beginning of what it will take to build confidence that inflation is moving down sustainably toward our goal.” In any event, he noted, the latest core 12-month inflation rate is still too high relative to the Fed’s target of 2.0%.
(2) Inflation (core PCED goods). As in Powell’s November 30, 2022 speech “Inflation and the Labor Market,” he separately examined the three broad components of core PCED inflation—inflation for goods, for housing services, and for non-housing services (Fig. 3).
Powell started with a brief analysis of core goods inflation (Fig. 4). Here are last year’s peaks and June’s readings for the inflation rates of core PCED goods (7.6%, 1.7%), core PCED nondurable goods (6.3%, 4.2%), and durable goods (10.6%, -0.4%).
Powell’s assessment of the progress made in lowering core goods inflation was cautious: “Core goods prices fell the past two months, but on a 12-month basis, core goods inflation remains well above its pre-pandemic level. Sustained progress is needed, and restrictive monetary policy is called for to achieve that progress.”
(3) Inflation (core PCED housing and non-housing services). Powell then explained why he is relatively optimistic about the rent component of the PCED, which accounts for 15.0% of the headline PCED, 16.9% of the core PCED, and 22.5% of PCED services.
He noted that current inflation rates of market rents on new leases, as measured by Zillow and CoreLogic, have dropped sharply since last summer from peaks of 13%-16% y/y to around 2%-4% currently (Fig. 5). These declines are only now starting to lower the PCED measure of rent inflation: “Because leases turn over slowly, it takes time for a decline in market rent growth to work its way into the overall inflation measure.”
Powell’s big hangup is with the non-housing services components of the PCED measure of inflation, which “accounts for over half of the core PCE index and includes a broad range of services, such as health care, food services, transportation, and accommodations.” It has moved sideways around 4.5% from July 2021 through this June (Fig. 6).
A look at the seven major components of PCED services shows that transportation inflation has dropped sharply from 16.7% during October 2022 to 3.6% in June (Fig. 7). The stickiest component other than housing & utilities (7.0%) has been food services & accommodation, currently at 6.5%. Recreation services, currently 4.7%, has been stuck around 5.0% since early last year. Not participating at all in the inflation spike has been health care (2.2%).
(4) Economic growth (GDP). Melissa and I take issue with the following statement Powell made in his speech: “Getting inflation sustainably back down to 2 percent is expected to require a period of below-trend economic growth as well as some softening in labor market conditions.”
In our opinion, the labor market is tight because of a chronic shortage of labor attributable to demographic factors. That won’t change with an economic slowdown. But what’s happening in response, we believe, is that company managements increasingly are using technology-based innovations to boost productivity. That should boost economic growth and dampen inflationary pressures. It should also lift real wages and increase corporate profitability. The relationship between real GDP growth and inflation as measured by the GDP price deflator is a weak one at best and unpredictable (Fig. 8).
(5) Economic growth (consumer spending). Nevertheless, Powell and his colleagues still believe in the questionable Phillips Curve paradigm that posits an inverse relationship between the inflation rate and the unemployment rate and a direct one between inflation and economic growth. They believe that tight monetary policy should slow the growth of demand, especially consumer demand, which should boost the unemployment rate, cooling price and wage inflation.
And demand is still too strong, Powell said: “But we are attentive to signs that the economy may not be cooling as expected. So far this year, GDP … growth has come in above expectations and above its longer-run trend, and recent readings on consumer spending have been especially robust.”
In our opinion, however, the Phillips Curve is flawed: The relationship between the growth rate of real consumer spending and inflation as measured by the PCED is also a weak one at best and unpredictable (Fig. 9).
(6) Economic growth (housing). Powell noted that even housing is showing signs of “picking back up.” His hawkish conclusion was: “Additional evidence of persistently above-trend growth could put further progress on inflation at risk and could warrant further tightening of monetary policy.”
However, the recent renewed jumps in mortgage interest rates and mortgage applications to purchase homes strongly suggest that housing’s recent recovery is already crumbling (Fig. 10).
(7) Labor supply (participation rate). Powell closely monitors the relationship between labor supply and labor demand. He noted that the supply side has improved, “driven by stronger participation among workers aged 25 to 54 and by an increase in immigration back toward pre-pandemic levels. Indeed, the labor force participation rate of women in their prime working years reached an all-time high in June.”
The labor force participation rate of the civilian noninstitutional working-age population bottomed at 60.1% during April 2020 and rose to 62.6% in July (Fig. 11). The labor force participation rate of 25- to 54-year-olds rose to 83.4% during July, exceeding its pre-pandemic high of 83.1% during January 2020 (Fig. 12).
(8) Labor demand (job openings & payroll growth). Powell also closely watches the JOLTS measure of job openings. The three measures of job openings that we track (including the JOLTS series) all have been declining this year but remain historically high (Fig. 13). Powell observed: “Demand for labor has moderated as well. Job openings remain high but are trending lower.”
(9) Labor demand (aggregate hours worked & average workweek). Powell also mentioned that payroll employment growth has slowed significantly, aggregate hours worked has been flat over the past six months, and the average workweek has declined to the lower end of its pre-pandemic range, “reflecting a gradual normalization in labor market conditions” (Fig. 14, Fig. 15, and Fig. 16).
Nevertheless, Powell warned: “We expect this labor market rebalancing to continue. Evidence that the tightness in the labor market is no longer easing could also call for a monetary policy response.”
(10) Labor market (unemployment & wages). Powell acknowledged that “rebalancing” of supply and demand in the labor market “has eased wage pressures.” Measures of wage inflation—including average hourly earnings, wages in the employment cost index, and the wage growth tracker—have all moderated since last summer (Fig. 17). However, they all must “slow to a rate that is consistent with 2 percent inflation.” So they need to decline from 4%-6% currently to closer to 3%, according to Powell’s previous discussions of this issue.
(11) Real interest rates. As noted above, Powell is watching real interest rates, which have turned positive this year (Fig. 18). He’s just not sure whether they are restrictive enough currently. The 10-year TIPS yield rose to 1.92% on Friday, not far from last Monday’s 2.00%, which was the highest reading since July 6, 2009.
(12) Financial conditions. Powell is monitoring various measures of financial conditions and believes that restrictive monetary policy has tightened them: “Beyond changes in interest rates, bank lending standards have tightened, and loan growth has slowed sharply. Such a tightening of broad financial conditions typically contributes to a slowing in the growth of economic activity, and there is evidence of that in this cycle as well. For example, growth in industrial production has slowed, and the amount spent on residential investment has declined in each of the past five quarters.”
Commercial bank loans are up 4.8% y/y, the slowest pace since February 23, 2022 (Fig. 19). Industrial production was down 0.2% y/y through July (Fig. 20).
Movie. “Painkiller” (+) (link) is another miniseries about how the Sackler family made a fortune selling OxyContin produced by their company, Purdue Pharmaceuticals. They were essentially drug dealers assisted by the do-nothing US Food and Drug Administration. This series was produced by Netflix and isn’t as good as Hulu’s “Dopesick,” which was released in 2021. The latest series is like a fast-paced caricature of the earlier one and stars Matthew Broderick in the lead role of Dr. Richard Sackler. His performance pales in comparison to Michael Stuhlbarg’s portrayal of Sackler in the original. In any case, both series clearly depict the deadly OxyContin crisis that killed so many people and shattered so many families. Even more deadly today is the fentanyl crisis. The government may be assisting this one too, by failing to keep this narcotic from pouring across the Rio Grande.
FTC, Tech & Fusion
August 24 (Thursday)
Check out the accompanying pdf.
Executive Summary: The Federal Trade Commission has been taking aim at tech giants, with investigations targeting Amazon, Meta, and Microsoft. It’s also out to prevent big tech companies generally from using AI to gain unfair advantages and from buying their way into market dominance by acquiring smaller companies. Jackie examines where FTC Chair Lina Khan is leading the agency. … And in our Disruptive Technologies segment, a look at scientists’ nascent efforts to harness the power of fusion to generate energy in the hopes that it can someday replace the burning of fossil fuels.
Technology: FTC Keeps Trying. Tech industry giants Amazon, Meta, and Microsoft have been in the Federal Trade Commission’s (FTC) crosshairs. Under Chair Lina Khan’s leadership, the FTC has brought cases against each of them with mixed results. This year, the FTC failed to block both Microsoft’s acquisition of video game designer Activision Blizard and Meta’s acquisition of small VR content maker Within, drawing criticism by Republican legislators that Khan has reached beyond the FTC’s authority.
Undeterred, Khan, whose term goes through 2024, is expected to forge ahead with new cases against Amazon and Meta. She’s also rolling out new M&A guidelines and has started to consider how artificial intelligence (AI) will challenge the competitive landscape.
Here's where Khan may lead the FTC next:
(1) Amazon’s a potential target. Amazon representatives were slated to have a “last-rights” meeting with FTC commissioners earlier this month, a move that often precedes either a lawsuit or a settlement. While the FTC has not disclosed details, the commission has examined “Amazon practices, including whether it favors its own products over competitors’ on its platforms and how it treats outside sellers on Amazon.com, ” an August 7 WSJ article reported.
Over the past year, Amazon has eliminated 27 of its 30 clothing private-label brands and dropped its private-label furniture brands, an August 10 WSJ article reported. The company routinely eliminates products that don’t resonate with customers, management says, and works to boost profits by cutting unprofitable businesses. But there’s speculation that the company’s cuts were made to head off any FTC action.
Amazon is already facing an FTC lawsuit filed in June that contends that the company enrolled customers in Prime without their consent and made it difficult to cancel the service. Amazon has said the allegations are “false on the facts and the law.”
The case may be tough to prove given that millions of consumers have shown that they like the value that Prime offers. About 72% of all US households have a paid Prime membership. JPMorgan analysts estimated last year that the $139 annual subscription would cost $1,100 a year if each of its benefits were sold separately, a June 21 WSJ article reported.
(2) Meta targeted, too. The FTC has moved to impose a “blanket prohibition” on the collection of young people’s personal data by Meta. If the agency succeeds, Meta would be prohibited from profiting from data it collects from users under the age of 18 on its Facebook, Instagram, and Horizon Worlds platforms.
Regulators claim Meta “misled parents about their ability to control whom their children communicated with on its Messenger Kids app and misrepresented the access it gave some app developers to users’ private data,” a May 3 NYT article reported. The FTC would like to expand the $5 billion consent order Meta agreed to in 2020 that said the company failed to meet its commitments to overhaul its privacy practices. Meta has asked a federal court to block the FTC’s actions, arguing that it has not violated the consent order and that the agency cannot change it.
(3) Is AI next? In a May 3 NYT essay, Chair Khan makes no bones about it: The FTC will ensure that competition is preserved and consumers are protected in the new era of AI. Only a handful of companies have the computing power, cloud services, and vast data needed to develop AI. Regulators should prohibit large companies from excluding or discriminating against smaller companies to further entrench their dominance, she notes. And AI shouldn’t be used by companies to collude to inflate prices or discriminate.
Agencies will have to guard against fraud from AI-created spear-phishing emails, fake websites, and fake consumer reviews. “Scammers … can draft highly targeted spear-phishing emails based on individual users’ social media posts. Alongside tools that create deep fake videos and voice clones, these technologies can be used to facilitate fraud and extortion on a massive scale,” warns Khan.
The FTC will target not just the fraudsters but also the larger “upstream” firms that enable the fraud, she adds. And finally, laws prohibiting discrimination and the exploitive collection of personal data will be enforced if AI programs use error-filled information to lock people out of jobs, housing, or key services.
(4) Tougher new guidelines proposed. The FTC and the Department of Justice published a draft update of their Merger Guidelines, which describes how the agencies will review mergers’ and acquisitions’ compliance with antitrust laws. The proposed guidelines would make it easier to prove industry concentration: A “market consisting of 10 companies each with a 10% market share is ‘concentrated,’ where previously it would have been considered ‘unconcentrated’; and a market consisting of five companies each with a 20% market share is ‘highly concentrated,’ where previously it would be only ‘moderately concentrated,’” a July 20 note from the law firm WilmerHale explains.
The rules highlight different instances in which vertical mergers can be anticompetitive. They also discuss the harm caused by deals that eliminate potential competition. For example, when a large company acquires a smaller one in another industry, regulators must consider how capable it is of dominating the newly entered industry. And acquiring companies could be in violation of the rules if their mergers entrench or extend an existing dominant position or if they make a series of acquisitions in the same or related industries.
If adopted, the proposed guidelines would guide the agency’s investigations, but they’d have less of an impact on the courts, which rely on precedent and legislation when ruling. A newly elected Republican president presumably would replace Khan as FTC chair; the new chair would likely revise these guidelines.
Meanwhile, the new proposed guidelines may further slow the already depressed pace of tech M&A deals. Tech deals reached a high of $173 billion in Q1-2022 but dropped to $7.5 billion in Q2-2023, a June 28 InformationWeek article reported.
Disruptive Technologies: Fusion Advances. For a second time, the Lawrence Livermore National Laboratory has proved naysayers wrong by generating more energy from a fusion reaction than used to set off that reaction. That was just the latest baby step that scientists at private and public institutions have taken toward the goal of harnessing fusion to generate energy instead of burning fossil fuels, which produce the undesirable byproduct carbon dioxide. Let’s take a look:
(1) Fusion in the lab. The Lawrence Livermore National Laboratory didn’t disclose the amount of energy its second successful fusion experiment netted; but the first experiment produced 3.15 megajoules of energy after consuming 2.05 megajoules to generate the reaction. The research institute uses an inertial confinement reactor, which shoots 192 lasers at a capsule that contains a deuterium-tritium pellet. The lasers cause the pellet to collapse and a fusion reaction to occur, reported an August 9 article in Popular Mechanics.
Skeptics note that the net energy calculation fails to include the energy needed to start up the lasers and that the split-second reaction requires hours of laser-cool-down time before the next one. So it’s hard to imagine how this method of fusion can generate enough steady electricity for everyday use. But scientists are working on it.
(2) Private companies dreaming too. Many small, private companies are working to make fusion a reality, including General Fusion, Marvel Fusion, Helion Energy, Zap Energy, Avalanche Energy, ExoFusion, and Kyoto Fusioneering.
Earlier this month, General Fusion raised $25 million of new funding to build a new demonstration machine in British Columbia. Over its lifetime, it has raised $330 million, including funds from Jeff Bezos. General Fusion hopes to generate net energy by 2025 and commercialize the technology in the early 2030s, an August 9 GeekWire article reported.
(3) Helion strikes a deal. Washington-based Helion has contracted to sell Microsoft 50 megawatts of power generated by a Helion fusion plant by 2028, a May 10 Reuters article reported. While exact terms of the deal weren’t revealed, there reportedly are financial penalties if the power isn’t delivered. Helion’s fusion directly produces electricity, which is stored in capacitors. OpenAI CEO Sam Altman invested $375 million in Helion in 2021 and takes an active interest in the company, visiting it once a month.
Separately, Avalanche Energy raised $40 million in venture funding in April, including funds from Peter Thiel’s Founders Fund, an April 27 article in Canary Media reported.
(4) Lots of lasers. Colorado State University and Germany based Marvel Fusion are constructing a $150 million high-power laser and fusion research facility in Colorado. “Targeted for completion in 2026, the project plans to feature at least three laser systems, each with a multi-petawatt peak power and an ultra-fast repetition rate of ten flashes per second,” the university’s August 7 press release stated.
(5) Zap & CFS plugging away. Zap Energy hopes to get fusion-generated electricity onto the grid by 2030. Zap’s fusion occurs in the Fuze-O, which is the size of an office desk and has housed thousands of fusion reactions; hopefully in time it will generate net energy. The Fuze-O plus some heat exchangers and metal turbines theoretically could power up to 30,000 homes.
Commonwealth Fusion Systems, which counts Marc Benioff and Bill Gates as investors, is also developing a compact fusion reactor. Eventually, its tokamak will have a molten salt blanket that absorbs radiated neutrons; the molten salt will be pumped outside of the tokamak to heat water into steam; that steam will power a turbine to make electricity, an August 3 article in IEEE Spectrum explained. The company was spun out of MIT.
For additional information on fusion, check out the Disruptive Technology sections in the Morning Briefings of December 15, 2022, March 31, 2022, December 2, 2021, August 1, 2019.
Dueling Composite Indicators
August 23 (Wednesday)
Check out the accompanying pdf and chart collection.
Executive Summary: The Conference Board’s trio of economic indicators flashed conflicting messages in their recently reported July readings. The leading indicator says a recession is overdue. The coincident indicator keeps scaling new heights. The lagging indicator has been peaking, as it does after recessions are almost over! Today, we explore explanations in the specific components that each index measures. … Also: The CPI services inflation rate significantly lags the CPI goods inflation rate. Services’ inclusion of rent is much of the reason. … And: Q2 earnings reporting season is nearly over. Joe analyzes the near-final data on Q2 earnings growth and the encouraging estimate revisions trend.
US Economy I: Misleading Indicators? While we await Fed Chair Jerome Powell’s Jackson Hole speech on Friday, which is bound to impact the financial markets, let’s review the latest composite economic indexes.
The Conference Board compiles the Index of Leading Economic Indicators (LEI), the Index of Coincident Economic Indicators (CEI), and the Index of Lagging Economic Indicators (LAGEI). July’s indexes were released last week on Thursday. Collectively, they are a mixed bag. The LEI continues to ring the alarm bell about a recession, while the CEI continues to confirm that the economy is growing. The LAGEI is showing signs of peaking, which is what it does near the end of recessions.
So which one is right? Is the economy about to fall into a recession? Is it not about to? Or has it been in a rolling recession, which is almost over? We pick Door #3.
Here’s what we make of this trio’s July readings:
(1) LEI. The LEI peaked at a record high during December 2021 (Fig. 1). It is down 10.2% since then through July. It has declined for the past 16 consecutive months. It has correctly signaled the last eight recessions with an average lead time of 12 months. So a recession is overdue.
Debbie and I have previously shown that the yearly percent change in the LEI is highly correlated with the national M-PMI (Fig. 2). The same can be said for the former and the yearly percent change in real GDP for goods (Fig. 3). There’s almost no correlation between the yearly percent changes in the LEI and real GDP for services (Fig. 4).
We previously have shown that five of the 10 components of the LEI are related to the goods economy, which tends to be more cyclical than the services economy (Fig. 5). Three of the 10 relate to the financial markets. Two of the three track the labor market and consumer expectations. So the LEI over-weights the goods economy, which has been in a recession while the services economy has been booming.
In current dollars, services now account for 60.5% of nominal GDP, up from 39.8% at the start of the data in 1947 (Fig. 6).
(2) CEI. The CEI rose to a record high during July (Fig. 7). Its yearly percent change closely tracks the yearly percent change in real GDP (Fig. 8). Of its four components, two rose to record highs in July (payroll employment and real personal income less transfer payments), while the other two have stalled in recent months at their record highs (real manufacturing & trade sales and industrial production). The yearly percent change in the CEI also tends to be more highly correlated with the growth rate of real GDP goods than real GDP services (Fig. 9 and Fig. 10). Nevertheless, it is still making new highs and not peaking as it always does when a recession is starting.
(3) LAGEI. The LAGEI is the Rodney Dangerfield of the composite cyclical indicators. It gets no respect. It’s rarely mentioned. That’s because it tends to peak at the end of recessions and trough well after they end (Fig. 11). Oddly, it seems to be peaking in recent months, suggesting that the no-show recession is almost over! Perhaps, it is signaling that our rolling recession is over and that a rolling recovery is underway.
It’s also interesting to monitor the seven components of the LAGEI (Fig. 12). Like the Seven Dwarfs, some are sleepy, some are grumpy, while others are happy. We often hear that record consumer installment credit may force consumers to retrench, causing a recession. The ratio of consumer installment credit to personal income is actually a lagging indicator, not a leading or coincident one. So are the six-month percent change in the CPI for services and—perhaps surprisingly to some—inflation-adjusted commercial & industrial loans.
US Economy II: Inflation Is Really Moderating. So the six-month percent change in the CPI services inflation rate is an official component of the LAGEI. That shouldn’t be a surprise since rent accounts for 53.7% of the CPI services index. We all know by now that the inflation rate of tenant rents on new leases has been dropping much faster than the CPI rent index (Fig. 13).
Also not surprising is that the CPI goods inflation rate tends to lead the CPI services inflation rate (Fig. 14). This time shouldn’t be different. The CPI goods inflation rate peaked at 14.2% y/y during March of last year and plunged to -0.6% during July. The CPI services inflation rate peaked at 7.6% during the first two months of this year and was down to just 5.7% during July of this year.
As we noted recently, the headline and core CPI excluding shelter inflation rates were down to only 1.0% and 2.5% during July (Fig. 15). Debbie calculates that the headline and core PCED excluding rent inflation rates were 2.2% and 3.4% in June (Fig. 16).
Strategy: Q2 Earnings Season Nearing Finish Line. With just a handful of companies left to release Q2 results, Joe reports that S&P and I/B/E/S have compiled Q2’s near-final data for S&P 500 earnings per share. We’re still awaiting S&P’s final figures for revenues and the profit margin, which we’ll analyze after they’re released in the next week or so.
While we track both S&P and I/B/E/S’ numbers for quarterly operating earnings, we generally focus on the I/B/E/S data, especially because we use its measure of forward earnings (i.e., the time-weighted average of analysts’ consensus estimates for the current year and following one). Forward earnings is important to our stock market forecast, because stock investors discount majority-rule industry analysts’ operating earnings forecasts over the coming 12 months.
For now, let’s focus on the bottom-line numbers for Q2:
(1) S&P 500 Q1 earnings. S&P 500 operating EPS was $54.20 during Q2 according to I/B/E/S, a 2.1% q/q improvement from $53.08 during Q1-2023 but still down 5.9% y/y from its record EPS a year earlier during Q2-2022. The y/y earnings growth rate slowed for an eighth straight quarter and was negative for a third straight quarter, after having edged down 3.1% y/y during Q1-2023 (Fig. 17 and Fig. 18). While Q2-2023’s y/y decline was the largest since Q3-2020, we think it marks the worst comps of the cycle and should improve beginning in Q3-2023.
According to S&P, their measure of operating EPS was $54.81 during Q2, up 16.9% y/y and positive for a second straight quarter following four quarters of decline. S&P’s version of operating EPS remains 3.4% below its record high of $56.73 during Q4-2021. Regardless of which measure investors look at, the peak-to-trough declines in operating EPS thus far have been relatively modest compared to those of past downturns. (Keep reading to see why the S&P and I/B/E/S growth rates are so different.)
(2) S&P, I/B/E/S & write-offs. S&P and I/B/E/S each have their own polling services and derive their estimates and actuals on a different basis. S&P adheres to a stricter in-house definition of operating earnings, while I/B/E/S follows a consensus “majority rule” when deciding how to present a company’s consensus forecast. The industry analysts polled by I/B/E/S typically follow companies on an adjusted earnings basis (i.e., EBBS or “earnings excluding bad stuff,” a.k.a. write-offs), which makes their estimates higher than S&P’s earnings series. Since Q1-1993, the two series of quarterly operating EPS actuals have diverged by an average of 5.2%.
During Q2, I/B/E/S’ operating EPS actual figure of $54.20 was just 1.1% lower than S&P’s $54.81, which ranks among the smallest divergences between the two actuals in the past 30 years. That divergence has declined each quarter since Q2-2022 when it peaked at a nine-quarter high of 23.6%. We weren’t concerned at the time because the large divergence was due to an unusually large mark-to-market accounting loss that reduced Berkshire Hathaway’s earnings significantly.
(3) S&P 500 sectors’ Q2 growth: The I/B/E/S data show that six of the 11 S&P 500 sectors recorded positive y/y earnings growth in Q2, up from five in Q1-2023. Among the strongest sectors, Consumer Staples rose y/y for a 12th straight quarter, and Industrials was up for a ninth quarter. Rising on a y/y basis for the first time in five quarters were the Communication Services, Information Technology, and Utilities sectors. Among the laggards, Energy declined y/y for the first time in 10 quarters; Health Care fell by a record amount; and Materials was down for a fourth straight quarter (Fig. 19).
Here’s how the S&P 500 sectors’ y/y earnings growth rates stacked up in Q2-2023: Consumer Discretionary (49.5%), Communication Services (17.6), Industrials (13.0), Consumer Staples (6.0), Information Technology (1.8), Utilities (0.5), Financials (-1.8), S&P 500 (-5.9), Real Estate (-9.8), Materials (-23.3), Health Care (-27.1), and Energy (-48.0).
(4) Q3-2023 estimate revisions. We’re very encouraged by the recent estimate revisions trend. With six weeks to go before companies close their Q3 books, analysts’ consensus S&P 500 Q3 earnings forecast is down just 0.2% since the quarter began—the slowest rate of decline since Q4-2021. It’s markedly less than the 2.2% decline of the Q1-2023 estimate at a similar point in that quarter’s reporting season as well as the average 4.0% decline of all quarters since 1994.
Among the 11 S&P 500 sectors, Q3 EPS estimates have risen since the quarter started for four: Communication Services, Consumer Discretionary, Financials, and Information Technology. Energy, Materials, and Utilities have registered the biggest declines, while the remaining sectors are down marginally (Fig. 20). The relatively modest declines in the S&P 500’s EPS estimate suggest that the table is being set for yet another strong earnings surprise in Q3-2023. That’s likely to mean more upward estimate revisions for future period forecasts in a repeat of the pattern that occurred during the Q1- and Q2-2023 earnings seasons.
(5) Q3 growth forecasts. Analysts currently expect seven of the 11 S&P 500 sectors to record positive y/y growth in Q3-2023. S&P 500 earnings are expected to edge down 0.5% y/y on a frozen-actual basis as the index recovers from its worst y/y comparison so far in this cycle. On a proforma same-company basis, which is provided by Refinitiv’s research department, S&P 500 earnings growth is expected to rise 1.3% y/y for the S&P 500.
Here are the readings of the analysts’ latest proforma y/y Q3-2023 earnings growth rate estimates for the 11 sectors of the S&P 500 versus their preliminary growth rates for Q2-2023 as of the week of August 18: Communication Services (34.6% in Q3-2023 versus 16.0% in Q2-2023), Consumer Discretionary (21.6, 53.6), Financials (15.2, 9.9), Industrials (13.5, 15.7), Utilities (12.1, 0.6), S&P 500 ex-Energy (6.9, 3.0), Consumer Staples (3.5, 8.7), Information Technology (2.5, 2.6), S&P 500 (1.3, -3.4), Real Estate (-6.7, -2.2), Health Care (-10.1, -26.7), Materials (-19.5, -26.4), and Energy (-39.8, -47.7).
Bond Yields Returning To Normal
August 22 (Tuesday)
Check out the accompanying pdf and chart collection.
Executive Summary: My bond market outlook over the past 40 years was misrepresented in a Bloomberg story on Friday. To set the record straight, I was bullish on bonds from 1983-2021, not regularly predicting a return of the Bond Vigilantes as reported. … But they are back now, driving up the 10-year Treasury bond yield on concerns about the mounting federal deficit. The Bond Vigilantes still care about inflation (which is moderating), but they also care more about supply and demand than in the past, with the federal government straining both (via fiscal spending and QT). … What’s next? We think the Treasury bond yield is returning to normal around 4.50%-4.75% as the economy returns to its Old Normal.
Weekly Webcast. If you missed Monday’s live webcast, you can view a replay here.
Bonds I: Bloomberg on the Bond Vigilantes & Me. I am rarely misquoted or taken out of context by my friends in the financial press. However, I recently was compared to the boy who cried “Wolf!” in an August 18 Bloomberg article titled “Yardeni, Economist Who Cried ‘Bond Vigilantes,’ Spots Them Again.”
I would like to set the record straight with the help of three articles about me and the Bond Vigilantes previously posted on Bloomberg and actually referenced in the latest one. The latest article states: “Edward Yardeni, the economist who coined the term ‘bond vigilantes’ during the 1980s and has regularly predicted their return to the investment landscape ever since, said they’re ‘saddling up.’”
I did not regularly predict their return. I did coin the term “Bond Vigilantes” in 1983. I was consistently bullish on bonds from then through 2021. I was among the first disinflationists at the start of the 1980s. I changed my mind about bonds along with everyone else in early 2022 when inflation reared its ugly head. Yet the Bloomberg story implies that I was mostly bearish that whole time since the early 1980s, presumably because I saw Bond Vigilantes around every corner.
For the record, I did see them three times during the 1980s, when yields rose and effectively slowed nominal GDP growth. In the early 1990s, I observed that the Clinton administration maintained fiscal discipline largely because they feared the Bond Vigilantes. Inflation remained subdued during the second half of the 1990s through 2021, and I remained mostly bullish on bonds. I didn’t cry ”Wolf!”
Now let’s go to the Bloomberg stories, referenced in the article, that got it right:
(1) Bond Vigilantes Are ‘Baaaack!’, Says Economist Who Coined Term (September 27, 2022). “In a note titled ‘The Bond Vigilantes: They’re Baaaack!’ Ed Yardeni said the huge amount of monetary and fiscal stimulus released during the pandemic has unleashed forces that haven’t been seen for decades, forcing central banks to respond with the massive policy tightening seen this year. ‘Once the central banks were forced to stop their Great Financial Repression, the bond vigilantes were set loose,’ wrote Yardeni … His comments came as the worst bond selloff in decades is seeing few signs of ending.”
(2) Yardeni Says Bond Vigilantes May Return After Virus Crisis Fades (March 18, 2020). “The market veteran credited with coining the term ‘bond vigilantes’ says there’s a chance they could make a return in the aftermath of the coronavirus, after being largely absent for decades. Government debt in most developed nations has seen a powerful rally the past two months as the deadly epidemic throttled economic growth. But once the outbreak finally subsides, they might start tumbling when investors consider the tremendous amount of stimulus enacted by policy makers, says Ed Yardeni, president and chief investment strategist of Yardeni Research Inc. ‘After we get through this GVC [Great Virus Crisis], we may very well have an inflation scare where the bond vigilantes might very well be able to push bond yields higher,’ Yardeni said in an interview.”
The story also quotes me as saying, “I haven’t seen them [i.e., the Bond Vigilantes] for quite some time.” As noted in the story, I said that the last time I saw them was during the Greek debt crisis in 2010. Furthermore, according to the article: “In the end, they may return ‘because even the central banks will recognize that they need to at least try to do some normalization of monetary policy to head off inflationary consequences of all the stimulus provided,’ he said.”
(3) Bond Vigilantes Lie In Wait for Trump’s Debt-Swelling Tax Plan (April 27, 2017). I was quoted in this article with a title suggesting that it might have represented my view, since I am widely associated with the Wild Bunch. Here was what I said in the story: “Bond vigilantes are now clearly showing no signs of vigilantism.” I explained: “‘The bond vigilantes get much more excited about inflation than they do about the supply of government securities,’ Yardeni said. ‘We are trained that market prices are dictated by supply and demand, so having bigger and bigger deficits should matter. It does matter to bond vigilantes, but much more weight seems to be given to inflation.’” I added that since the 2008 financial crisis, “‘the bond vigilantes have been pretty quiet.’”
Just for the record: “The Bond Vigilantes,” an excerpt from my 2018 book Predicting the Markets, is posted on our website.
Bonds II: What Is Normal? So now what? Where do we go from here? Since 1983, I have been keeping track of the Bond Vigilantes, and not regularly ringing the alarm bell about their return. I viewed them as a disinflationary force that was bullish for bonds. They’ve undoubtedly returned recently, as the 10-year Treasury bond yield—which had dropped from 4.25% on October 24 to 3.30% on April 6—rebounded to 4.34% yesterday on mounting concerns about mounting federal deficits, as Melissa and I discussed in yesterday’s Morning Briefing.
The question we need to answer is whether bond yields can fall if inflation continues to moderate, as we expect, while the federal deficit widens even though the economy is growing? As I observed in the April 27, 2017 Bloomberg article cited above, supply and demand for bonds mattered to the level of bond yields in the past, but not as much as inflation mattered. Now the former may matter at least as much as inflation given the unprecedented profligate fiscal excesses occurring since the pandemic.
Of course, if we are wrong about inflation—either because it stops moderating or it starts moving up again—we all know that bond yields are going higher. But if inflation does moderate, can bonds rally or at least stabilize at current levels despite the large supply of Treasuries while the Fed is tapering its holdings of Treasuries? Now that the Fed and other central banks have been forced to normalize their monetary policies, what should the normal bond yield be under the circumstances?
Consider the following:
(1) The Bond Vigilante Model relates the bond yield to the growth rate in nominal GDP, which reflects inflation as well as the growth rate of real GDP. This model shows that since 1953, the yield has fluctuated around the growth rate of nominal GDP (Fig. 1). However, both the bond yield and nominal GDP growth tend to be volatile. While they usually are in the same ballpark, they rarely coincide. When their trajectories diverge, the model forces us to explain why this is happening.
During Q2, nominal GDP was up 6.3% y/y, which was down from a peak of 17.4% y/y during Q2-2021. It seems to be converging with the 10-year Treasury bond yield, which rose from a record low of 0.52% during August 2020 to 4.34% on Monday. Nominal GDP growth should continue to moderate along with inflation.
The GDP deflator (GDP-D) peaked at 7.6% y/y during Q2-2022 (Fig. 2). It was down to 3.6% during Q2-2023. It has converged with the bond yield. However, in the past, the bond yield almost always has exceeded the GDP-D inflation rate (Fig. 3). But there is no constant or even consistent value for this measure of the real bond yield. Our forecast is that the deflator is heading toward 2.0%-2.5% by 2025. If the real bond yield rises from zero during Q2-2023 to 1.50%-2.50% (where it was just before the pandemic), the nominal yield would be 3.50%-5.00%. Admittedly, that’s a wide range, but it would be a return to normal compared to the period from the GFC through the GVC.
(2) The TIPS Model defines the nominal 10-year Treasury bond yield as equaling the 10-year TIPS yield plus an expected inflation proxy, i.e., the nominal yield minus the comparable TIPS yield (Fig. 4 and Fig. 5).
The recent rebound in the nominal yield has been driven by the rebound in the TIPS yield from a low of 1.06% on April 6 to 2.00% yesterday. The latter seems to be normalizing back around 2.00%, which is where it was during 2003-06, the years just before the Great Financial Crisis (GFC) of 2008 set the stage for the TIPS yield to fluctuate around 1.00% to -1.00% from 2010-22.
The history of the 10-year expected inflation proxy shows that it mostly has hovered around 2.50% since 2003 except for during the recessions associated with the GFC and the GVC, along with the mid-cycle slowdown of 2015-16. During those three periods of economic weakness, the TIPS yield fell below 1.50%.
This model suggests that during normal times, the 10-year nominal bond yield should be around 4.50%.
(3) The Yield Curve Model is based on investors’ expectations of how monetary policy will respond to inflation and impact the business cycle. In the past, inverted yield curves signaled that the 10-year Treasury bond yield was getting close to peaking (Fig. 6 and Fig. 7). That’s because inverted yield curves typically imply that bond investors believe that if the Fed continues to raise short-term interest rates, something in the financial system will break, triggering an economy-wide credit crunch and a recession.
This time, the inverted yield curve correctly anticipated the banking crisis that occurred during March. But there has been no credit crunch because the Fed responded quickly with an emergency lending facility for the banks. So there has been no recession attributable to a credit crunch. The bond yield has been rising since April as investors became increasingly impressed with the resilience of the economy.
As a result, the inverted yield curve is disinverting, with the bond yield rising toward the 2-year Treasury note yield (Fig. 8). We think that the yield curve is normalizing as the economy returns to its Old Normal, leaving behind the New Abnormal that spanned from the GFC through the GVC periods. In the past, the yield curve disinverted, with the 2-year yield falling faster than the 10-year yield, during recessions and early recovery periods.
In our opinion, what we are seeing now is the bond yield returning to its normal pre-GFC range of 4.50%-4.75%.
No Hard Feelings
August 21 (Monday)
Check out the accompanying pdf and chart collection.
Executive Summary: Is the strength of the economy a double-edged sword that means higher-for-longer inflation, further monetary tightening, and a recession? Or will the tightening that’s already occurred fell the economy still? Or is the mounting federal budget deficit the economy’s Achilles’ Heel? While we remain in the light-side camp, we do share the deficit concerns of dark-side prognosticators: Profligate government spending combined with falling revenues as a percent of GDP points to nowhere good. The bond market is concerned too. Fed Chairman Powell will have a chance to calm the bond market at Jackson Hole on Friday. Much depends on whether he does. … And: Dr. Ed reviews “Breaking” (+ +).
YRI Weekly Webcast. Join Dr. Ed’s live webcast with Q&A on Mondays at 11 a.m. EST. You will receive an email with the link one hour before showtime. Replays of the weekly webcasts are available here.
US Economy I: The Great Debate Continues. To our pessimistic friends on the dark side of the Great Debate over the economic outlook, we say: “Keep up your thought-provoking work! We are constantly challenged by your insights as we continue to be your sparring partners on the lighter side of the debate.”
Let’s review the honorable opposition’s latest debating points before we focus on the federal budget deficit issue, which does concern us:
(1) Jeremy Grantham. In an August 18 interview on Bloomberg Wealth with David Rubenstein, Jeremy Grantham of GMO doubled down on his grim outlook for the economy. He is betting with near certitude that the Fed will fail to avoid a recession: “They have never called a recession, and particularly not the ones following the great bubbles.” As higher rates continue to depress other corners of the market, particularly real estate, the US economy will see “a recession running perhaps deep into next year and an accompanying decline in stock prices.” Grantham thinks that inflation will “never be as [low as] its average for the last 10 years.” So interest rates will remain higher, which will “push asset prices down.”
(2) David Rosenberg. In an August 17 post on X (a.k.a. Twitter), David Rosenberg of Rosenberg Research predicted that equites are “heading into a new bear phase.” He noted that “rule number eight” by Wall Street veteran Bob Farrell states that bear markets have three stages, namely, sharp down, reflexive rebound, and drawn-out fundamental downtrend. The same day that he posted his tweet, he told BNN Bloomberg in a TV interview: “The recession has been delayed; it’s not derailed.” Rosenberg said that on average recessions start two years after the first Fed rate hike. He warned that a “huge default cycle” is coming. He added, “We’re not getting out of this without a recession.”
(3) Mike Wilson. In an interview posted on August 8 by Fortune, Mike Wilson of Morgan Stanley warned that “excessive” government spending could be fueling a “boom-bust” scenario in the stock market.
(4) Marko Kolanovic. On August 2, Yahoo! Finance reported that Marko Kolanovic of JPMorgan wrote the following in a note to investors: “While the economy’s recent resilience may delay the onset of a recession, we believe that most of the lagged effects of the past year’s monetary tightening have yet to be felt, and ultimately a recession will likely be necessary to return inflation to target.”
(5) Ray Dalio. At a June 7 Bloomberg conference, Ray Dalio of Bridgewater Associates warned that the US is facing a debt crisis and a looming balance-sheet recession. One of his concerns is that there may not be enough buyers for the deluge of securities that the Treasury must issue to finance the rapidly widening deficit. “In my opinion, we are at the beginning of a very classic late, big-cycle debt crisis when you are producing too much debt and have also a shortage of buyers,” Dalio said. He argued that interest rates are likely to stay high for some time, which will weigh down the economy.
(6) Bottom line. At the beginning of the year, the bears warned that a recession was imminent. Instead, real GDP rose 2.0% (saar) during Q1 and 2.4% during Q2. The Atlanta Fed’s GDPNow model is tracking real GDP growth at 5.8% during Q3. The estimate has consistently been rising since July 27, when it was 2.0%.
Now some of the economy’s naysayers are saying that the strength of the economy means that inflation will stay higher for longer, forcing the Fed to continue hiking the federal funds rate until a recession occurs, maybe early next year. Others in the bearish camp are saying that the Fed’s tightening of monetary policy since early last year will cause a recession even if the Fed doesn’t raise rates because the long and variable lags of monetary policy will soon hit the economy hard.
The gloomiest pessimists expect that the mounting federal deficits can be financed only at higher interest rates, which will cause a debt crisis and a recession. The doomsday version of this scenario is that the net interest outlays of the federal government will compound at a pace that is simply unsustainable, with lots of dire consequences.
We are counting on continued moderation in the inflation rate and lower interest rates next year to prevent these dire predictions from playing out. Nevertheless, let’s have a closer look at the federal deficit issue, which is the one that troubles us the most.
US Economy II: Federal Budget Deficit Matters. The hard-landers are highly regarded strategists with some great calls behind them. They’ve been wrong so far about a recession arriving in 2022 and 2023, but they could still be right about one coming before year-end 2024. In particular, Debbie and I share their concerns about the mounting federal budget deficit, which has been exacerbated by mounting federal outlays led by soaring net interest outlays.
In the past, we didn’t care as much about the federal budget deficit because it tended to widen during recessions and narrow during economic expansions relative to nominal GDP (Fig. 1). That’s because during recessions (expansions), outlays rose (fell) relative to GDP, while tax receipts declined (increased) relative to GDP (Fig. 2). This time, the government’s outlays are increasing while its revenues are decreasing relative to rising GDP as the economy expands.
In the past, bond investors were much more focused on inflation and the Fed’s policy response to it rather than on the supply of Treasuries. That’s because inflation tended to moderate during recessions and economic recoveries (as productivity rebounded) (Fig. 3). So a widening deficit didn’t matter much. That’s why in the past, we didn’t care that much about the federal budget deficit—because the bond market didn’t care that much.
The Fitch Ratings downgrade of US federal government debt from AAA to AA+ on August 1 reminded us all that fiscal policy has turned increasingly profligate since the pandemic. As Clinton administration adviser Rahm Emanuel famously said: “You never let a serious crisis go to waste. And what I mean by that it's an opportunity to do things you think you could not do before.” That’s always been Washington’s modus operandi, but never more so than since the pandemic.
Arguably, the first round of pandemic relief checks distributed by the Treasury during the spring of 2020 worked remarkably well to stabilize the economy that year. But the second round in late 2020 and the third round during the spring of 2021 set the stage for a significant surge in inflation. Here is a summary of the three rounds of checks and subsequent fiscal extravaganzas:
Round 1 (March 2020): $401.5 billion sent in 167.6 million payments.
Round 2 (December 2020): $141.5 billion sent in 146.5 million payments.
Round 3 (March 2021): $271.4 billion sent in 161.9 million payments.
American Rescue Plan (March 2021): This act authorized the third round of relief checks, with a total price tag of $1.9 trillion.
Infrastructure Investment and Jobs Act (November 2021): The Biden administration’s second legislative victory came in November. This act provided $1.2 trillion to fund physical infrastructure projects such as roads, bridges, water pipes, and broadband internet.
CHIPS and Science Act (July 2022): This act included more than $50 billion for incentivizing the expansion of the semiconductor manufacturing industry in the US. It also increased funding for the Advanced Manufacturing Investment Tax Credit by nearly $25 billion and provided nearly $5 billion for research and innovation.
Inflation Reduction Act (August 2022): This act included nearly $370 billion for clean energy and climate programs.
The Congressional Budget office (CBO) issued a July 20 report that assessed the long-term budget outlook and included the following grim summary: “If current laws governing taxes and spending generally remained unchanged, the federal budget deficit would nearly double in relation to gross domestic product (GDP) over the next 30 years, driving up federal debt, the Congressional Budget Office projects. In CBO’s extended baseline projections, debt held by the public rises from 98 percent of GDP in 2023 to 181 percent of GDP in 2053—exceeding any previously recorded level and on track to increase further. Those projections are not predictions of budgetary outcomes; rather, they give lawmakers a point of comparison from which to measure the effects of policy options or proposed legislation.”
In other words, the Fitch downgrade was justified by the CBO’s projections.
The Fed: Will Powell Calm the Bond Vigilantes? It’s hard to put lipstick on this pig. Our relatively sanguine outlook since last year has been predicated on inflation coming down this year, which it has. As a result, we concluded that the 10-year Treasury yield probably peaked at 4.25% on October 24 and that the Fed would soon stop raising the federal funds rate.
The bond yield bottomed this year at 3.30% on April 6. But here it is, back to 4.25% on Friday, led higher by the 10-year TIPS yield’s rise to 1.94%, little changed from Thursday’s 1.97%, which was the highest since July 6, 2009 (Fig. 4). The yield rebounded from its low as the hard-landers were forced to concede that the economy was more resilient than they expected. The yield rose above 4.00% following the Fitch downgrade on August 1. The July FOMC minutes released on August 16 showed that the committee might continue to raise the federal funds rate if inflation doesn’t continue to moderate.
Melissa and I expect that Fed Chair Jerome Powell will try to calm the bond market with his speech on Friday at the Fed’s annual Jackson Hole conference. We think he will agree with the views expressed by New York Federal Reserve Bank President John Williams earlier this month—basically that monetary policy is restrictive enough as it is to bring down inflation. Powell will likely acknowledge that inflation has been moderating and say that if it continues to do so, the Fed may have to lower the federal funds rate next year to stop real interest rates from tightening credit conditions further.
If he doesn’t do so (or succeed in doing so), the yield curve will continue to disinvert, with the 10-year yield rising toward the 2-year yield (Fig. 5 and Fig. 6). In that scenario, the rating agencies, anticipating more loan defaults, would subject the banking sector to another round of credit-rating downgrades, especially in the commercial real estate sector.
The odds of a recession occurring before the end of next year would increase in that scenario. That would be unfortunate indeed since inflation is likely to continue to moderate without requiring a recession to do so. We currently are still assigning 85% odds to a no-landing scenario through the end of next year and 15% to a hard-landing one. However, we are leaning toward lowering the former and raising the latter.
Powell’s speech will matter a great deal to what happens next.
Movie. “Breaking” (+ +) (link) is based on the 2017 real-life story of the late Brian Brown-Easley, a decorated Marine Corps veteran who walked into a Wells Fargo bank and claimed to have a bomb in his backpack. He didn’t want to rob the bank. Rather, he wanted the regional office of the Department of Veterans Affairs (VA) to give him his benefits check for $892. The VA used the money to reduce the balance on his outstanding student loan instead. It’s a very sad story, suggesting that we need to do much more to help our veterans after they’ve bravely served our country.
China, Consumers & Alzheimer’s Breakthroughs
August 17 (Thursday)
Check out the accompanying pdf and chart collection.
Executive Summary: China’s property development companies are going bankrupt left and right, with real estate prices tanking and monthly residential property sales their slowest in a decade. What China needs is a US-style restructuring of its real estate market. Jackie surveys the past week’s wreckage. … Also: Consumers these days! They know what they want: Amazon products, Teslas, newly built homes, and travel. Related stocks did the heavy lifting to hoist the S&P 500 Consumer Discretionary stock price index 32% ytd. … And: Can Baby Boomers forget about getting Alzheimer’s? Maybe someday if some of the many ongoing R&D efforts targeting its eradication succeed.
China: The Real Estate Morass Deepens. It’s been almost two years since China Evergrande Group, once China’s largest real estate developer, shocked the financial markets by defaulting on $340 billion in debt. Since then, the Chinese real estate market has been in a serious slump.
Developers in China sold 60.3 million square feet of residential property in July—the least in any given month since 2012, an August 15 WSJ article reported. Real estate prices are falling, most recently by 0.2% m/m in July. Investment in real estate fell 8.5% y/y during the first seven months of this year. And over the past few years, more than 70 real estate developers have gone bankrupt, according to KPMG’s count. Two more names may join the illustrious list: Real estate developers Country Garden and Sino-Ocean Group Holding have missed payments on billions of dollars of debt.
Were that not enough, Zhongrong International Trust and its major investor Zhongzhi Enterprise Group stopped making payments on some trust investments they sold to investors. Add July’s dour economic reports to the equation, and it’s clear why the People’s Bank of China (PBOC) cut interest rates on Tuesday. The central bank’s move failed to staunch the slide in Chinese stocks or currency. The country needs a good US-style restructuring of its real estate market, where apartment prices are slashed, debt is restructured, and new equity investors are brought in as grave-dancers.
Until then, we’re left watching the wreckage unfold. Let’s take a look at some of this week’s major events in the Chinese real estate market:
(1) Debt payments missed. Once China’s largest real estate developer by sales, Country Garden sold more than a half a trillion renminbi (RMB) of real estate annually from 2018 to 2021. However, its sales have slid sharply in the past two years. In July, sales declined for the fourth month in a row to just 12.1 billion RMB, down from 30.1 billion RMB in July 2022 and 54.3 billion RMB in July 2021, an August 10 FT article reported. Chinese developers depend on cash deposits collected when an apartment is purchased to fund operations. As sales have slumped, so too have developers’ cash flows.
Last week, Country Garden missed $22.5 million of payments on two international bonds. The company—which expects to report a net loss of 45 billion to 55 billion yuan in 1H-2023—owes almost $200 billion of debt and has 35 billion yuan of bonds maturing through January, reported an August 14 South China Morning Post (SCMP) article. If the company doesn’t make the interest payment within 30 days of the skipped payment, it will be in default.
State-controlled Sino Ocean also recently ran into a wall. It suspended trading of its 6% guaranteed notes due in 2024 after missing a $20.9 million interest payment. China’s 25th largest real estate developer has conducted a consent solicitation of bond investors, securing an extraordinary resolution to defer its interest payments. But ultimately, default seems probable because the company has $1.6 billion of bond debt due by year-end and only $811 million of cash or equivalents, according to its annual report. Almost 30% of Sino-Ocean’s shares are owned by China’s finance ministry.
(2) Ripple effects hits financial companies. There’s growing concern that Chinese real estate debt defaults increasingly could impact the financial sector, including trust companies that loan to and invest in real estate developments in addition to stocks, bonds, and commodities. Zhongrong International Trust has delayed payment on some of its maturing wealth products, an August 13 SCMP article reported. It had bought stakes in at least 10 real estate projects last year, hoping that unfinished homes would sell and pay off some of the projects’ $230 billion in property-backed debt.
The news comes amid rumors that Zhongzhi Enterprise Group, a major shareholder in Zhongrong, was experiencing its own liquidity crisis. Zhongzhi has about 1 trillion yuan ($138 billion) of assets under management. Zhongzhi owns many different businesses, including Datang Wealth, which also has missed payments on a wealth product, an August 14 FT article reported.
Zhongzhi’s wealth arms have delayed payments to “more than 150,000 clients with outstanding investments totaling 230 billion yuan,” an August 14 Bloomberg article reported.
Concern about trust companies and other Chinese shadow banks’ exposure to the real estate market is growing. The shadow banking industry totals about $3 trillion, and JPMorgan estimates that its rising trust defaults could drag down the country’s y/y GDP growth by 0.3-0.4ppts, an August 14 Reuters article reported. “Chinese authorities [are studying] possible contagion with the banking regulator examining risks at Zhongzhi,” according to the August 14 Bloomberg article.
(3) Government responds a bit. China’s central bank responded to this and other disappointing economic data discussed in yesterday’s Morning Briefing by cutting interest rates. The PBOC lowered the interest rate on one-year loans to banks to 2.50% from 2.65%, while adding $55.2 billion of new loans into the banking system. This isn’t likely to be the last thing the government must do to steady its economic ship.
The MSCI China share price index fell by 0.9% (in local currency) on Tuesday despite the PBOC’s moves. The country’s stock price index is down 4.6% ytd through Tuesday’s close, compared to a 15.9% increase in the US MSCI index (Fig. 1). China’s yuan also has been under pressure, falling to 7.29 relative to the dollar on Tuesday. It’s down 4.7% ytd (Fig. 2).
Consumer Discretionary: An Unusual Year. The S&P 500 Consumer Discretionary sector may be up 31.8% ytd through Tuesday’s close, but that does not translate into a booming traditional retail environment for clothes and home goods. Instead, it’s a reflection of the amazing performance this year of Amazon, Tesla, homebuilders, and the travel industry.
Excluding just Amazon and Tesla drops the Consumer Discretionary sector’s ytd performance to 7.5%. Tesla’s 89.1% gain through Tuesday’s close helped the S&P 500 Automobile Manufacturing industry’s stock price index jump 69.7% ytd (Fig. 3). Likewise, Amazon’s 63.9% ytd gained helped the stock price index of its industry, Broadline Retail, soar 60.3% ytd (Fig. 4). The Consumer Discretionary sector was also boosted by the 45.7% surge in the Homebuilding industry’s stock price index (Fig. 5). Meanwhile, the post-pandemic travel surge has benefitted the stock price indexes of the Hotels, Resorts & Cruise Lines industry, up 49.7% ytd, and the Casinos & Gaming industry, up 21.7% (Fig. 6).
Compare those numbers to the sluggish ytd performances of the S&P 500’s more traditional retail categories’ stock price indexes: General Apparel Retail (4.9%) and Other Specialty Stores (-3.5). The Consumer Staples Merchandise Retail industry—which is in the Consumer Staples sector—includes Walmart, Target, and the dollar stores. Its stock price index has risen 8.9% ytd but still trails the S&P 500’s 15.6% ytd return.
So which accurately reflects the health of the prototypical consumer—the one spending on services by jetting off to Europe or the one keeping his or her wallet shut and spurning the latest fashion trend? It’s hard to tell by the Q2 earnings reports of Target and TJX released yesterday. Same-store sales fell 5.4% y/y for Target but rose 6.0% y/y for TJX.
Let’s take a look at what the retailers reporting last quarter’s earnings had to say:
(1) Missing the target. Target’s results were dented after the retailer found itself at the center of the culture wars for offending some customers with the Pride merchandise it displayed. Target CEO Brian Cornell noted in Wednesday’s earnings conference call that inflation continues to push consumers to purchase more staples and fewer discretionary items, and the preference to spend on services instead of consumables continues. And he added: “[T]he rollback of government efforts to support consumers during the pandemic, including stimulus payments, enhanced childcare tax credits, and the suspension of student loan payments, presents an ongoing headwind…”
That said, the company has reduced its inventory by 17% y/y, ending the need to run unexpected sales and allowing margins to rebound from last year. Nonetheless, management expects Target’s same-store sales will decline for the remainder of the year, and it reduced its fiscal 2024 (ending January) earnings-per-share target to $7.00-$8.00 from $7.75-$8.75.
(2) Maxxinistas still shopping. TJX, which didn’t face a culture backlash, reported stronger-than-expected Q2 same-store sales, driven by an increase in customer transactions across all of its divisions, which include Marshall’s, TJ Maxx, and Home Goods. Consumers purchased less expensive items but made up for it by buying more items. Same-store sales are expected to slow during H2-2023 but remain positive, bringing management’s fiscal 2024 (ending January) same-store sales guidance to an increase of 3%-4%. Management increased its fiscal 2024 earnings-per-share guidance to $3.66-$3.72, up from the $3.49-$3.58 offered a quarter ago.
Disruptive Technologies: Med Tech Takes on Alzheimer’s. Advancements in medical technology are taking aim at Alzheimer’s. About 6.5 million Americans have Alzheimer’s, and scientists are harnessing stem cells, CRISPR, and immunotherapy to slow the disease’s progression and eventually find a cure.
Fortunately, there is a full pipeline of potential Alzheimer’s drugs in various stages of testing, according to a study cited by the Alzheimer’s Association. There are 187 Phase 1, 2, or 3 clinical trials assessing 141 treatments as of January 1, and 55 of the trials are in Phase 3. Just in time for the Baby Boomers’ old age!
Let’s take a look at some of the theories scientists are testing out:
(1) CRISPR to the rescue. Microglia are brain cells that protect the central nervous system from disease. Some believe that damaged microglia create the excessive beta-amyloid plaques associated with Alzheimer’s or inhibit the body’s ability to clear the plaques away. Beta-amyloid is a protein that accumulates in the brains of Alzheimer’s patients and creates a sticky plaque that interferes with neurons and prevents the transmission of information.
Until recently, scientists have been unable to remove damaged microglia cells to replace them with healthy cells. However, an FDA-approved cancer drug, pexidartinib, blocks a protein on microglia cells and kills them. The problem: The cancer drug will kill both the healthy, donated microglia cells as well as the damaged microglia cells.
Neuroscientists at the University of California, Irvine (UCI) and the University of Pennsylvania used CRISPR gene editing to solve the problem, a January 30 UCI press release announced. CRISPR created one amino acid mutation, known as “G795A,” which they introduced into microglia produced either from human stem cells or from a mouse microglial cell line. CRISPR-edited microglia injected into mice were resistant to the cancer drug. Meanwhile, the damaged microglia cells were killed off by the cancer drug. Next, scientists will study how to use the CRISPER-edited microglia to attack the plaques associated with Alzheimer’s.
(2) The power of stem cells. Scientists at the University of California San Diego are also focused on microglia cells. They’ve been evaluating whether stem cells that generate new, healthy microglia could slow the progression of Alzheimer’s.
Scientists transplanted healthy “wild-type hematopoietic stem and progenitor cells into Alzheimer’s mice and found that the transplanted cells did differentiate into microglia-like cells in the brain,” an August 11 article in SciTechDaily reported. They found that memory loss and neurocognitive impairment were “completely prevented” in mice receiving the transplant. The mice that received stem cells showed a “significant reduction” in beta-amyloid plaques and reduced microgliosis and neuroinflammation.
Next, the scientists plan to study how the transplanted cells produced such impressive improvements and whether transplants will work to stop the progression of—or perhaps even cure—Alzheimer’s in humans.
(3) Immunotherapy gets the nod. The Food and Drug Administration (FDA) gave accelerated approval in January to the first Alzheimer’s drug, Leqembi, developed by Eisai. Used in early stages of the disease, Leqembi has been shown to reduce the disease’s progression by 27% after 18 months; however, it is not a cure.
Leqembi is a monoclonal antibody, a protein made in the lab that acts like an antibody. It binds to the plaque and helps to remove it.
Eli Lilly’s donanemab is another monoclonal antibody, which in trials slowed the progression of Alzheimer’s by up to 35%. The earlier in the disease’s progression that it’s given, the greater the impact the drug has. The trial involved 1,743 early-stage patients who were given a monthly infusion of donanemab until all of their brains’ plaques were gone. After 76 weeks of treatment, the drug slowed clinical decline by 35.1%, a July 17 article in Independent reported. Lilly expects an FDA decision by year-end.
Patients must visit a clinic to receive Leqembi or donanemab via an intravenous drip, increasing the cost and difficulty involved with administering the drugs. Eli Lilly’s Remternetug is also an immunotherapy that targets beta-amyloids, but it’s delivered via an injection. Scientists hope that this more easily delivered drug will be more effective and have fewer side effects. Early results from ongoing trials are encouraging. “[A]fter 6 months of treatment 75% of 41 people tested had amyloid cleared from their brains. This is in contrast with donanemab which took 18 months to have 72% of patients cleared of amyloid,” reported a July 19 Alzheimer’s Society blog post.
Hard Landing In China, No Landing In US
August 16 (Wednesday)
Check out the accompanying pdf and chart collection.
Executive Summary: China’s economic pain has been the US’s economic gain, as it has lowered the prices Americans pay for goods from China, pulling US inflation lower. Today, we examine how China got into its economic morass and what policymakers there hope to do about it. … Also: With the US economy flying high and US retail sales in July up from June levels, might American consumers return China’s favor? It may be too soon to bet on a resumption of US consumers’ halted goods buying binge. … And: Joe pulls back the curtain on S&P 500 sector reclassification changes for an apples-to-apples look at technology companies’ changing market-cap representation in the index.
China’s Economy I: Desperately Seeking a New Engine. The Chinese are providing American consumers with cheaper goods. By doing so, the Chinese are increasing the purchasing power of American consumers, who are doing what they do best; they are shopping. It’s a gain for the US economy, which is getting better economic growth with lower inflation. It’s a loss for Chinese consumers, who are facing deflation and higher unemployment and dealing with the consequences of the bursting of their property bubble. China’s rapidly aging demographic profile is only exacerbating these problems.
The woes in the Chinese property market are weighing on consumer spending since many of the Chinese have significant portions of their personal assets in brand new empty apartments. They were worth owning when they appreciated in value, but now they have been losing value. The persistent drag in the property sector is impeding the sale of land by local governments, which is depressing their revenues and their spending on infrastructure as well as making it harder to service their debts.
Additionally, foreign demand for Chinese goods continues to be weak, posing a major impediment to fostering a sustainable economic recovery. Youth unemployment is at a record high. China is attempting a painful transition to a less debt-fueled, less property-centric, and less export-oriented economy. The problem is that it isn’t turning into a consumer-driven economy as government officials had hoped.
The Chinese government desperately has been seeking a new engine for growth without any success so far.
China’s Economy II: Lots of Woes. Jackie and I have been on top of this story for quite a while. In tomorrow’s Morning Briefing, she will provide an update of the mess in the property market. Today, let’s review the latest developments in this ongoing saga:
(1) Consumer spending and the CPI. Retail sales rose 2.5% y/y, down from a 3.1% increase in June, and missed analysts’ forecasts of 4.4% growth (Fig. 1). Real retail sales rose 2.8% as the CPI declined 0.3% y/y in July, falling for the first time in two years and sparking fears of deflation (Fig. 2). The underlying growth rate of real retail sales has plunged from more than 15% during the late 2000s to the low single digits now, reflecting the rapidly aging demographic profile of Chinese consumers (Fig. 3). China continues to be the world’s largest nursing home.
(2) Trade. Last week, the National Bureau of Statistics reported greater-than-expected declines in July exports and imports (Fig. 4). The former was down 9.3% y/y, while the latter was down 6.7% y/y. Imports has been virtually flat since mid-2021.
(3) Industrial production & the PPI. Industrial production rose 3.7% y/y in July, down from 4.4% in June and missing the consensus forecast of 4.6% (Fig. 5). It has been sliding downward along with real GDP growth since 2010. Chinese factories have been challenged by weak demand at home and less demand for exports overseas, as western consumers have been pulling back on spending and foreign producers have been moving their factories to friendlier countries in response to China’s increasingly anti-business regulations and hostile foreign policy.
Foreign direct investment in China in Q2-2023 was just $4.9 billion, according to data from China’s balance of payments, the lowest quarterly total in records starting in 1998.
(4) Unemployment. The urban unemployment rate rose in July, for the first time since February, to 5.3% from 5.2% in June. More troubling is that the urban unemployment rate for people aged 16 to 24 has ratcheted up steadily from month to month this year, hitting a record 21.3% in June—four times the overall jobless figure. Chinese officials announced on Tuesday that they will temporarily stop publishing the youth unemployment rate, claiming they need to refine how it’s calculated.
China’s universities churn out lots of graduates with skills that don’t match the needs of employers. Job opportunities have been reduced in several heavily regulated industries, including education, real estate, and technology.
(5) Property. Country Garden Holdings, one of China’s largest real-estate developers, missed payments on some of its bonds and warned that it expects to post a record loss for the first six months of the year as sales and profit slump. The property bubble is still bursting.
(6) Credit. Data released on Friday showed that Chinese banks lent far less than expected to households and businesses last month, highlighting weak demand for borrowing despite a succession of interest-rate cuts by the People’s Bank of China (PBOC). Chinese bank loans rose by just $5.1 billion during July, down sharply from June’s gain of $453.4 billion and the lowest since October 2006 (Fig. 6).
Household loans, mostly mortgages, fell by 200.7 billion yuan in July, after rising 963.9 billion yuan in June as the debt crisis in the property sector worsened, while corporate loans slid to 237.8 billion yuan last month from 2.28 trillion yuan in June.
(7) Policy. Earlier Tuesday, the Chinese central bank unexpectedly cut its key interest rate for the second time in three months to boost the economy. The August 15 WSJ reported: “The People’s Bank of China said Tuesday that it lowered the interest rate on a key facility that funnels one-year loans to banks to 2.5% from 2.65% previously, at the same time shoveling the equivalent of $55.2 billion of new loans into the banking system. Such a move is usually followed within days by a reduction in bank lending rates to households and businesses.”
US Economy I: China’s Gift to the US. The question is: Will American consumers save China from a bad recession? One of the reasons for China’s woes stems from the behavior of American consumers, after all: They embarked on a goods buying binge when the pandemic lockdowns were lifted in the spring of 2020. But that binge ended unexpectedly around year-end 2021 when US consumers pivoted to purchasing services as social distancing restrictions were lifted. Chinese exporters benefited greatly from the goods buying binge in the US. But they’ve been forced to lower their export prices to maintain their sales to Americans so far this year.
The US import price index fell 4.4% y/y and 1.3% y/y with and without petroleum (Fig. 7). Contributing to the decline was the US import price index from China, which was down 2.3% y/y through July (Fig. 8). China’s homegrown deflation in its PPI, which was down 4.4% y/y, is likely to continue to weigh on the US import price index from China (Fig. 9).
China’s recession and deflation are reducing the risks that the US must fall into a recession to bring down inflation!
US Economy II: Consumers Buying More Goods Again. In the US, the rolling recession that hit the goods market since mid-2021 seems to be morphing into a rolling recovery, as we’ve been predicting. Retail sales jumped 0.7% m/m during July. That same month, the headline CPI for goods fell 0.1% m/m. As a result, the Atlanta Fed’s GDPNow tracking model increased its latest forecast for Q3’s real GDP from 4.1% to 5.0%, led by an increase in real consumer spending from 3.2% to 4.4%.
Not only has there been no hard landing, but also the soft-landing scenario may be history. Until further notice, it’s looking more like a no-landing scenario, consistent with our rolling recovery thesis. However, the housing industry is likely to roll back into its recession given the recent jump in mortgage rates. The National Association of Home Builders (NAHB) Housing Market Index (HMI) fell 6 points from last month to 50, the index's first monthly decline in the past eight months. The commercial real estate market is certainly rolling into a recession, especially now that long-term interest rates have moved higher.
Before we get too excited about July’s retail sales report, let’s keep in mind the following:
(1) Housing-related retail sales remain weak (Fig. 10). Building materials are included in the residential investment component of GDP.
(2) Sales at nonstore retailers jumped 1.9% m/m during July because of Amazon’s Prime Day sale during the month (Fig. 11).
(3) Food services and drinking places reported a 1.4% collective increase in their sales during July (Fig. 12). In the GDP calculation, this industry is included in consumer services rather than consumer goods.
(4) On an inflation-adjusted basis, retail sales remains on its flat trend that started in mid-2021. It is still on a modest downward trend over this period excluding building materials and food services (Fig. 13 and Fig. 14).
Strategy: Tech’s Market-Cap Share. Since the introduction of the PC in the early 1980s, businesses have used and integrated computing technology into their operations to improve productivity and profitability. Back then, the first question of portfolio managers looking at investment candidates was: “What’s the dividend yield?” Now that question is: “Is it a tech company?” Then come questions about how the company leverages technology to business advantage—and looming in the back of minds: “Could this company become another Amazon?”
We strive to provide the data showing how much tech stocks influence the broader stock market’s performance. But now that new tech is being created and used everywhere, tracking how great a part of the stock market technology companies represent is no longer a simple exercise.
Using data since 1985, we have tracked each S&P 500 sector’s market-capitalization share of the S&P 500 index. For much of that time since, their capitalization shares have changed as portfolio managers invested funds based on the fundamental fortunes of the companies within each sector. However, there have been tracking complications along the way. Their capitalization share has also changed as constituents were added and removed from the index. This was especially true for the Information Technology sector, which saw many companies reclassified out of the sector in 2018 and again this year in March.
(1) Impact of past reclassifications on Tech’s market-cap share. Following the market’s close on September 21, 2018, Information Technology’s total market capitalization dropped 20.5% overnight as companies were reclassified to the newly renamed Communication Services and Consumer Discretionary sectors. Among them were several of today’s largest companies, Alphabet and Meta. As a result, Tech saw its market-cap share drop in September 2018 to 20.6% from 25.9%. Earlier this year, on March 17, S&P/MSCI removed the Data Processing & Outsourced Services sub-industry from the Information Technology sector and transferred the bulk of the companies to a new sub-industry in the Financials sector called “Transaction Processing & Payment Services.” The resulting 10.7% decline in Tech’s market capitalization caused the sector’s market-cap share to drop overnight to 25.9% from 29.0%.
(2) Tech’s current share looks peaky. During the August 3 week, Tech’s share of the S&P 500’s market cap was 27.9% (Fig. 15). Despite the GICS reductions in 2018 and 2023, that’s still the highest market-cap share of the S&P 500’s 11 economic sectors. But it isn’t even close to the record-high 34.2% during the June 23, 2000 week. Or is it? Had the reclassifications never happened, Joe’s analysis found, Tech’s market-cap share would be very different.
(3) Undoing reclassifications boosts Tech’s share to new record. Joe redid Information Technology’s current market capitalization to include the companies that were removed from the sector in 2018 and 2023 (Fig. 16). This adjustment of Tech’s market capitalization boosts the sector’s market-cap share to 35.3% as of the August 11 week, well above the 27.1% at which it stands with the reclassification.
Comparing Tech’s total market cap on an apples-to-apples basis with its historical record, that 35.3% share surpasses Tech’s prior record of 34.2% during the June 23, 2000 week. Tech’s adjusted market-cap share peaked during the July 14 week at a record-high 36.6%.
The 1970s All Over Again?
August 15 (Tuesday)
Check out the accompanying pdf and chart collection.
Executive Summary: The current alignment of economic forces—resulting in a growing economy with low unemployment, falling inflation, and stimulative fiscal policy balancing out restrictive monetary policy—seems too good to be sustainable. Is stagflation what comes next? … We doubt it. We don’t see inflation turning back up and economic growth slowing down as the decade progresses. We continue to place greater odds on “The Roaring 2020s” scenario (65% odds), a reboot of productivity driven growth à la the 1920s, than we do on “The Great Inflation 2.0” scenario (35%), a replay of the 1970s/early 1980s stagflation story.
Weekly Webcast. If you missed Monday’s live webcast, you can view a replay here.
Inflation: Twin Peaks? One of our many thought-provoking accounts sent us the following thought-provoking email message on Sunday: “Is it even possible to have an environment where the Fed is raising rates, fiscal policy is pedal to the metal, employment is totally full, and we get non-inflationary growth? Has it ever happened before? Isn’t it always at best stagflation?”
Here was my short response: “It hasn’t happened before, but it is what we have right now.” The following is my long answer.
Since March 2022, monetary policy has been restrictive, while fiscal policy has been stimulative. As a result, the rapid increase in interest rates since early last year hasn’t caused a recession so far. Indeed, the unemployment rate was 3.5% in July. Yet inflation has been moderating since last summer. The headline CPI peaked at 9.1% y/y last year during June (Fig. 1). The headline CPI with and without shelter were down to 3.2% and 2.0% last month. The core CPI with and without shelter peaked at 6.6% and 7.6% last year, falling to only 4.7% and 2.5% in July (Fig. 2). Meanwhile, the Atlanta Fed’s GDPNow tracking model is currently estimating that real GDP is rising by 4.1% (saar during Q3).
My friend responded that this happy outcome can’t be sustainable and inquired: “What’s next?”
He might be right: This remarkably bright picture could still turn dark, resulting in stagflation. The analogy often proffered is the twin peaks in the inflation rate during the Great Inflation of the 1970s and the resulting stagflation during the decade. I first discussed this analogy in the September 27, 2021 Morning Briefing:
“In recent months, we’ve been discussing two alternative scenarios: The Roaring 2020s (TR-20) and The Great Inflation 2.0 (TGI-2.0). In the first scenario, the relevant paradigm is the decade of the 1920s; in the second, it’s the 1970s. In recent Zoom calls, I’ve been asked by some of our accounts to assign subjective probabilities to these alternative scenarios. I am going with 65% odds for TR-20 versus 35% for TGI-2.0. I may be spending much of the rest of this decade tweaking these probabilities.”
For now, I am sticking with those odds.
Today, reflationists undoubtedly would give higher odds to a rerun of the 1970s—probably well over 50%. After all, the price of oil is rising again. Labor unions are pushing for big pay increases and getting them. Some are even aiming to bring back cost-of-living-adjustment (COLA) clauses in their contracts. The federal deficit is ballooning as the federal government spends on infrastructure, green projects, and incentives to onshore manufacturing, particularly of semiconductors. The government is crowding out other borrowers in the capital markets and competing for workers in the labor market.
The reflationists have a point: It may be only a matter of time before these cost pressures show up as a second wave of inflation. That would force the Fed to keep raising interest rates until something breaks in the financial system, triggering an economy-wide credit crunch and a recession. It could all happen during the first half of the 2020s—like the 1970s on steroids.
But even in that case, I believe that the second half of the 2020s still could follow the 1920s script. In any event, Debbie and I remain disinflationists. We think that inflation peaked last summer and likely will fall to the Fed’s 2.0% target by 2025.
Let’s compare the 1970s to the 2020s so far:
(1) Overview. During the 1970s, two OPEC oil supply shocks triggered an inflationary wage-price spiral (Fig. 3). They also caused a couple of nasty recessions. The US budget deficit swelled as the government pursued a policy of both “guns and butter.” Defense spending rose as the nation competed in the nuclear arms race with the Soviet Union and waged a war in Vietnam. At the same time, spending on social welfare programs increased in response to widespread riots in the inner cities. The US trade deficit ballooned when Japan emerged as a significant threat to many American industries, especially the auto industry. There were growing concerns about “de-industrialization.” Productivity growth collapsed during the decade.
Inflation trended higher despite a couple of severe recessions. That led to a widely held view that inflation had become a structural problem, raising the question of whether recessions could ever bring it down again. The oil shocks of 1973 and 1979 were transmitted to the wages of union workers by automatic COLAs in many of their contracts. As labor and fuel costs soared, companies raised prices. It was a classic wage–price spiral—which economists called “cost-push inflation”—caused by an exogenous inflation shock (Fig. 4).
In addition to a wage-price spiral during the 1970s, there was a rent-wage spiral. The CPI tenant rent inflation rate rose from 4.0% y/y at the beginning of the decade to peak at a record 11.0% during August 1981 (Fig. 5). That put lots of upward pressure on wage inflation (Fig. 6).
(2) Commodities. At the start of the 1970s, commodity prices soared when President Richard Nixon allowed the dollar to depreciate significantly (Fig. 7). Oil is priced in dollars, so OPEC cartel members, to offset the effects on their profits of the dollar’s depreciation, succeeded in raising the price of oil by lowering their output. Both energy and food prices soared during the early 1970s and near the end of the decade, when oil prices jumped again, raising the cost of producing food (Fig. 8).
This time, the dollar remains relatively strong. Commodity prices remain weak. The price of oil has rebounded in recent weeks. However, global economic activity and demand for commodities remain lackluster as both China and Europe grapple with rapidly aging demographic profiles, depressing consumer spending. In addition, China is struggling with the deflationary consequences of the depression in its property market. In the US, the housing market remains in a recession.
(3) Wages & rent. In the US, union membership has dropped significantly since the 1970s. The available data show that 16.8% of private wage and salary employment was unionized in 1983 (Fig. 9). This percentage dropped to a record low of 6.0% during 2022. So we don’t expect that the headline-grabbing news about recent union settlements will be as likely to boost overall wage inflation as it did in the 1970s.
Also, as noted above, there was a wage-rent spiral that spiraled out of control during the 1970s. We don’t see that happening this time. Average hourly earnings for all workers peaked last year at 5.9% y/y during March. It was down to 4.4% this July. According to Zillow, rent inflation for new leases has dropped from last year’s peak of 16.4% during March to 3.5% this July (Fig. 10). That augurs well for the CPI and PCED rent components in coming months since the Zillow rate leads them by about 10 months. It also augurs well for lower wage inflation.
(4) Labor & productivity. The Baby Boomers first entered the labor force during the 1970s, thus boosting its growth rate (Fig. 11). They were well educated but inexperienced. They contributed to the collapse in productivity growth mentioned above, as did rigid and costly work rules imposed on employers by their contracts with unions (Fig. 12). Meanwhile, hourly compensation soared during the 1970s, and so did unit labor costs (ULC) in the nonfarm business sector (Fig. 13).
This time, ULC peaked last year at 7.0% y/y during Q2, well below the double-digit twin peaks of the 1970s. ULC inflation tends to drive the CPI inflation rate. The former fell to 2.4% during Q2, confirming the drop in the CPI inflation rate to 3.2% y/y during July.
This time, the economy is experiencing structural shortages of labor. That could lead to higher wage inflation, we suppose. However, we are expecting a productivity boom over the remainder of the Roaring 2020s, which will keep a lid on price inflation while boosting real wages and profitability.
(5) Inflation expectations. By the end of the 1970s and the start of the 1980s, expected inflation over the next five years was in the high single digits. That’s according to the same survey that is used to compile the Consumer Sentiment Index (CSI). In early August of this year, expected inflation was 2.9% y/y (Fig. 14). Fed officials have been saying that inflationary expectations are “well contained,” and they’ve been right about that. Since mid-2021, when inflation started to take off, this measure of long-term inflationary expectations has remained close to 3.0%, up slightly from around 2.5% before the pandemic during 2018 and 2019.
Yesterday, the Federal Reserve Bank of New York released its monthly survey of one-year-ahead and three-year-ahead expected inflation rates. The former was down to 3.6% from a peak of 6.8% last year during June (Fig. 15). That’s the lowest reading since April 2021. The latter was up 2.9%, confirming the low number in the CSI survey.
Disinversion
August 14 (Monday)
Check out the accompanying pdf and chart collection.
Executive Summary: Is the federal budget deficit getting too big for the bond market to fund without yields moving higher? That seems to be a growing concern in both the bond and stock markets. In the past, bond yields were determined mostly by the Fed’s response to inflation, which is moderating; supply and demand didn’t matter much, but they may now. Today, we examine why this period of deficit widening is different than past ones. … We also examine two scenarios that could unwind the inversion of the yield curve—one bullish, one bearish—and recap data supporting both. … And: Dr. Ed reviews “The Man Who Saved the Game” (+ + +).
YRI Weekly Webcast. Join Dr. Ed’s live webcast with Q&A on Mondays at 11 a.m. EST. You will receive an email with the link one hour before showtime. Replays of the weekly webcasts are available here.
Yield Curve I: Two Alternative Disinversion Scenarios. Over the years, I’ve frequently been asked why I am not more concerned about the widening US federal government budget deficit and the resulting mountain of mounting federal debt. I’ve consistently responded that I will care about this issue when the financial markets care about it. That time has come because the bond market seems to be concerned.
In the past, I’ve observed that the supply of and the demand for bonds isn’t usually as important to the determination of the bond yield as are actual and expected inflation and the expectations of how the Fed will respond to them. So given that Debbie and I expect inflation to continue to moderate, we currently predict that the bond yield won’t rise above 4.25%. It closed at 4.16% on Friday. If we are wrong about that, however, and the bond market has trouble financing the government’s huge deficit at current market interest rates, then the Bond Vigilantes could go wild. We don’t think that means that the 10-year jumps to 5.00%-5.50%, but it could rise to 4.50%-4.75%.
In the past, bond yields tended to fall when the federal budget deficit widened because it did so during recessions as the government’s revenues decreased. Private credit demands decline during recessions. The Fed lowers short-term interest rates during recessions as inflation moderates, which causes investors to buy bonds.
This time, the budget deficit widened as the government sought to avert a pandemic-related depression by providing lots of fiscal spending, including three rounds of pandemic relief checks during 2020 and 2021. The combination of ultra-easy monetary and fiscal policies amounted to the dropping of trillions of dollars of “helicopter money” on the economy. The result was a surge in inflation during the second half of 2021 through the summer of 2022, when it peaked.
The inflation surge forced the Fed to raise the federal funds rate significantly, from zero at the start of 2022 to 5.25%-5.50% currently (Fig. 1). However, fiscal policy doubled down, with Congress enacting several spending initiatives promoted by the Biden administration in 2021. That’s mainly why the US economy hasn’t fallen into a recession: Tight monetary policy was offset by very stimulative fiscal policy.
The 10-year US Treasury bond yield has been rising along with the federal funds rate and the 2-year Treasury yield since 2022 but at a slower pace than them. As a result, the yield-curve spread between the 10-year and 2-year Treasuries inverted last summer (Fig. 2 and Fig. 3).
That inversion was widely interpreted to be a reliable signal that a recession was coming. The only reason that investors would buy a 10-year bond at a yield below the 2-year note is that they see a good chance that increasingly restrictive monetary policy will break something in the financial system, setting off a broad credit crunch and a recession. Then the Fed would be forced to reverse course.
Sure enough, a banking crisis occurred in March, and on August 7 Moody’s downgraded the credit ratings of several regional banks. However, there has been no credit crunch so far because the Fed responded quickly in March with an emergency liquidity facility for the banks. So far, the most widely anticipated recession of all times remains a no-show.
Bond investors therefore are concluding that, while the Fed might be done raising the federal funds rate, it won’t be lowering that rate anytime soon. With short-term money market rates likely to stay elevated for longer than was expected earlier this year (when a recession was widely anticipated), there’s less of a rush to buy bonds. Meanwhile, fears that a deluge of Treasury securities might push yields higher can be self-fulfilling as investors plow into money market instruments.
In the past, the yield curve disinverted during recessions, when the Fed lowered the federal funds rate faster than bond yields fell. This time, the risk is that with no recession in sight, the yield curve will disinvert as the bond yield rises toward the elevated level of money market rates.
That shouldn’t happen if inflation continues to moderate, raising expectations that the Fed might start to lower interest rates next year. Indeed, in an August 2 NYT interview, Federal Reserve Bank of NY President John Williams suggested that’s a very plausible scenario:
“Assuming inflation continues to come down … next year, as many forecast, including the [FOMC members’] economic projections, if we don’t cut interest rates at some point next year then real interest rates will go up, and up, and up. And that won’t be consistent with our goals. So … from my perspective, to keep maintaining a restrictive stance may very well involve cutting the federal funds rate next year or [the] year after; but really, it’s about how are we affecting real interest rates—not nominal rates.”
That’s the scenario we are rooting for, of course. The alternative is that while we are waiting for the happy one to occur, the mounting federal budget deficit spooks the bond market, causing bond yields to spike higher. In the first scenario, the yield curve disinverts as short-term interest rates fall faster than long-term ones. In the second scenario, bond yields rise to narrow their gap with short-term rates.
Yield Curve II: Supply & Demand vs Inflation. If we didn’t all have skin in the game, the tug of war in the bond market between the bulls and the bears would be very entertaining. The consequences of who wins obviously matter greatly, not only to bond investors but also to stock investors.
Favoring the bears in both markets is the rapidly widening federal deficit and evidence that demand may not match the supply of Treasury securities unless their yields continue to rise. Favoring the bulls, in our opinion, is that since last summer inflation has been on a moderating trend that should persist through 2025 without any further increases in the federal funds rate. The Williams scenario should kick in next year if inflation continues to head toward the Fed’s 2.0% y/y target by 2025.
Now let’s review the latest relevant bearish and bullish data:
(1) Lots of supply. On August 1, Fitch Ratings downgraded US government debt from AAA to AA+ for all the reasons that have been concerning investors for years. None of this is news. However, the Fitch downgrade reminds us all that fiscal policy continues to get more and more profligate and that the supply of US Treasuries could weigh more and more on the bond market.
The US federal deficit and the resulting mounting US debt are growing as percentages of nominal GDP. On a 12-month-sum basis, the former just jumped from $1.0 trillion last July to $2.3 trillion through July, as outlays have been rising while revenues have been falling over the past several months (Fig. 4 and Fig. 5).
The net interest paid by the government has continued to rise rapidly along with interest rates since early last year. This outlay rose to a record $627.5 billion over the 12 months through July (Fig. 6). Just before the pandemic, it was $377.5 billion.
Total federal government debt subject to the debt limit rose to a record $32.5 trillion during July, up 6.5% y/y (Fig. 7). The publicly held debt excluding the Fed’s holdings was $20.6 trillion. The government held $9.8 trillion of its own debt in trust funds and including the Fed’s holdings of $5.7 trillion.
(2) Dwindling demand. The Fed’s QT program will continue to reduce the Fed’s holdings of Treasuries by about $60 billion per month (Fig. 8). Commercial banks in the US have also been reducing their holdings of government securities (including Treasuries and agencies) since early 2022 (Fig. 9).
On a 12-month sum basis, buying of US Treasury notes and bonds by private foreign investors peaked at a record $1.0 trillion last October (Fig. 10). It was down to $787.8 billion through May.
(3) Moderating inflation. The CPI inflation rate remained on a moderating trend during July. The CPI rent component continues to be the stickiest one, but it too is moderating. Excluding shelter, the headline and core CPI inflation rates were just 2.0% y/y and 2.5% y/y in July (Fig. 11).
Also in July, the PPI final demand inflation rate was only 0.8% y/y, with goods down 2.5% and services up 2.5% (Fig. 12). The report showed goods prices outside food and energy were unchanged last month, indicating that the recent goods disinflation was becoming entrenched. On the other hand, the cost of wholesale services jumped 0.5% m/m, the largest increase since last August, after dipping 0.1% in June. The PPI report noted that a huge 7.6% m/m surge in portfolio management fees accounted for 40% of the rise in services. Portfolio management fees had dropped 0.4% in June. Last month's surge was likely due to the strong performance of financial markets as investors bet that the Fed was probably done hiking rates.
Contributing to the moderation in the core CPI and PPI final demand goods inflation measures are falling prices on Chinese imports (Fig. 13). The US doesn’t need to fall into a recession to bring inflation down if China falls into a deflationary recession instead.
(4) The TIPS yield. It wouldn’t take much to see the 10-year Treasury yield trading at 4.50%-4.75%. The 10-year TIPS yield was 1.80% on Friday (Fig. 14). If economic activity remains as strong as it has been lately and the supply of Treasuries weighs on the bond market, this yield could easily rise to 2.00%-2.25%. It was there during 2006 and 2007. The spread between the nominal and TIPS yields on the 10-year Treasury closed at 2.36% on Friday (Fig. 15). If it rises to 2.50%, the nominal yield will range between 4.50% and 4.75%.
(5) Hot & cold economic indicators. The 13-week change in the 10-year Treasury bond yield closely tracks the Citigroup Economic Surprise Index (CESI) (Fig. 16). The CESI rose from zero on May 24 to 73.7 on Friday. Over the past 13 weeks, the yield is up 63bps. The Atlanta Fed’s GDPNow tracking model is currently showing real GDP rising 4.1% (saar) during Q3, confirming that the economy remains hot.
(6) Weak individual tax receipts. The recent widening of the federal deficit is partly attributable to a significant drop in federal individual tax receipts so far this year (Fig. 17). Meanwhile, payroll tax receipts rose to a record high of $1.6 trillion over the 12 months through July. Corporate tax receipts totaled $430.7 billion, near their recent record high. But individual income tax receipts (over the past 12 months) fell from a record high of $2.7 trillion last April to $2.2 trillion through this July.
Our hunch is that last year’s individual income tax revenues were boosted by capital gains tax revenues, as individual investors bailed out of their stocks during the 2022 bear market. So this year’s decline reflects a more normal pace of income tax receipts. Unfortunately, without such one-time windfalls, the underlying trend in the federal deficit is a bearish one for bonds.
(7) Bidenomics, MMT, and the Bond Vigilantes. The current administration is attempting to take credit for any good economic news while blaming the previous one for the bad news. Of course, that’s the modus operandi of all occupants of the White House.
What is unique about the current administration is that it has embraced Modern Monetary Theory (MMT), which claims that fears of widening federal deficits are based on several myths: that the federal government should budget like a household; that deficits will harm the next generation, crowd out private investment, and undermine long-term growth; and that entitlements are propelling us toward a grave fiscal crisis.
While the MMT proponents certainly have converted the Biden administration to their religion, the Bond Vigilantes remain heretics. The Biden administration may need to recall that in 1994, James Carville, a political adviser to President Clinton, famously remarked that if there were such a thing as reincarnation, he would like to be reincarnated as the bond market. By this, he meant that he would like to wield the bond market’s immense power to discipline and rein in errant economic policymakers by driving up interest rates. In other words, don’t incite the Bond Vigilantes!
Movie. “The Man Who Saved the Game” (+ + +) (link) is a warm-hearted movie about Roger Sharpe, the man who saved the pinball machine from decades of prohibition in many states around the country, including New York. It was widely deemed to be a gambling game controlled by the mob. Sharpe successfully convinced the powers-that-be in New York that pinball is a game of skill and provides lots of entertainment. What’s heart-warming about the movie is Roger’s relationship with his girlfriend, Ellen, and her son, who help him along the way. It’s nostalgia time for those of us who were pinball wizards! Don’t forget to listen to “Pinball Wizard” by the Who after you see the movie.
Semis, Ag & FinTech
August 10 (Thursday)
Check out the accompanying pdf and chart collection.
Executive Summary: The semiconductor industry appears to be entering a heyday, with sales rising on m/m and q/q bases, though not yet y/y. Analysts’ estimates have been rising, managements have been upbeat, and investors have bid up the S&P 500 Semiconductor industry’s share price index by 79% ytd. Everyone’s enthused about the potential impact of the AI revolution on chip demand. … At the other end of the spectrum, meat processors such as Tyson Foods are down on their luck, Jackie reports. … And: Traditional banks are getting a run for their money from forays into fintech by Apple, Walmart, and other heavyweights.
Technology: Semis on the Rise. Investors have decided that the semiconductor industry’s cycle has bottomed, and things are looking up. The S&P 500 Semiconductor industry’s stock price index has risen an astounding 79.1% ytd through Tuesday’s close (Fig. 1). It’s sitting 4.6% below its August 1 record high and 6.6% above its previous high in November 2021. The Semiconductor Industry Association’s most recent sales data confirm the notion that a turn has arrived, as did commentary from Skyworks Solutions executives during the company’s June-quarter (its fiscal Q3) earnings conference call. I asked Jackie to take a look at what each had to say:
(1) Industry data improves. Global semiconductor sales are still down sharply compared to last year, but they’ve been improving on a sequential-quarter basis, giving investors hope that the cycle’s bottom is behind us. Q2 global semi sales fell 17.3% y/y in June according to an August 4 Semiconductor Industry Association (SIA) press release. The Q2 y/y sales declines were broad based, in all the major regions except Europe: Europe (7.6%), Japan (-3.5), Americas (-17.9), Asia Pacific (-20.4), and China (-24.4).
However, on a q/q basis, global semi sales increased 4.7% in Q2 compared to Q1 sales. June marked the fourth consecutive month that the industry’s revenue has increased m/m (Fig. 2). The m/m sales gains, based on a three-month moving average, also were broad based geographically, with June sales rising over May levels by 4.2% in the Americas, 3.2% in China, 0.9% in Japan, and 0.1% in Europe. The only region in which m/m sales fell in June was Asia Pacific/All Other, -0.5% m/m.
The upward turn in semiconductor sales is confirming the jump in the S&P 500 Semiconductors industry’s forward earnings estimates, which have been climbing since mid-February (Fig. 3). Likewise, the industrial production of semiconductor and other electronic components has risen for the last five months, by 9.3%, after dropping 7.0% from a recent high during February 2022 through this January (Fig. 4).
(2) Skyworks sees blue skies. Skyworks executives’ optimism about the future countered the y/y and q/q sales declines that the company reported last quarter: Revenue of $1.1 billion was down 13.1% y/y and down 7.1% q/q. The inventory correction continues at Android original equipment manufacturers and at Skyworks itself, noted CEO Liam Griffin in the company’s quarterly conference call. The company aims to reduce its inventory to $1.0 billion or slightly below that, down from $1.2 billion last quarter—a process that will take a couple more quarters.
Nonetheless, Griffin expects double-digit sequential-quarter revenue and earnings growth in the current quarter. Specifically, the company expects its fiscal Q4 (ending September) revenue to increase 13% sequentially (using the midpoint of the company’s expected revenue range) and its fiscal Q4 earnings to increase 21% sequentially to $2.10 per share—still far below the year-earlier $3.02 a share. In a display of confidence, Skyworks recently boosted its quarterly dividend 10% to $0.68 a share.
Next quarter’s results should be bolstered by Apple’s expected introduction of a new phone this fall. Longer term, several trends should support the company’s sales. Griffin believes that artificial intelligence (AI) will spark “exponential growth in the amount of data accessed from the network edge to the cloud. In turn this will further drive complexity in wireless infrastructure network, as AI will require higher throughput, more secure connections, lower latency, and improved power management.” Consumers’ switch to electric vehicles, the expansion of the Internet of Things, and the emergence of augmented and virtual reality also should boost demand for the company’s products.
(3) Semi stats. Analysts are expecting earnings for the S&P 500 Semiconductor industry to fall 15.3% this year but rebound sharply in 2024, by 32.3% (Fig. 5). The net earnings revisions data that Joe tracks for the industry have yet to turn positive but have been improving. The industry’s forward P/E has jumped to 27.7 as of August 3 from 13.7 on June 20, 2022, as share prices have soared in anticipation of an earnings recovery (Fig. 6). Enthusiasm about AI and its impact on chip demand likewise have boosted some chip makers’ valuations. We wouldn’t be surprised if the industry’s stock price index moved sideways for a while after its recent ascent, allowing the industry’s P/E to decline as earnings improve.
Consumer Staples: Life’s Tough on the Farm. Tyson Foods posted disappointing results for its third fiscal quarter ended June. Revenue was down 3% y/y, and adjusted operating income fell 82% y/y to $179 million. The company faced headwinds in each of its poultry and meat categories—chicken, beef, and pork—for varying reasons:
(1) Where’s the beef? Revenue from beef sales was flat last quarter y/y, but adjusted operating profit in the segment dropped to $79 million from $506 million a year earlier because the price of cattle has risen sharply. The number of US cows being raised for their beef has fallen to the lowest level since at least 1971, when records began, and the futures price for live cattle has risen 30% over the past year and 47% over the past two years (Fig. 7).
Normally, we’d expect ranchers to respond to high cow prices by increasing the number of cows they raise. This time, that may be trickier, as herd size is being affected by changes in weather patterns and herd counts may remain lower for longer. “Ranchers have increasingly sent cows to slaughter as dry weather reduced the amount of pasture available for grazing,” a July 21 Reuters article reported. Tyson doesn’t expect relief anytime soon.
(2) Dropping pork & chicken prices. The pork market has suffered from excess supply and falling demand from consumers at home and in China. In Tyson’s pork division, that has translated into a decline in both volume and average price, leading to an adjusted operating loss of $70 million last quarter compared to an adjusted operating profit of $25 million a year earlier.
Revenue in the chicken segment declined last quarter due to lower prices for processed chicken. Higher feed costs further darkened the picture, boosting expenses and leading to an adjusted operating loss of $63 million compared to the $269 million of profits the segment enjoyed in the same quarter last year. Tyson may get some relief on feed prices, as recent rains have resulted in a bumper corn crop in the US, sending the price of corn down 28% ytd (Fig. 8).
While tough times are expected to continue in the current quarter, Tyson executives noted the company’s improvement on a q/q basis. Tyson reported a loss of four cents a share in its fiscal Q2 (ended March) compared to the 15 cents a share it earned last quarter. Tyson has closed some of its chicken processing plants and increased the automation in remaining plants to improve utilization and profitability. The processors’ shares have fallen 11.6% ytd through Tuesday’s close compared to the S&P 500’s 17.2% gain. Since they peaked in February 2022, Tyson shares have fallen by 41.0%, dramatically underperforming the S&P 500’s 2.5% gain.
(3) Industry data. Tyson is a member of the S&P 500 Packaged Foods & Meats stock price index, which is near an all-time high (Fig. 9). The industry is dominated by food companies including Hershey, Kellogg, and J.M. Smucker. After raising prices and enjoying strong revenue growth in recent years—6.0% in 2021 and 8.4% in 2022—the industry’s top-line growth is forecast to slow to 4.8% this year and 2.7% in 2024 (Fig. 10). Profits have grown more slowly than revenue—4.7% in 2021 and 4.0% in 2022—and they’re expected to decline 6.3% this year and rebound 9.6% in 2024 (Fig. 11). The industry’s forward P/E has risen from a low of 13.9 in 2018 to 18.3, not far from its recent peak of 20.0 on May 11.
Disruptive Technology: Fintech’s Drumbeat Grows Louder. Fintech companies have started to grow up. They might not be large enough to keep JP Morgan Chase CEO Jamie Dimon awake at night—yet. But they’re offering competitive interest rates on a fast-growing pile of deposits, which make them a competitive threat to smaller banks and perhaps even to regional players.
Apple announced earlier this month that its online savings account had accumulated more than $10 billion in deposits in less than four months!
To put that in perspective, if Apple were a bank, its deposit base would be the 141st largest in the US. That’s according to a January 23 blog post listing financial institutions by deposit size as of year-end 2022, courtesy of MX Technologies, a tech company catering to the financial industry. Again, that’s not likely to worry JP Morgan or Bank of America, ranked number one and two on MX’s list with roughly $2.0 trillion of deposits each. But deposit sizes drop pretty quickly as the institutions on the list get smaller: Ranked 10th was TD Bank ($329.7 billion of deposits at year-end), 20th was the now-defunct Silicon Valley Bank ($161.5 billion), and 30th was Discover Bank ($94.9 billion). At the rate Apple has been growing deposits, it won’t take long before it’s among these top 30.
Let’s take a look at what Apple and other players in the dynamic fintech space—Walmart, SoFi, Bread, and Chime—have been up to:
(1) Apple taking a bite. Apple has a way of making things easy. Its Wallet app comes already installed on the iPhone. It started small, asking customers to load information from other credit cards onto the app. Then in 2019, Apple started offering its own credit card, the Apple Card, which is provided by Goldman Sachs. Apple initially had the cash back from credit card purchases loaded onto the Apple Cash Card, which was issued by Green Dot Bank. (Green Dot boasts FDIC insurance and $3.7 billion of deposits.)
Now consumers have another option. They can deposit the cash earned on credit card purchases into an Apple savings account, which is also provided by the FDIC-insured Goldman Sachs Bank, a division of The Goldman Sachs Group. The savings account has no annual fees, no minimum balances, and pays a 4.15% interest rate. Consumers can opt to deposit additional funds into the account from other banks.
The Goldman Sachs Group had $148.3 billion of consumer deposits as of June 30 that came from Apple and Marcus, its retail banking arm. The MX blog ranking includes deposits from other arms of Goldman, which when taken together totaled $352.0 billion at year-end and placed the firm in 9th place. Despite the fast deposit growth, Goldman has indicated that it wants out of retail banking and is in talks to sell the Apple credit card and high-yield savings account business to American Express, according to a June 30 CNBC article. While the division grew its revenue over the past two years, it failed to turn a profit.
(2) Walmart jumps in too. Walmart offers One, a debit card and savings account provided by Coastal Community Bank. The bank is part of Coastal Financial Corporation, which had $3.2 billion of deposits as of June 30. About half of the deposits comes from its online banking services arm, and the other half comes from a traditional brick-and-mortar community bank.
Walmart also offers credit cards through Capital One and the Walmart MoneyCard, another debit card provided by Green Dot. Walmart has sued in an attempt to break its contract with Capital One. The company has said it’s doing so because Capital One has failed to deliver on its customer care responsibilities. But there’s speculation that the retailer would much prefer to issue its own credit cards under the One brand.
(3) Online-only banks in the mix. Bread Financial offers its banking services online, including a high-yield savings account boasting a 5% interest rate. The firm also provides private-label credit cards to more than 50 million individuals on behalf of retailers, like BJs and Wayfair. The company owns Comenity Capital Bank, which has $9.2 billion in deposits, placing it 148th on the MX list of deposits.
SoFi also offers its financial services online, sometimes on its own and sometimes through partnerships with other financial institutions. SoFi Bank, which is FDIC insured, had $12.7 billion of deposits at the end of Q2, 98% of which were insured. That’s up from $7.3 billion at year-end, when the firm ranked 176 on the MX list. Today, its online savings account offers a 4.5% annual yield.
Other financial services SoFi offers include cyber insurance through Blink by Chubb, auto insurance from Gabi, life insurance from Ladder, and homeowners’ and renters’ insurance by Lemonade. Personal, student, and auto loans as well as credit cards and small business loans are provided by the Bank of Missouri.
Chime’s checking and savings accounts are offered through The Bancorp Bank or Stride Bank, both FDIC members. Bancorp Bank had $7.1 billion of deposits at year-end, putting it in 182nd place on the MX list.
For more on fintech’s charge into banking, consider reading earlier Morning Briefings dated May 18, 2023, May 19, 2022, and March 11, 2021.
Mostly About Consumers
August 09 (Wednesday)
Check out the accompanying pdf and chart collection.
Executive Summary: Moody’s downgrade of several banks’ credit ratings has some investment implications: It’s bearish for Financials stocks, but only over the short term, as it will hasten M&A activity. It will facilitate the US Treasury’s ability to fund the budget deficit without increasing Treasury bond auction interest rates, supporting our belief that last year’s peak in the 10-year Treasury yield won’t be breached this year. And it drives home the point that credit conditions are tight enough, which should help deter the Fed from further tightening. … Also: A look at consumers’ credit-card usage, rent inflation, and the spending habits of an important demographic—never married singles.
Strategy: Moody’s Darkens the Mood for Financials. Joe and I have been predicting that the second half of this year will be more challenging than the first half. The S&P 500 rose 19.5% from the end of last year through the bull market’s high of 4588.96 on July 31. So our year-end S&P 500 target of 4600 occurred five months ahead of schedule. We’ve left it at 4600, figuring that the market might move sideways or sell off through September before commencing a year-end rally back to 4600.
Now we have a good reason for why the second scenario (down, then up) might happen. On Monday, after the markets’ close, Moody’s cut the credit ratings of several small to mid-sized US banks and said that it may downgrade some of the nation’s biggest lenders, warning that the sector’s credit strength likely will be tested by funding risks and weaker profitability.
That supports our cautious market call, but it pulls the rug out from under our recommendation to overweight the S&P 1500 Financials, for now. However, we’re still expecting lots of M&A activity in the sector to provide a boost to the bank stocks. The downgrade should hasten that scenario. But for now, the downgrade is what it is, i.e., bearish for the Financials over the short term.
The downgrade activated the risk-off trade benefitting the US Treasury bond market, which was downgraded on August 1 by Fitch Ratings from AAA to AA+ for all the reasons that have been concerning the bond market for years. None of this is news. However, the Fitch downgrade reminds us all that fiscal policy continues to get more and more profligate. The US Treasury will be selling lots of notes and bonds during August and over the rest of this year, while the Fed’s quantitative tightening program will continue to reduce the Fed’s holdings of Treasuries by about $60 billion per month.
So ironically, Moody’s downgrade of the banks should make it easier for the US Treasury to fund its deficit with its securities (downgraded by Fitch) without a significant increase in interest rates in the Treasury’s auctions for now. This confirms our prediction that the 10-year Treasury yield’s peak of 4.25% last year on October 24 should not be breached this year. It certainly came close on Friday, when the yield jumped to 4.20% before falling closer to 4.00% by day-end.
We still believe that October 12 marked the start of a new bull market in stocks, which should take the S&P 500 up to 5400 by the end of 2024.
Note to our friends at the Fed: Congratulations! You’ve been aiming for over a year to raise the federal funds rate to a sufficiently restrictive level to bring inflation down without causing a recession. Mission accomplished! But please don’t jinx it by saying so. You can say that Moody’s downgrade of the banks and your recent Senior Loan Officer Opinion Survey (SLOOS) confirm that credit conditions are tightening quickly so there’s no reason to risk an overkill by raising the federal funds rate again.
US Consumers I: Odd Drop in Revolving Credit. Just when many pessimistic prognosticators claimed that consumers were on a credit card fueled buying binge, revolving credit fell $604.5 million during June (Fig. 1). That was the first decline in more than two years. Over the previous 24 months, the average pace of consumers’ credit card borrowing was $11.8 billion per month. June’s decline in credit card debt is odd given that nominal personal consumption expenditures rose 0.5% m/m during June and retail sales increased 0.2% during the month.
In other words, it’s hard to explain the latest drop. Perhaps it was a one-month aberration. Also funky was that nonrevolving credit, which includes mostly auto and student loans, rose $18.5 billion during June following a weak gain of just $967.4 million during May, which might have been another statistical aberration. Total consumer credit rose $17.8 billion during June, which is more in line with the pace of such borrowing over the past two years or so.
In any event, we often hear concerns that consumers have had to borrow because inflation has boosted the prices of the goods and services that they buy on credit. That makes sense. The hard-landers assert that consumers are overindebted to such an extent that when their excess savings accumulated during the pandemic runs out—likely before year-end—they’ll have to retrench because they will be maxed out on their credit cards.
Of course, this grim outlook assumes that the prospects for personal income and employment also are likely to deteriorate, though that seems to be an assumption rather than a well reasoned analysis. The assertion is that when the unemployment rate is historically low, as it is now, the next big move is always to the upside, especially when the Fed is tightening monetary policy to achieve that very aim, as it is now.
Now consider the following related observations:
(1) Revolving credit rose to a record high of $1.3 trillion during May (Fig. 2). It exceeds the pre-pandemic peak of $1.1 trillion during 2020 by $161.7 billion.
(2) Revolving credit currently equals only 6.3% of nominal disposable personal income and 6.9% of total consumer spending excluding autos and owners’ equivalent rent (Fig. 3 and Fig. 4).
(3) At the end of Q2 (i.e., during June), student loans totaled a near-record $1.8 trillion and auto loans totaled a record $1.5 trillion (Fig. 5).
(4) The Fed also compiles monthly data on consumer-related loans at all commercial banks on a weekly basis. They rose to a record high of $1.89 trillion during the week of June 14 and edged down $7.2 billion through the July 26 week (Fig. 6). Credit card loans rose to a record high of $1.0 trillion at the end of July. The banks’ auto loans peaked last year and declined modestly to $508 billion during the July 26 week.
(5) The banks certainly have raised the interest rates they charge on consumer loans. On all credit cards, the rate rose from 14.60% in 2021 to 20.68% in May. The rate on 60-month new car loans is up from 4.82% in 2021 to 7.81% in May. These rates are clearly meant to encourage users to pay off their balances every month.
(6) The Fed’s Q3 SLOOS showed that the bankers’ willingness to make consumer loans dropped sharply during the past five quarters. This series tends to lead the yearly percent change in consumer loans by four quarters (Fig. 7).
(7) Our bottom line is that when it comes to the key drivers of consumer spending, consumer credit matters but not as much as personal income does. Perhaps once Americans return from their summer vacations in Europe, they’ll see how much damage they did on their credit cards and retrench. More likely, they will keep shopping as long as their purchasing power increases along with employment and real wages.
US Consumers II: Rent. The rent components of the CPI and PCED account for much of the stickiness in the inflation rates for both. However, as we noted last week, rent inflation for new leases has declined sharply in recent months, and that should increasingly be reflected in the two price measures that measure rent on all outstanding leases.
Just for fun, Debbie and I played with the rent numbers to assess their importance to consumers and to the inflation rate:
(1) We calculated personal consumption expenditures (PCE) on tenant rent divided by the total number of households that rent (Fig. 8). It rose to a record annualized $15,032 per renter household during Q2. It is up 8.3% y/y (Fig. 9). This series loosely tracks the CPI primary rent inflation rate.
(2) We can do a similar analysis for owners’ equivalent rent. It rose to a record annualized $24,245 per homeowning household during Q2 (Fig. 10). It also loosely tracks the CPI owners’ equivalent rent, both on a y/y basis (Fig. 11).
(3) Tenant rent and owners’ equivalent rent currently account for 3.6% and 11.4% of personal consumption expenditures as well as the headline PCED (Fig. 12). Tenant and owners’ equivalent rent account for 7.6% and 25.5% of the headline CPI.
(4) The good news is that rent inflation, which is a major component of the PCED services inflation rate (22.5% currently), is likely to head lower at a faster pace in coming months. Rent inflation in the PCED, including both rent of primary residence and owners’ equivalent rent, edged down to 8.0% in June from a recent high of 8.4% in April (Fig. 13). It lags measures of rent on new leases such as the Zillow Index and the ApartmentList Index, which were down to 4.1% in June and -0.7% in July, respectively.
US Consumers III: Lots of Singles & Fewer Renters. While we are on the subject of the American consumer, here are a few interesting demographic updates:
(1) Among the US population 16 years and older, the number of singles rose to a record high of 137.4 million in July (Fig. 14). Singles now account for 51.5% of the civilian noninstitutional working age population, up from 38% in 1977 (Fig. 15). Singles who’ve never married made up a record 33.1% of the US population in July, while those who are divorced, separated, or widowed represented 18.4% (Fig. 16).
With a third of the adult population representing never-married singles, our hunch is that this group must be having some important consequences for the US economy. Never-married singles might have a higher propensity to spend and a lower propensity to save. They are likely to dine out and travel more than married couples and families. They certainly are more mobile, for both work and pleasure, since most aren’t tied to the schedules of children.
(2) The number of US households rose to a record high of 130.2 million in June, a 27% increase since 2000 (Fig. 17). The number of homeowner-occupied households totaled a record 85.3 million during Q2, while the number of renting households was flat at 44.1 million (Fig. 18).
Since the pandemic, there has been a relatively strong demand for homeownership, which has kept home prices high despite soaring mortgage rates (Fig. 19). The demand for rentals has dwindled so far this year, which must be putting downward pressure on rent inflation.
Worry List Update
August 08 (Tuesday)
Check out the accompanying pdf and chart collection.
Executive Summary: Most investors and analysts are newly optimistic about the economic outlook and corporate earnings prospects. Like them, we see low odds of a hard landing anytime soon. That’s notwithstanding the yield curve’s ongoing recession signal. … But six worries, should they become more worrisome, could change our sanguine stance. We’re watching closely for fallout from the US commercial real estate crisis; a reinvigorated wage-price spiral; the off chance that consumers retrench; the soaring federal deficit, which could cause Bond Vigilantes to get more vigilant; and the possibility that Fed Chair Powell might take a page from predecessor Volcker’s playbook.
Weekly Webcast. If you missed Monday’s live webcast, you can view a replay here.
Strategy I: Don’t Worry, Be Happy. The hard-landing scenario has had a hard landing. Fewer economists are worrying about an imminent recession. Stock investors are also less concerned about a downturn that could send corporate earnings lower. The S&P 500 rose 28.3% from its bear market bottom on October 12, when it closed at 3577.03, to its bull market high on July 31 of 4588.96 (Fig. 1).
The rebound in the S&P 500 has been led by its forward P/E, which rose from 15.1 on October 12 last year to 19.6 on July 31 (Fig. 2). So it rose 29.8% over this period, while the S&P 500 rose 28.3%, indicating that investors are discounting an improvement in earnings in coming months.
Industry analysts have also turned more optimistic, as evidenced by S&P 500 forward earnings, which recently bottomed during the February 9 week and rose 4.0% through the August 3 week (Fig. 3). S&P 500 forward revenues has continued to rise to record highs, while the forward profit margin has stopped falling in recent months. (FYI: Forward earnings and revenues are the time-weighted average of industry analysts’ forecasts for the current year and following one, the forward P/E is the multiple based on forward earnings, and the forward profit margin is the margin calculated from forward revenues and earnings.)
Stock market sentiment has turned very bullish since the start of the current bull market. Investor’s Intelligence Bull/Bear Ratio was down to 0.57 during the October 11 week (Fig. 4). It rose to 3.07 during the August 1 week. The percentage of bulls rose from 25.0% to 57.1% over this period, while the percentage of bears fell from 44.1% to 18.6%.
The 10-year Treasury bond yield peaked last year at 4.25% on October 24, fell to a 2023 low of 3.30% on April 5, and rose back to just a bit over 4.00% last week (Fig. 5). The 2-year Treasury bond yield fell to this year’s low (so far) of 3.75% on May 4, mostly on fears that the March banking crisis would turn into an economy-wide credit crunch and recession (Fig. 6). Since that low, the 2-year yield jumped to 4.78% on Friday.
Of course, the depleted contingent of hard-landers can still take some comfort from the inverted yield curve. The yield spread between the 10-year and 2-year Treasury notes widened to a low of -100bps on June 30 (Fig. 7). It narrowed to -67bps on Monday. But it was still significantly negative, supporting the opinion of some prognosticators that a recession is still coming, since inverted yield curves have always predicted recessions. We don’t share that view currently.
Strategy II: Worry, But Be Happy Anyway. So now that investors, analysts, and investment strategists are mostly bullish, Debbie, Joe, Melissa, and I are on the alert for what could go wrong. We’ve been updating our worry list over the past couple of weeks. Here is our latest update:
(1) Commercial real estate crisis. According to the latest US National Office Report from CommercialEdge, the national vacancy rate for office buildings was 17.1% as of July 2023, up from 15.3% a year ago. This means that out of the total US office stock of 6.8 billion square feet, about 1.2 billion square feet of office space was vacant.
Some owners of vacant office buildings are demolishing them and building structures that should be easier to lease. For example, owners of a two-building campus in Santa Ana, California are taking the unusual step of tearing down their recently renovated property and converting the eight-acre site into a logistics hub.
“Picklemall” may be the solution for some vacant mall space. A pickleball facility has replaced the former At Home store in Tempe, Arizona. It’s a 104,000-square-foot business that’s now home to more than a dozen pickleball courts.
Nevertheless, many owners of commercial real estate may have no choice but to default on their mortgages, and their bankers will have to sell the properties at distressed prices.
The Fed’s Q3 Senior Loan Officer Opinion Survey (SLOOS) found that 67.8% of lenders continued to tighten lending standards for commercial real estate (CRE) loans (Fig. 8). The net percentage of lenders reporting stronger demand was -53.3% (Fig. 9).
CRE loans at all commercial banks have been flat at a record high just below $3.0 trillion since the March 15 week, the same time as the banking crisis hit (Fig. 10).
(2) Renewed wage-price spiral. The economic recovery from the Covid-19 pandemic unleashed a wage-price spiral in the labor market. As the economy reopened, workers pushed for higher wages and better benefits, forcing companies to raise their prices. Many workers achieved wage increases by quitting their jobs for better paying ones. They could do so because the demand for labor has exceeded the supply since May 2021 (Fig. 11). That’s still the case, though wage and price inflation both have moderated.
Meanwhile, unionized workers haven’t been doing as well as nonunionized ones. The Employment Cost Index for the former rose 3.6% y/y through Q2 and for the latter 4.5% y/y (Fig. 12). As a result, labor unions have grown more assertive. And they’ve grown more powerful, as they’ve succeeded in organizing new workers and winning strikes in recent years. The labor unrest is being felt across a wide range of industries, including transportation, healthcare, and retail.
The United Auto Workers union is starting negotiations with the auto industry by demanding a 20% immediate wage increase and an additional 5% during each year of the contract. The autoworkers’ wages at the Big Three currently range from roughly $18-$32 an hour, depending on seniority, according to the union. Starting wages are about $10-per-hour lower than what they would be had they kept up with inflation since 2007, the UAW said.
Unionized workers are a relatively small percentage of the labor force. But their contracts can have an influence on wages in the nonunionized sector.
(3) Consumers retrench. Of course, it’s still possible that when consumers’ excess savings run out later this year, they will reduce their spending. A more important determinant of consumer spending is disposable personal income, which depends on aggregate weekly hours worked. Friday’s employment report showed that the latter rose just 1.3% y/y during July, the slowest pace since March 2021 (Fig. 13). This slowdown is partly offset by the fact that average hourly earnings adjusted for inflation has been rising in recent months.
(4) Federal deficit spiral. The US federal deficits and the resulting mounting US debt are growing as percentages of nominal GDP. On a 12-month-sum basis, the former just jumped from $1.0 trillion last July to $2.3 trillion through this June, as outlays have been soaring while revenues have fallen (Fig. 14 and Fig. 15). The net interest paid by the government has continued to rise rapidly along with interest rates since early last year. This outlay rose to a record $615.8 billion over the 12 months through June (Fig. 16). Just before the pandemic, it was $383.7 billion.
On August 1, Fitch Ratings downgraded US government debt from AAA to AA+ for all the reasons that have been concerning the bond market for years. None of this is news. However, the Fitch downgrade reminds us all that fiscal policy continues to get more and more profligate. The US Treasury will be selling lots of notes and bonds during August and over the rest of this year, while the Fed's QT program will continue to reduce the Fed's holdings of Treasuries by about $60 billion per month (Fig. 17).
(5) Bond Vigilantes rampage. The Bond Vigilantes may be turning more vigilant following the Fitch downgrade. They are happiest when the economy is weak and inflation is subdued. They are not so happy right now.
We are still expecting that the 10-year Treasury yield won’t rise above the October 24 high of 4.25%. But it wouldn’t take much for that to happen, which would set off lots of alarm bells about the yield potentially rising to 5.00%-5.50%. In that scenario, the valuation multiple of both the S&P 500 and Nasdaq would likely take significant hits.
Over the years, we’ve frequently been asked why we aren’t more concerned about the widening US federal government budget deficit. We’ve consistently responded that we will be concerned about it when the financial markets are concerned about it.
We believe that supply and demand for bonds isn’t usually as important to the determination of the bond yield as are actual and expected inflation and the expectations of how the Fed will respond to them. So given that we expect inflation to continue to moderate, we currently predict that the bond yield won’t rise above 4.25%. If we are wrong about that, and the bond market has trouble financing the government’s huge deficits at current market interest rates, then the Bond Vigilantes will go wild. If that happens, head for the hills for the rest of the summer and maybe September too.
(6) Fed goes Volcker. If inflation doesn’t continue to moderate and appears increasingly sticky well above the Fed’s 2.0% target, Fed Chair Jerome Powell and his colleagues may conclude that they have no choice but to “Volckerize” interest rates, i.e., raise them until they vaporize economic growth, as former Fed Chair Paul Volcker did in the late 1970s.
(7) Bottom line. The half dozen worries listed above will likely keep us busy over the rest of this year. For now, our economic outlook remains 85% odds of a no-landing or soft-landing scenario and 15% odds of a hard landing; that should remain the case unless one or several of the worries become more worrisome.
We think the S&P 500 should churn below 4600 over the rest of the year, offering opportunities to invest in those companies, industries, and sectors that have been performance laggards over the first half of this year while taking some profits in the leaders—which may face challenges to their lofty valuations from the Bond Vigilantes.
Guess What?
August 07 (Monday)
Check out the accompanying pdf and chart collection.
Executive Summary: This is ironic: Just when the most widely anticipated recession of all times is no longer widely anticipated, July’s employment report suggests that the Index of Coincident Economic Indicators is weakening. … With the consensus now elbow-to-elbow with us in the no-recession camp, our contrarian instincts are on full alert. The alternative scenarios of two prominent financial market prognosticators may give investors pause and keep the stock market treading water through September. … Also: Friday’s employment report does support a scenario of gradually moderating inflation, notwithstanding some observers’ views to the contrary. … And: Dr. Ed reviews “The Beanie Bubble” (+ + +).
YRI Weekly Webcast. Join Dr. Ed’s live webcast with Q&A on Mondays at 11 a.m. EST. You will receive an email with the link one hour before showtime. Replays of the weekly webcasts are available here.
US Economy I: What a Coincidence! Now that everyone agrees that a recession isn’t imminent, July’s Index of Coincident Economic Indicators (CEI) could be flat or even down slightly. That’s after showing no change in June (Fig. 1).
The CEI’s component indicators—payroll employment, real personal income less transfer payments, real manufacturing and trade sales, and industrial production—are included among the data used to determine recessions in the US. The CEI on a y/y basis tracks the y/y growth rate of real GDP very closely (Fig. 2). For the past two months, industrial production has contributed negatively to the coincident index, offsetting gains from the employment, sales, and income components (Fig. 3). Consider the following:
(1) Employment. Friday’s employment report showed that payroll employment edged up just 0.1% m/m to a new record high during July. However, it also showed that the other three components of the CEI likely fell slightly last month. By the way, Debbie and I have looked at the various components of payroll employment by industry and found that truck transportation and temporary help services are good leading economic indicators (Fig. 4). Truck transportation employment looks toppy, while temporary help services is weakening.
(2) Real personal income. Our Earned Income Proxy (EIP) for private-sector wages and salaries in personal income rose 0.2% m/m during July. While private payroll employment rose 0.1%, the average workweek fell 0.3%. So aggregate weekly hours worked declined 0.2% m/m, though it is still up 1.3% y/y (Fig. 5 and Fig. 6). Our EIP, which multiplies aggregate weekly hours by average hourly earnings, edged up just 0.2% during July (Fig. 7). This suggests that personal income could have declined modestly on an inflation-adjusted basis during July.
(3) Real business sales. Retail sales currently accounts for 33% of nominal manufacturing and distributors sales. On an inflation-adjusted basis, it too might have been weaker last month based on our real EIP (Fig. 8). We know that payroll employment in retail trade was basically flat last month. However, unit auto sales rose 0.6% during July (Fig. 9). Furthermore, payroll employment in wholesale trade rose to a new record high in July. On the other hand, given the weakness in industrial production during May and June, manufacturing shipments were probably down last month.
(4) Industrial production. The employment report obviously provides lots of clues about the CEI components. It does so for the industrial production component too, via the employment report’s series for aggregate weekly hours in manufacturing (Fig. 10). The latter was flat on both m/m and y/y bases during July.
US Economy II: Surprises, Bonds & Ackman. Now that almost everyone in the investment community is optimistic, at least about the near-term economic outlook, the economic surprises could be on the downside for a while. Don’t get us wrong: We are still assigning 85% subjective odds to a no-recession scenario through the end of next year and 15% odds of a downturn. We are still targeting the S&P 500 at 4600 by the end of this year (so there isn’t much upside now, in our opinion) and 5400 by the end of next year (so it’s still a bull market).
However, our contrarian instincts are on high alert because the most widely anticipated recession of all times is no longer widely anticipated. Consider the following:
(1) My friend David Rosenberg of Rosenberg Research, who continues to expect a recession soon and remains bearish on stocks, wrote last week that his COO told him: “[T]he ‘hate mail’ I have received on social media these past few weeks has been ‘off the charts.’ Use that information any way you want—but it is a contrarian indicator.”
(2) Billionaire Bill Ackman, CEO of Pershing Square, recently posted a very bearish tweet on the X social media platform. He wrote that he has placed a bearish bet “in size” on the 30-year Treasury bond yield rising to 5.50%, using options to limit his downside risk. He stated: “There are few macro investments that still offer reasonably probable asymmetric payoffs, and this is one of them.” He views it as a hedge. He focuses on the same bearish supply and demand factors as we have recently. Where we differ is in our outlook for inflation. He thinks it isn’t likely to fall below 3.0% in the long run. So the 30-year yield should be “3% + 0.5% (the real rate) + 2% (term premium).”
We haven’t changed our opinion that the 10-year Treasury bond yield peaked at 4.25% on October 24, 2022. That’s because we think that inflation could fall back down to 2.0% by 2025. This is the Fed’s objective, and we think the Fed’s game plan of keeping the federal funds rate at the currently restrictive level for longer will do the job, as will other disinflationary forces.
(3) So we are rooting for a decline in the Citigroup Economic Surprise Index (CESI) since that would help to stabilize the bond market. The 10-year US Treasury bond yield (on a 13-week change basis) closely tracks the CESI (Fig. 11). Friday’s payroll employment report was weaker than expected and might have set the stage for a batch of weaker economic indicators ahead, as discussed above.
(4) There may not be much upside for the S&P 500 and the Nasdaq through the end of this year since investors will be torn between fretting about the potential for much higher bond yields (Ackman’s scenario) or a recession after all (Rosenberg’s outlook).
US Inflation: Unit Labor Costs Still Moderating. Debbie and I believe that inflation will continue to moderate and might very well reach the Fed’s goal of 2.0% by 2025. Fed officials consistently have said that’s their game plan. None of them have said that they expect to get there this year or even next year. The FOMC’s latest Summary of Economic Projections issued on June 14 showed that the committee’s median forecast of the core PCED inflation rate was 3.9% this year, 2.6% next year, and 2.2% in 2025. This rate was 4.1% in June.
Yet when Friday’s employment report showed that average hourly earnings (AHE) for all workers rose 4.4% in July, the same as in June, that pace was deemed by several commentators to be inconsistent with the Fed’s 2.0% target for the PCED. That’s true, but the target is for 2025, not for this year. Wages growing at 3.0% would be more consistent with 2.0% price inflation, assuming that productivity growth is around 1.0%. That’s a realistic scenario by 2025, in our opinion.
Now let’s have a closer look at the latest batch of labor compensation indicators to assess whether they are moving in the right direction, i.e., downwards:
(1) Average hourly earnings (AHE). AHE for all workers rose 0.4% m/m in July for the third time in four months, following three consecutive months of 0.3% gains. Nevertheless, the trend is still down for this measure of wage inflation on a y/y basis. It peaked at 5.9% last March, falling to 4.4% in July (Fig. 12).
AHE for production and nonsupervisory workers covers about 80% of payroll employment. This set of workers includes all the lower-wage workers, who have been getting bigger pay increases than higher-wage workers. This measure of wage inflation peaked at 7.0% last March and was down to 4.8% during July. During July, all workers were paid $33.74 per hour on average, while higher-wage workers received $54.80 and lower-wage workers received $28.96. While AHE for all workers rose 4.4% y/y, the averages for the higher and lower paid workers rose 3.3% and 4.8% respectively (Fig. 13).
Here are July’s y/y increases in AHE for all workers versus their recent highs: leisure & hospitality (5.6 from 14.0), education & health services (2.9 from 7.3), information (3.8 from 7.7), retail trade (4.0 from 6.7), professional & business (4.6 from 7.1), natural resources (4.8 from 7.1), and transportation & warehousing (4.9 from 7.0). Wage inflation rates for financial activities, utilities, and construction are moving sideways, the latter around recent highs, while rates for manufacturing and wholesale trade have moved higher recently, though the latter looks toppy (Fig. 14).
(2) Employment cost index (ECI). During Q2, wages and salaries in the ECI rose 4.6%, about the same as the 4.4% increase in the AHE for all workers and 4.8% for lower-wage workers (Fig. 15). The overall ECI including wages, salaries, and benefits rose 4.5% during Q2 (Fig. 16).
The recent increase in labor unrest among union workers reflects the fact that their overall ECI rose 3.6% y/y through Q2, below the 4.5% increase in the compensation paid to nonunion workers. The former’s pay gains have been lagging the pay of nonunion workers since mid-2021 (Fig. 17).
(3) Hourly compensation (HC). HC is the most inclusive measure of hourly compensation and the most volatile (Fig. 18 and Fig. 19). It is also the measure used by the Bureau of Labor Statistics to calculate unit labor costs (ULC). On Thursday, we learned that HC rose 3.7% y/y during Q2 while productivity increased 1.3%, so that ULC rose 2.4%, down from last year’s peak of 7.0% during Q2-2022.
The headline CPI and ULC inflation rate, both on a y/y basis, are highly correlated (Fig. 20). Both have plunged from high to low single digits over the past year.
(4) Wage Growth Tracker (WGT). The Atlanta Fed’s WGT (using the three-month smoothed series) tends to be less volatile than the AHE measure. That’s because the latter doesn’t adjust for swings in employment between lower-wage and higher-wage industries, which had a huge impact on AHE during the pandemic when the former lost lots more jobs than the latter. That gave a big boost to AHE in 2020 that was reversed in 2021 (Fig. 21).
The WGT rose 5.6% y/y during June, which is the highest reading of the four wage inflation measures. On a three-month smoothed basis, it shows that wage inflation since the start of the pandemic was boosted by job switchers who quit their jobs for better pay elsewhere (Fig. 22). The good news is that the WGT for job switchers fell from a peak of 8.5% last July to 6.1% this June.
That’s because the quit rate for private industry peaked last year at 3.3% during April and fell to 2.7% during June. It tends to be a very good six-month leading indicator of wage inflation (Fig. 23 and Fig. 24).
Movie. “The Beanie Bubble” (+ + +) (link) is a very colorful and entertaining flick about yet another bubble, the 1990s Beanie Babies craze. So it is another toy story movie similar in some ways to the recently released “Barbie.” Both appeal to the audience’s nostalgia for the toys they played with growing up. But it is also another cautionary tale about speculative excess and corporate hubris. The Ty company that sold the toys created “artificial scarcity” for them by regularly discontinuing certain babies and even producing a few with defects. The company was also among the first to have a website and to use social media to boost sales. Interestingly, eBay owes its early success to Beanie Babies auctions, as collectors flocked to acquire the limited editions, with some going for thousands of dollars. Sales were so big that eBay was required by the SEC to list the babies as a “risk factor” when they went public in 1998. The Beanie bubble burst in 1999.
Oil, Cat & Flying Cars
August 03 (Thursday)
Check out the accompanying pdf and chart collection.
Executive Summary: With US economic growth so strong and OPEC so disciplined, oil inventories are rapidly depleting. The surpluses that have tethered global oil prices over the past year will disappear next year as consumption overtakes production, forecasts the EIA. Jackie examines the reasons and the recent performance of the S&P 500 Energy sector and its component industries. … Also: The US economy’s vitality was evident in Caterpillar’s remarkable Q2, a testament to the strength of demand for building new homes, mining minerals, and constructing factories. … And in our Disruptive Technologies segment: Will cars ever fly?
Energy: Oil Deficits. The price of crude oil has risen in recent months as investors have grown more confident that the US economy will dodge a recession. The Brent crude futures price is up to $84.91 a barrel from its recent low of $72.26 on June 27 (Fig. 1). The past year’s crude oil surpluses—which have kept the world’s fuel prices in check—will become deficits this quarter and continuing through next year if estimates by the US Energy Information Administration (EIA) are on target.
Here are the EIA’s quarterly production and consumption forecasts for the global oil market in 2023 and 2024: Q1-2023 (101.04 mbd production, 100.06 mbd consumption), Q2-2023 (101.13, 100.96), Q3-2023 (100.77, 101.75), Q4-2023 (101.45, 101.83), Q1-2024 (101.90, 102.32), Q2-2024 (102.08, 102.38), Q3-2024 (102.95, 103.29), and Q4-2024 (103.34, 103.22).
The EIA’s oil production and consumption estimates no doubt reflect the more-resilient-than-expected US economy, the weaker-than-expected Chinese economy, and OPEC’s disciplined adherence to production cuts. Let’s take a closer look at these dynamics:
(1) The recession that never arrived. The US economy grew 2.4% in Q2, defying naysayers’ dour projections (Fig. 2). All that economic activity boosted oil demand more than expected, which depleted oil inventories at a record-breaking pace last week. US oil inventories fell by 17 million barrels in the week ending July 28, according to EIA data cited in an August 2 Reuters article. It was the largest weekly drop in US crude inventories ever recorded (record taking began in 1982).
Recent market conditions have prompted the Biden administration to pull its offer to buy 6 million barrels of oil as it attempts to refill the Strategic Petroleum Reserve. The administration released 180 million barrels from the reserve last year after the price of oil spiked in reaction to Russia’s invasion of Ukraine (Fig. 3). Only 6.3 million barrels has been replaced, but the administration has said it will buy oil for the reserve when it costs between $67 and $72 a barrel.
Meanwhile, oil demand in China continues to grow even though its economic growth isn’t as strong as expected. Instead of booming after Covid restrictions were lifted, Chinese economic growth has disappointed, burdened by high youth unemployment and real estate companies’ excessive leverage. Chinese GDP grew 6.3% y/y in Q2, faster than Q1’s rate of 4.5% y/y but below the consensus forecast of 7.3% y/y growth.
While China’s economic growth has been slower than expected, its consumption of oil and other liquids is still expected to grow to 16.13mbd in Q2-2023, up from 15.94mbd in Q1-2023 and 15.10mbd in Q2-2022, the EIA forecasts.
(2) OPEC gets religion. OPEC’s Joint Ministerial Monitoring Committee is scheduled to meet today. The organization’s crude production fell by 0.9mbd in July to an average of 27.8mbd, according to a Bloomberg survey cited in an August 1 Oilprice.com article. The production reduction includes Saudi Arabia’s voluntary cut of 1mbd. The country reportedly wants to see the price of crude oil at $90 a barrel or more before starting to unwind its oil production cut.
Production also fell in Nigeria, by 130,000bpd, because Shell suspended loadings of crude due to a potential leak at the export terminal. Libya’s production fell by 50,000bpd due to a protest at a field.
(3) Signs of life. Energy stocks had a tough start to 2023 as the price of oil tumbled. But since oil prices hit a low for the year in early June, the sector and its industries have enjoyed a strong rebound. Here’s the performance derby for the S&P 500 and its 11 sectors from June 1 through Tuesday’s close: Industrials (14.7%), Materials (14.0), Energy (13.7), Consumer Discretionary (13.4), Financials (11.5), S&P 500 (9.5), Information Technology (9.4), Communication Services (9.2), Real Estate (5.9), Health Care (4.5), Consumer Staples (4.4), and Utilities (2.6) (Table 1).
The rebound among a handful of industries in the S&P 500 Energy sector over the same period is even more impressive: Oil & Gas Equipment & Services (34.3%), Oil & Gas Refining & Marketing (24.0), Oil & Gas Exploration & Production (18.5), and Oil & Gas Storage & Transportation (15.8). The S&P 500 Oil and Gas Refining and Marketing industry’s stock price index is near a record high even though analysts are calling for the industry’s earnings to fall by 26.9% this year and 29.4% in 2024 from record levels (Fig. 4).
The S&P 500 Oil & Gas Equipment & Services stock price index is near its highest level since the Covid pandemic descended and sent oil prices tumbling in late 2019 and into 2020. Analysts expect the industry will post strong earnings growth of 43.2% this year and 21.5% next year (Fig. 5). Meanwhile, earnings for the S&P 500 Oil & Gas Exploration & Production industry are forecast to drop sharply this year, by 34.8%, and then grow 20.7% in 2024 (Fig. 6). All three industries have forward P/Es below that of the S&P 500: Oil & Gas Refining & Marketing (8.2), Oil & Gas Exploration & Production (11.2), and Oil & Gas Equipment & Services (15.8).
Industrials: Lessons From the Cat. Caterpillar’s Q2 earnings illustrate the power of three important trends: the demand for more new homes, the demand for more minerals, and the push to bring manufacturing back to the US. Each requires the yellow earth-moving equipment that Caterpillar manufactures.
The company reported Q2 sales that jumped 22% to $17.3 billion and operating income that surged 88% to $3.7 billion, far exceeding analysts’ expectations. The company’s shares jumped 8.9% on Tuesday in response, to $288.68, bringing their ytd gain through Tuesday’s close to 20.5%. Earnings growth is expected to continue next year, but much more slowly. Analysts expect the company, which earned $12.64 a share in 2022, to grow earnings per share by 52.6% this year to $19.29 and 4.6% next year to $20.18.
Caterpillar’s growth in both revenues and earnings was amazingly broad based, bolstering each of its segments: construction industries (19% revenues, 82% operating profits), resource industries (20, 108), and energy & transportation (27, 93). Let’s take a look at what Caterpillar management said drove its success last quarter:
(1) Thank Uncle Sam. Revenue in Caterpillar’s construction industries segment was helped by the strong markets for new homes and new factories in the US. The segment’s North American sales jumped 32%, eclipsing the 20% jump in Europe, Africa & the Middle East, the flat results in Asia, and the 11% decline in Latin America.
In the company’s Q2 earnings conference call, CEO James Umpleby credited strong demand for equipment in the residential construction market and in the non-residential construction market, which continues “to benefit from government-related infrastructure and construction projects.” Those projects are also boosting demand for heavy equipment used in quarries and to mine aggregates. The impact of these infrastructure projects should “last for some time,” as some projects wait for permits to come through before they can even break ground.
(2) Thank EVs. The demand for materials used in batteries, like cobalt and lithium, has sent geologists scouring the Earth to find new sources for the minerals. Benchmark Mineral Intelligence studied how many new mines would be needed to ensure adequate materials for the batteries to be used over the next decade. “The group’s study found that at least 359 new mines and similar facilities could be needed to meet the demand expected for these materials by 2035, though that number could easily rise to 384. This would include 74 mines for lithium, 62 mines for cobalt, 72 mines for nickel, 97 mines for natural graphite and 54 plants for producing synthetic graphite. If manufacturers are able to make better use of recycled materials, the number shrinks slightly—but only to 336 [mines],” according to a September 19, 2022 article in the Robb Report.
Caterpillar’s Umpleby sees demand for EV-related minerals driving growth for Cat equipment: “We continue to believe the energy transition will support increased commodit[ies] demand, expanding our total addressable market and providing further opportunities for profitable growth.”
(3) Energy and turbines help too. Caterpillar is less well known for the products and services it supplies to the oil and gas industry and the gas-powered turbines used by a variety of industries, including data centers; but this segment also had a great Q2, with total sales jumping 27% y/y and operating profit increasing 93% y/y.
(4) Comps get tougher. While revenue is expected to grow, CFO Andrew Bonfield did point out that y/y comparisons during H2-2023 will be tougher because the company started raising prices in Q3-2022 and continued to do so in the ensuing quarters. For example, last quarter sales volume boosted revenue by $1.8 billion in the company’s three equipment operating segments, and price increases boosted revenue by almost as much: $1.4 billion.
Management expects price increases to slow during H2-2023 and the operating margin improvements of the past year to halt as well. That said, the company is sitting on a healthy order backlog of $30.7 billion, up $300 million q/q.
(5) Supply chain still healing. While Caterpillar’s supply chain has improved, Umpleby noted that there are still “challenges.” “We’re still dealing with supply chain constraints around large engines, which impact both E&T and machines. And we also have some issues with things like semiconductors for displays that are impacting other machines as well,” said Umpleby. As a result, the company keeps more inventory on hand than it might otherwise. When the supply chain returns to normal, Caterpillar should be able to reduce its inventory and free up additional cash.
Disruptive Technologies: Still Working on Flying Cars. When we wrote about flying cars in a 2018 Morning Briefing, inventors were excited about a future filled with vehicles that could allow us to bypass traffic jams like George or Jane Jetson. Five years later, and the topic of flying cars still leaves inventors breathless, but their inventions have yet to hit the market. Some projects have crashed, and others have faded away. But entrepreneurs are still plugging away at making the flying car a reality within the next few years.
Let’s take a look at some of these initiatives:
(1) Some throw in the towel. Kittyhawk, backed by Google co-founder Larry Page and Boeing, wound down its attempts to build air taxis last fall. Likewise, Uber had grand plans to test its flying taxi by 2020 and start commercial flights this year, plans that never materialized.
Under pressure to cut costs, Uber sold the division in 2020 to Joby Aviation, which is working to get a flying vehicle approved. Joby is developing an eVTOL, an electric vertical take-off and landing vehicle, which is closer to a helicopter alternative than a flying car. In June, Joby received a Federal Aviation Administration (FAA) Special Airworthiness Certificate, which allows testing of its prototype. By March 2024, the company aims to deliver two of the aircraft to the US Air Force, and it hopes to begin commercial operation in 2025. Joby, which counts Toyota as an investor, plans to operate the vehicles itself and offer customers ridesharing services.
Another company we mentioned in 2018, Opener, has forged ahead on developing its single-seat BlackFly eVTOL. The vehicle, which doesn’t have wheels, is undergoing testing by qualified owners before the company opens sales to the general public. And Archer Aviation announced last week a contract with the US Air Force worth up to $142 million that includes supplying up to six of its Midnight eVTOL air taxi planes once they’re certified, a July 31 article in DroneDJ reported.
(2) Closer to a flying car. Alef Aeronautics has developed a vehicle that looks more like a flying car than a helicopter. The company’s two-seat Model A drives on roads and can take off and land vertically. The electric vehicle can drive for 200 miles—but only at a maximum speed of 25 miles per hour—and fly for 110 miles, a July 5 Electrive article reported.
The Model A has also received a FAA Special Airworthiness Certificate, but it still needs approval from the National Highway Traffic Safety Administration to be tested on public roads. The company has received 2,500 preorders for its $300,000 two-seat model, which it plans to deliver in late 2025, a July 29 Newsweek article reported. The company is also working on a four-person vehicle and hopes that drivers won’t be required to have a pilot’s license to operate the vehicle.
(3) One more flying car. The Asaka A5 looks less like a car than Alef’s model, but it too has wheels that allow the vehicle to drive on a road and park in a standard parking spot. However, when the operator wants to fly, wings unfold and allow the vehicle to take off and land either vertically like a helicopter or horizontally on a runway like a traditional airplane. The A5 is a gas/electric hybrid that can fly for 250 miles at 150 miles per hour or drive at up to 70 miles per hour, a July 30 Freethink article reported.
The A5’s faster speed and longer range comes with a higher price tag: $789,000. Asaka also plans to rent the A5 to pilots in 2026. The Department of Motor Vehicles is allowing the vehicle to drive on public roads, and the FAA gave the company’s prototype a Special Airworthiness Certification.
(4) Lots of competition. Hopeful market entrants include companies based abroad as well. In Germany, Lilium and Volocopter are developing vehicles. In the UK, Vertical Aerospace received a $25 million investment from American Airlines Group last year. Eve Air Mobility was created by Brazil’s Embraer and plans to produce a four-seat eVTOL in Brazil. United Airlines announced plans for a San Francisco commuter service using Eve Air’s planes and has invested $15 million in the company.
China’s battery manufacturer CATL entered a joint venture with government-owned aircraft manufacturer Commercial Aircraft Corp. of China and the Shanghai Jiao Tong University Enterprise Development Group to develop a battery powered aircraft. It’s not an eVTOL but rather a fixed-wing electric aircraft. And in France, AutoFlight and Airport operator Groupe ADP announced plans to fly passengers around Paris during next year’s Summer Olympics.
Global Smorgasbord
August 02 (Wednesday)
Check out the accompanying pdf and chart collection.
Executive Summary: While the economies of China and the Eurozone countries have been lethargic, with a contracting M-PMI in China and declining industrial sentiment in the EU, the US economy has been anything but. The Atlanta Fed’s GDPNow model shows Q3 GDP growth tracking at 3.9%. We’re increasingly confident about our no-landing/rolling-recovery outlook over the next 18 months, to which we ascribe 85% subjective odds. … Also: S&P 500 forward earnings continues to recover. … And Joe reports reassuring takeaways from recently released July data on analysts’ estimate revisions for earnings and revenues.
Global Economy: Fizzling. Tourists sightseeing in Europe in recent weeks have had to do so in sweltering heat. On the other hand, the European economy has been not so hot. Also lackluster has been China’s economy. Meanwhile, the US economy continues to surprise on the upside. It all adds up to a global economy that is growing but at a subdued pace. Let’s start with a quick tour of China and Europe before coming back stateside:
(1) China’s PMIs weakening. China’s official M-PMI rose slightly to 49.3 last month, remaining below the 50.0 mark that separates expansion from contraction for the fourth month in a row (Fig. 1). The NM-PMI, which measures activity in the services and construction sectors, eased to 51.5 (Fig. 2). A subindex focused on services also declined to 51.5, from June’s 52.8.
New manufacturing export orders continued to decline, with the subindex inching down to 46.3 from 46.4 in the previous month. A manufacturing employment subindex remained in contraction for a fifth straight month. A subindex measuring nonmanufacturing employment edged down to 46.6 from 46.8 in the previous month.
Government officials have promised to implement measures to stimulate consumption. On Friday, the government announced a slew of initiatives to help industries in home goods, food, plastic products, leather, and other industries.
(2) Europe’s ESIs & PMIs falling. The European Union’s economic sentiment index (ESI) fell further below 100.0, to 93.6, in July (Fig. 3). It has been below 100.0 since July 2022. So has the Eurozone’s ESI, which declined to 94.5 in July. Leading the weakness in the Eurozone’s ESI has been its industrial component, while the consumer component has been rebounding since late last year because a milder-than-expected winter and plenty of natural gas calmed concerns about freezing in the dark.
Germany has been leading the downturn in the Eurozone’s ESI for the industrial sector (Fig. 4). The same can be said for the Eurozone’s M-PMI, which was down to 42.7 in July, with Germany’s index down to 38.8 (Fig. 5). The Eurozone’s NM-PMI has also been falling in recent months but remained above 50.0 in July, at 51.1, with France’s measure falling to 47.4 (Fig. 6).
(3) Euro-based CESI is down and out. Confirming the weakness of the Eurozone economy is the euro-based Citigroup Economic Surprise Index. It has been hovering below 100.0 since February 7 and is well below the neutral reading of 0.0 (Fig. 7). It’s showing the lowest readings since early 2020 when the pandemic started.
(4) Our Global Growth Barometer upticks. Meanwhile, our Global Growth Barometer (GGB) has rebounded slightly in recent days, as both the Brent price of oil and the CRB raw industrials spot price index have moved higher (Fig. 8 and Fig. 9). However, the increase in the price of oil may have more to do with less supply than with more demand. On July 31, Reuters reported: “OPEC oil output has fallen in July after Saudi Arabia made an additional voluntary cut as part of the OPEC+ producer group’s latest agreement to support the market and an outage curbed Nigerian supply.”
US Economy: Sizzling. While the rest of the world is fizzling, the US economy is sizzling. For the past year and a half, we have been in the soft-landing camp. We’ve promoted the “rolling recession” scenario. Now it’s looking increasingly like a no-landing and rolling recovery scenario for the next year and a half. We turned more optimistic on Monday by assigning 85% subjective odds to this scenario and only 15% to a hard landing one. Previously we had been at 75/25.
Let’s review the latest US economic indicators, which indicate that all is well in the US economy:
(1) CESI is hot. The Citigroup Economic Surprise Index (CESI) for the US rose to 76.1 on July 31 from this year’s low of 24.7 on January 18 (Fig. 10). The spread between the US CESI and Eurozone CESI is 192.1 (Fig. 11).
(2) M-PMI bottoming. The M-PMI has been below 50.0 since November (Fig. 12). We think that it has been reflecting the rolling recession that has depressed goods producers and distributors, as consumers pivoted from buying goods to purchasing services since mid-2021. We think that the recession is bottoming, as evidenced by the bottoming of the M-PMI around 45.0 in recent months. It ticked up to 46.4 during July.
(3) Construction is booming. Construction spending rose to a record high in June (Fig. 13). Private residential construction actually rose 3.8% during the two months through June, having posted only three gains since it peaked at a record high last May (Fig. 14). Private nonresidential construction was flat in June following a 0.8% decline in May from April’s record high, reflecting a pause in the vertical ascent in construction of manufacturing facilities. Public construction edged up to a new record high, led by record spending on water supply, sewage, and waste disposal. (See our Construction Spending chart book.)
(4) Lots of job openings again. The labor market continues to provide lots of job openings. The number of available positions declined to 9.6 million in June according to the JOLTS report. That is the lowest since April 2021, but it remains elevated. Odds are good that it remained so during July according to the “jobs plentiful” series included in the Conference Board’s consumer confidence survey (Fig. 15).
The decline in openings was led by goods-producing sectors such as manufacturing, while several service industries, including health care and arts and entertainment, registered increases. The ratio of openings to unemployed people was little changed at 1.6 in June. Prior to the pandemic, it was about 1.2.
(5) SLOOS is not loose. The Fed’s latest Senior Loan Officer Opinion Survey, or SLOOS, was released on Monday. It showed that banks reported having tighter credit standards and seeing weaker loan demand from both businesses and consumers. Banks expect to tighten their lending standards further over the rest of 2023 as well. So far, there’s no evidence in the Fed’s weekly report on commercial banks’ balance sheet suggesting that an economy-wide credit crunch is underway.
(6) GDPNoW is WOW! The earliest read on Q3’s GDP was a whopping 3.5% on July 28, according to the Atlanta Fed’s GDPNow tracking model. The estimate was raised to 3.9% on August 1. It’s too soon to place much faith in these numbers. But they are certainly consistent with our more optimistic no-landing outlook for the economy.
US Strategy I: Earnings Looking Up. The current earnings reporting season for the S&P 500 showed an uptick in the Q2 blended number of actual and estimated results during the July 27 week (Fig. 16). More importantly, the Q3 and Q4 estimates stopped falling during the final week of July. Even more significant is that the S&P 500’s forward earnings continued its recovery, which started earlier this year (Fig. 17). Industry analysts are currently estimating that operating earnings per share will be $245.15 next year, up 12.5% from this year’s $217.83 estimate.
US Strategy II: Mostly Positive Revisions. Last week, Refinitiv released its July snapshot of the monthly consensus estimate revisions activity over the past month. While Refinitiv provides raw data for all its polled measures, we focus primarily on the revenues and earnings forecasts, as shown in our Stock Market Indicators: Net Revenue & Earnings Revisions By Sectors report. There, the analysts’ revisions activity is indexed by the number of forward earnings estimates up less number of estimates down, expressed as a percentage of the total number of forward earnings estimates. We look at their activity over the past three months because it encompasses an entire quarterly reporting cycle, which is less volatile (and misleading) than a weekly or monthly series.
July’s reading comes at the beginning of the Q2 earnings reporting cycle, when revisions activity typically pauses as analysts wait to see how actual results for the quarter compare with their forecasts before revising their annual estimates. The pause follows a long period of mostly downward revisions through April, when analysts began to realize that instead of a deep recession, there would be a mid-cycle slowdown with negative y/y quarterly growth comparisons due to very strong results and pricing power a year earlier.
Below, Joe highlights notable points after analyzing the July estimate revisions data:
(1) S&P 500 NERI back on positive footing. The S&P 500’s NERI index measures the net revisions activity for earnings forecasts; a zero reading indicates an equal number of raised and lowered estimates over the past three months. NERI improved for a fourth straight month in July and edged even higher into positive territory. It rose to a 14-month high of 1.3% from 0.6% in June. July’s release is up from a 30-month low of -15.6% in December and is well above the average reading of -2.2% seen since March 1985 (when NERI was first calculated).
(2) More than half of sectors now have positive NERI. Seven of the 11 S&P 500 sectors registered positive NERI in July, up from six in June and zero in March and April. Six sectors improved m/m, down from all 11 improving m/m in May. But May was unusual in this regard: There was a flurry of upward earnings revisions as analysts scrambled to raise forecasts following broad-based Q1 earnings strength—in fact, May saw the broadest earnings improvement among the sectors since July-September 2020. June’s improvement continued in July, when six of the 11 sectors reached their highest NERI readings in at least nine months. Among them, Communication Services turned positive for the first time in 21 months. Energy and Financials both remained on lengthy negative NERI streaks, at 13 and 12 months, respectively.
Here’s how NERI ranked for the 11 S&P 500 sectors in July: Industrials (9.3%), Consumer Discretionary (8.6, 21-month high), Information Technology (4.1, 14-month high), Communication Services (3.5, 21-month high), Real Estate (3.3, 12-month high), Health Care (1.8), Consumer Staples (1.7), S&P 500 (1.3, 13-month high), Utilities (-0.7), Financials (-7.0, 12-month high), Materials (-7.5), and Energy (-17.9).
(3) S&P 500 NRRI index for revenues still positive and stabilizing. The NRRI index, which measures the revisions activity in analysts’ revenue forecasts, ticked down for the S&P 500 to 3.5% in July from 3.7% in June but was positive for a sixth straight month. That’s still above the average reading of -0.2% when NRRI data were first compiled in March 2004.
(4) NRRI index positive for seven sectors now. NRRI’s m/m performance was a tad weaker than the NERI index’s by one measure: Just five sectors had NRRI readings improve m/m, versus six with improving NERI. However, seven sectors registered positive NRRI during the month, with three standouts leading the way: Communication Services, Information Technology, and Real Estate all posted their highest NRRI readings in at least nine months. Notably, Tech’s was positive for the first time in 13 months. Of the 11 sectors, only Energy and Materials have still-depressed NRRI readings.
Here’s how the S&P 500 sectors’ NRRI readings ranked in July: Utilities (12.5%), Real Estate (10.2, 9-month high), Industrials (9.9), Health Care (9.7), Consumer Discretionary (8.9), Consumer Staples (7.3), S&P 500 (3.5), Information Technology (2.0, 14-month high), Financials (-1.1), Communication Services (-7.0, 15-month high), Materials (-13.4), and Energy (-21.4).
Mostly All About Inflation
August 01 (Tuesday)
Check out the accompanying pdf and chart collection.
Executive Summary: Rates of inflation are a function of the business cycle as well as the monetary cycle, and there tends to be symmetry to their ascents and descents, especially for goods inflation. … The latest bout of high inflation was triggered by demand shocks resulting from the pandemic, which led to supply shocks, aggravated by the Ukraine war. … Since last summer, however, inflation in the US has been on a disinflationary trend. Deflation in China’s PPI suggests that the US could experience immaculate disinflation, i.e. lower inflation without a recession.
Weekly Webcast. If you missed Monday’s live webcast, you can view a replay here.
Inflation I: Symmetry & Shockwaves. Inflation tends to be a symmetrical phenomenon. It tends to come down as quickly or as slowly as it went up when measured on a y/y basis. We can see this consistent pattern in the CPI inflation rate for the US since 1921 (Fig. 1). The inflation symmetry has been particularly pronounced in the goods-producing sector (Fig. 2).
That’s because goods prices tend to respond quickly to changes in supply and demand caused by price changes. Rising (falling) prices of goods, especially of commodities, tend to dampen (boost) demand while stimulating (depressing) supply. Prices in the services-providing sector tend to be stickier because labor costs tend to be more important there than among goods-producing industries, which are less dependent on labor thanks to productivity-enhancing innovations. Nevertheless, the CPI inflation rate in services has also been relatively symmetrical since the start of the monthly data in 1957.
The boom-and-bust business cycle plays a role in the symmetry of inflation; inflation typically accelerates during the later stage of booms and moderates during busts. Monetary policy plays an important role in the inflation cycle as central banks fall behind the inflation curve during economic expansions, thus boosting inflation. They then scramble to get ahead of the inflation curve by aggressively tightening monetary policy, which triggers recessions.
That’s a simple and stylized description of the relationship of the inflation cycle to the business and monetary cycles. Ever since Milton Friedman taught us all during the 1970s that inflation is always and everywhere a monetary phenomenon, experience has taught us that lots of other factors besides monetary policy also influence inflation. In fact, Friedman later clarified that he was referring to episodes of persistent inflation. In the short run, he acknowledged that supply shocks can impact price levels.
Indeed, our central thesis since inflation reared its ugly head in 2021 and 2022 has been that the high rates of inflation were triggered by various supply shocks attributable mostly to the pandemic and to the Russian invasion of Ukraine. In the March 16, 2022 Morning Briefing, we wrote: “Debbie and I raised our inflation forecast as a result of the Ukraine crisis. We now expect that the core PCED inflation rate will peak at 6.0%-7.0% around mid-year and fall to 4.0%-5.0% by the end of the year. Then it might decline to 3%-4% in 2023, maybe.”
More recently, in the July 17 Morning Briefing, we wrote: “The CPI inflation rate for goods has turned out to be transitory, peaking last summer and falling to -1.2% y/y, with the CPI durable and nondurable goods down 0.8% and 1.3% respectively during June. Inflation has been one of the shockwaves unleashed by the pandemic that is abating. Excessively stimulative fiscal and monetary policies during the pandemic resulted in a buying binge for goods that overwhelmed global supply chains, as can be seen in the New York Fed’s Global Supply Chain Pressure Index. This index soared from 0.11 during October 2020 to 4.31 during December 2021. It was down to -1.20 during June.” We added that services inflation, particularly rent inflation, would also turn out to be transitory.
Inflation this time around has been attributable to supply shocks that were exacerbated by demand shocks. In our opinion, the inflationary pandemic-related shockwaves should continue to moderate through next year without an economy-wide recession.
Inflation II: Global Perspective. The latest inflation cycle was certainly attributable to a demand shock that occurred when fiscal and monetary authorities provided excessively stimulative policies during 2020 and 2021. They triggered a goods-buying binge that caused durable goods inflation to soar. Russia’s invasion of Ukraine early last year caused nondurable goods inflation to soar, led by energy and food prices.
The demand shock caused a supply shock. Supply-chain disruptions proliferated around the world, as evidenced by the New York Fed’s Global Supply Chain Pressure Index, mentioned above (Fig. 3). Supply chains are working properly again, and the US and Eurozone increasingly are importing goods deflation from abroad. Consider the following:
(1) The US import price index is down 6.1% y/y through June (Fig. 4). Excluding petroleum imports, the index is down 2.0%. The US import price index from newly industrialized economies in Asia (Hong Kong, Singapore, South Korea, and Taiwan) is down 6.2% y/y, while the comparable China index is down 2.3% (Fig. 5).
(2) China’s CPI was flat over the past year through June, while its PPI for industrial products was down 5.4% y/y (Fig. 6). China’s PPI inflation rate tends to be a coincident indicator of PPI goods inflation in the US and the Eurozone, which were down 2.8% and 1.5% in June (Fig. 7 and Fig. 8).
A global perspective shows that China’s lackluster economic recovery from last year’s pandemic lockdowns, which were lifted in early December, is having a deflationary impact on goods markets around the world. This suggests that the US and the Eurozone can experience disinflation in the goods sector without a recession. This still leaves the question of inflating services prices.
(3) The Eurozone’s headline CPI inflation rate fell to 5.3% in July based on the flash estimate, down from a peak of 10.7% in October 2022 (Fig. 9). However, the core rate edged up to 5.5%, not much below its recent peak of 5.7% in March. The CPI for goods was down to 5.5% from a peak of 15.1% in October 2022 (Fig. 10). The CPI service inflation rate rose to a new high of 5.4% for the current inflation cycle (Fig. 11).
Inflation III: Disinflating Prices. In the United States, both June’s CPI and PCED inflation rates continued to confirm their disinflationary trends since last summer for goods. Services inflation has been stickier but should be less so over the rest of this year. Consider the following:
(1) July’s prices-paid and prices-received indexes for the US regional surveys conducted by five of the Federal Reserve district banks flattened in July but are down sharply from last year’s highs and the lowest since late 2020 (Fig. 12). Odds are good that the national M-PMI prices-paid-index (which is correlated with the comparable regional index) remained below 50.0 in July (Fig. 13).
(2) June’s PCED inflation rate for goods was down to -0.6% y/y from last year’s peak of 10.6% in March and June (Fig. 14). The services price component remained sticky, declining to 4.9% from a recent peak of 5.8% in February.
The good news is that rent inflation, which is a major component of the PCED services inflation rate, is likely to head lower at a faster pace in coming months. Rent inflation in the PCED, including both rent of primary residence and owners’ equivalent rent, edged down to 8.0% in June from a recent high of 8.4% in April (Fig. 15). It lags behind measures of rent on new leases such as the Zillow Index and the ApartmentList Index, which were down to 4.1% in June and -0.7% in July, respectively.
Other components of the PCED inflation rate are showing some stickiness, such as personal care (10.2%) and recreation (4.7%). But transportation services inflation has dropped to 3.6% from 16.3% in January of this year (Fig. 16). Remaining low are communication services (-0.5%), health care (2.2%), and education (2.5%).
The Godot Recession
July 31 (Monday)
Check out the accompanying pdf and chart collection.
Executive Summary: We’re raising the subjective odds we assign to the no-landing economic scenario through year-end 2024 (by 10% to 85%) and lowering our odds of a hard landing (by 10% to 15%). But we’re keeping close tabs on hard-landers’ latest arguments. Today, we summarize the main ones and give our rebuttals. … The biggest issue dividing the two camps is the outlook for consumer spending, representing over two-thirds of nominal GDP. If consumers don’t pull back on spending once their pandemic-related savings run out, an economy-wide recession would be a stretch. We say they won’t retrench, having other sources of purchasing power. ... And: Dr. Ed reviews “Barbie” (+).
YRI Weekly Webcast. Join Dr. Ed’s live webcast with Q&A on Mondays at 11 a.m. EST. You will receive an email with the link one hour before showtime. Replays of the weekly webcasts are available here.
US Economy I: The Honorable Opposition. There was no sign of a recession in Q2’s real GDP. Yet Vladimir and Estragon are still waiting for Godot to show up. The hapless hard-landers have been frustrated so far, but they aren’t giving up. In their opinion, a recession is still coming. Debbie and I have argued since early last year that the recession has already made its entrance on stage, but as a rolling recession relatively unnoticed rather than a dramatic economy-wide recession. Now that rolling recession is changing into a rolling recovery.
Our script has played out as expected so far. The soft-landing scenario looks increasingly like a no-landing one. As a result, we are raising the odds of a no-landing scenario from 75% to 85% and lowering the odds of a hard-landing scenario from 25% to 15% through the end of next year.
Nevertheless, now that we are even more optimistic about the economic outlook, it’s even more important to remain on the lookout for that troublesome and elusive Godot. Last week, we discussed two items on our worry list—namely, the vulnerabilities in the commercial real estate market and the ongoing push by unions for higher wages, which could cause another wage-price spiral and force the Fed to keep tightening.
To make sure that we are covering all the bases, we are closely following the warnings of a few of the leading bears. Here is what they are currently saying:
(1) The strategists at JP Morgan rightly caution that the tightening of monetary policy in the US can have a long and variable depressing impact on the economy. The worst may still be ahead. They predict that once excess savings accumulated during the pandemic are depleted, consumers will be forced to retrench. They also observe that the global geopolitical situation remains “deeply troubling.” They attribute the stock market rally to a handful of stocks that have been driven up by AI-hype. They conclude that “the level and increase of stock concentration in S&P 500 now is at 60-year highs” which is “indicative of a bubble.” (See “Top JP Morgan Strategist Says the Worst May Still Be Coming,” 24/7 Wall St., July 27, 2023.)
(2) The strategists at Morgan Stanley were correctly bearish last year, but recently acknowledged that they missed calling the bottom last October. Nevertheless, their year-end 2023 target for the S&P 500 is still 3900, and their year-end 2024 target is 4200. The S&P 500 closed at 4582.22 on Friday. They are still bearish. Their concern now is that moderating inflation will weigh on the growth rates of both S&P 500 revenues and earnings. They warn, “With price being the main factor that has held sales growth above zero for many companies this year, it would be a material headwind if that pricing power were to roll over.” (See “‘We Were Wrong’: Morgan Stanley’s Wilson Offers Stocks Mea Culpa,” Bloomberg, July 24, 2023.)
(3) Our thought-provoking friend David Rosenberg at Rosenberg Research remains bearish as well. He recently opined: “There is no chance we’re having a soft landing in the context of the most pernicious tightening by the Fed since the Paul Volcker years.” He previously had warned that once consumers spend their excess savings, they’ll have to cut their spending. He frequently has observed that the drop in the Index of Leading Economic Indicators (LEI)—including the inversion of the yield curve—has an excellent track record of forecasting recessions. He also thinks that the stock market is in a “get-rich-quick” speculative bubble, as evidenced by the jump in valuation multiples. (See “The US stock market has become a ‘get-rich-quick’ scheme that’s ignoring oncoming economic pain, top economist David Rosenberg says,” Yahoo! Finance, July 26, 2023.)
(4) GMO. Jeremy Grantham, the co-founder of GMO Investments, has lowered the likelihood he sees of a market crash from an earlier prediction of 85% to 70% now. He also thinks the jury is still out on the severity of the crash and how much it will impact the economy and profit margins. He attributes the current market bubble to the AI craze, which has created a mini-bubble within a larger bubble. (See “Billionaire Investor Jeremy Grantham Says the AI Craze Is Delaying a Looming and ‘Epic’ Market Crash,” The Motley Fool, July 8, 2023.)
US Economy II: Our Rebuttal. We’ve spent the past year and a half debating the hard-landers. Their debate with the soft-landers and no-landers certainly isn’t over:
(1) Leading indicators. While the hard-landers use the LEI’s weakness as support for their argument, we’ve observed that the LEI on a y/y basis is highly correlated with the M-PMI, confirming that it is biased toward the goods-producing sector, which has been in a rolling recession, at the expense of the services-providing sector, which has been very strong (Fig. 1). Nevertheless, the LEI does have a good track record of calling recessions, and it is still doing so. We will rest easier when we see the LEI turning higher, signaling that the goods recession is over. If instead, consumers do retrench their spending on both goods and services when their excess savings dry up, then the LEI and the hard-landers will finally be right.
(2) Inverted yield curve. We’ve also explained that the inverted yield curve doesn’t cause recessions and doesn’t directly predict them, as commonly believed. Rather, it indicates that monetary policy is restrictive and that if it gets more so, then something will break in the financial system, leading to an economy-wide credit crunch and a recession (Fig. 2). This time has been different so far. The inverted yield curve correctly called the banking crisis that occurred for two days, March 9 and 10. But the Fed averted a credit crunch by providing an emergency bank lending facility on March 12. This time, the inverted yield curve may be anticipating that inflation will continue to moderate toward the Fed’s 2.0% target by 2025 without a recession.
(3) Credit conditions. So far, there are signs that credit conditions have tightened; but there’s no outright credit crunch, as the hard-landers think is coming. We continue to monitor the weekly data compiled by the Fed on the US commercial banking industry. The deposits of commercial banks have been falling since mid-2022 but seem to have been stabilizing in recent weeks (Fig. 3). The banks have offset the weakness in their deposits by reducing their holdings of bonds as they mature and using the proceeds to fund their loan portfolios. Their major loan categories remain on uptrends (Fig. 4).
This morning, the Fed will release its Q3 Senior Loan Officer Opinion Survey (SLOOS). It undoubtedly will show that credit conditions have continued to tighten from Q2 levels (Fig. 5). At his press conference this past Wednesday, Fed Chair Jerome Powell revealed that the next SLOOS “gives a picture of pretty tight credit conditions in the economy.” The good news: That reduces the Fed’s need to raise the federal funds rate again. The bad news: It gives the hard-landers another debating point.
(4) Liquidity. The hard-landers have been obsessed with the 3.6% y/y drop in M2 through June (Fig. 6). However, that’s after peaking at a record 26.9% during February 2021. M2 is roughly $1.0 trillion above its pre-pandemic trendline. The sum of all commercial bank deposits and all money market funds remained in record-high territory at $22.8 trillion during the July 19 week, up a whopping $5.8 trillion since the last week of February 2020, just before the pandemic (Fig. 7). Apparently, there is lots of excess liquidity available to keep the economy growing and to drive stock prices higher, notwithstanding the tightening of monetary policy!
(5) Capital spending. The hard-landers mostly have failed to recognize the stimulative impact of onshoring as manufacturing returns to the US homeland. Among the strongest components of real GDP recently has been spending on manufacturing structures. It was up 54.4% y/y during Q2 to a record high (Fig. 8). That strength has boosted new orders for construction equipment, which rose 13.5% y/y during May to the second highest reading on record (Fig. 9).
The hard-landers mostly have dismissed AI as hype. That’s probably a subject for another debate. But the facts are that software and research & development spending in real GDP rose during Q2 by 10.0% y/y and 1.0% y/y to fresh record highs (Fig. 10). The pessimists also have overlooked that new orders for nondefense aircraft are booming along with international tourism (Fig. 11).
(6) Government spending. Also missing from the hard-landers’ debating points is any acknowledgement of the fact that tighter monetary policy has been offset by looser fiscal policy. Total government spending rose 2.6% (saar) during Q2 to a record high (Fig. 12). The 12-month US federal budget deficit has ballooned from $962 billion 11 months ago to $2.3 trillion through June (Fig. 13).
Some of the widening of the deficit is attributable to the ramping up of infrastructure spending by federal, state, and local governments. Also boosting the deficit have been record-high federal outlays on net interest, exceeding $600 billion during the 12 months through June (Fig. 14). On the flip side, the high cost of interest also is stimulative when it’s paid out to consumers: The personal interest income of consumers rose to a record $1.8 trillion (saar) during June.
US Economy III: A Guide to Consumers. The biggest debatable issue dividing the hard-landers from the soft-landers and no-landers is the outlook for consumer spending. That makes sense since it accounts for just over two-thirds of nominal GDP. It’s hard to have an economy-wide recession if consumers don’t retrench.
The hard-landers think that consumers will do so once their pandemic-related excess savings are depleted. Just before the pandemic, consumers saved around $1.5 trillion on a 12-month-sum basis (Fig. 15). Over the past 12 months through June of this year, they saved at half this pace. But their excess savings likely will be all gone within the next few months, setting the stage for a consumer-led recession. That’s the key argument put forward by the hard-landers’ ace debating team.
Our narrative posits that consumers have lots of other sources of purchasing power that should continue to support their spending. One of our accounts asked us to discuss the major economic indicators we track to assess the outlook for consumer spending. We wrote two chapters on this subject in our 2018 book Predicting the Markets; we could write an entire book just on this subject. Here is a very brief guide, based on the timeline of when the key consumer-related indicators come out and our current assessments of each:
(1) Initial unemployment claims. Jobless claims data are released by the Bureau of Labor Statistics (BLS) on Thursday mornings at 8:30 am. They are highly correlated with the unemployment rate (Fig. 16). They’ve remained near previous record lows so far this year. They indicate that the labor market remained strong through the July 22 week.
(2) Consumer confidence. The Conference Board’s survey of consumer confidence is released near the end of each month and is also one of the earliest indicators of the month’s labor market conditions. Its “jobs-hard-to-get” series is highly correlated with the unemployment rate too (Fig. 17). The July reading of just 9.7% suggests that the unemployment rate remained low near June’s 3.6%. The survey’s “jobs-plentiful” series is highly correlated with the job openings series in the JOLTS report (Fig. 18). This series’ reading of 46.9% for July suggests that job openings (currently available through May) remained elevated through June and July.
(3) JOLTS. As noted above, the JOLTS report compiled by the BLS is a laggard. The report for June will come out tomorrow. Nevertheless, it includes useful data on hires, quits, and layoffs in addition to job openings. The May report shows that the labor market remained tight back then.
(4) Employment. The BIGGIE employment report is released by the BLS at 8:30 a.m. on the first Friday of each month and reflects the prior month’s labor market conditions. So July’s report will be available at the end of this week. It is the first of the four components of the Index of Coincident Economic Indicators (CEI) available for each month and provides clues to their likely readings.
For example, every month, we use the payroll employment data to calculate our Earned Income Proxy (EIP) for private-sector wages and salaries in personal income, which is a CEI component. Our EIP has been rising to new record highs all year and has been outpacing price inflation for the past three months (Fig. 19). It reflects both total hours worked and hourly wages. On an inflation-adjusted basis, the latter has been rising for the past 12 months along its long-term trendline of 1.2% per year (Fig. 20).
(5) Retail sales. Also included in the CEI is a series for the sales of goods by manufacturers & distributors, which includes retail sales. An advance report of the latter is released by the Census Bureau about a week after the BLS employment report for the previous month. Not surprisingly, it is highly correlated with our EIP and wages & salaries in personal income (Fig. 21). However, consumers spend on both goods and services. Since mid-2021, they’ve pivoted toward spending more on services than on goods. So the weakness in retail sales since then confirmed the rolling recession in the goods-producing sector, while the service-providing sector has been strong, averting an economy-wide consumer-led recession.
(6) Personal income. Near the end of each month, the Bureau of Economic Analysis reports personal income, saving, and consumption for the prior month, as well as the personal consumption expenditures deflator. We already have some insights into the data from the employment and retail sales reports. As noted above, personal saving has been relatively low over the past year as consumers have been spending their excess savings. However, inflation-adjusted personal income has been growing along with employment and real hourly wages.
The key driver of consumption is real disposable personal income (DPI), which represents the purchasing power of consumers’ incomes after they’ve paid their taxes and received their government benefits. DPI received a big boost from pandemic relief checks paid by the government during 2020 and early 2021. It then dropped through mid-2022, but consumer spending continued to rise as excess savings were used to support consumption. DPI has been rising again since mid-2022, suggesting that consumers are now supporting their spending with employment and real wage gains.
The personal income release also includes series for unearned income, including dividends, interest, and rent, as well as proprietors’ income and Social Security benefits. They all were at record highs during June.
(7) Net worth. Finally, Debbie, Melissa, and I continue to monitor the Fed’s quarterly data on the net worth of the household sector. It rose to a record high of $148.8 trillion at the end of Q1. Recently, we’ve also analyzed the available data for the net worth of the major age cohorts, particularly the Baby Boomers, who collectively had a record $74.5 trillion in net worth at the end of Q1. As they retire, we expect they will spend some of their retirement assets, depressing the national personal saving rate. When they pass away, their children will inherit what’s left. So the younger generations might also save less. This is all likely to boost consumption.
Movie. “Barbie” (+) (link) is a warm-hearted nostalgia movie for mothers and their daughters. My 22-year-old daughter saw it with her girlfriends and loved it. She wanted to see it a second time and convinced her mom and dad to join her. Barbie was created by Ruth Handler and launched by Mattel in 1959. The doll has become a cultural icon. Barbie has kept up with the times. She started as a teenage fashion model, but over the years had lots of interesting careers from astronaut to surgeon. After Barbie’s debut on store shelves, little girls no longer were limited to playing with baby dolls and imagining being a mother but now could imagine being as successful as Barbie in whatever career they chose. She was aspirational. The History Channel featured Barbie in an excellent docudrama series titled “The Toys That Built America.”
Industrials, Tech & Identifying Humans
July 27 (Thursday)
Check out the accompanying pdf and chart collection.
Executive Summary: US government incentives offered to entice manufacturers to set up shop in the USA have hit their mark: Manufacturers in huge numbers, domestic and foreign, have been revamping their supply chains to relocate their production facilities to the US. It’s not always easy, as Jackie explains. But the boost to US economic activity is quantifiable and growing. … Also: AI is here, but all the ways it may disrupt markets are still unknown; will it dislodge the leaders in search and office software, Alphabet and Microsoft? … And: The dilemma of how to tell whether online content was human- or AI-generated has a solution, says one father of AI, involving eyeballs, orbs, and Worldcoin.
Industrials: Onshoring Bumps. Foreign and domestic manufacturers have pounced on the opportunity to receive trillions of dollars in tax breaks and other incentives offered in the Biden administration’s CHIPS and Science Act, the Inflation Reduction Act, and the Infrastructure Investment and Jobs Act. Add that to supply-chain disruptions and geopolitical tensions, and it’s no wonder that manufacturers have been reconsidering their sourcing options. Reshoring, nearshoring, and “friendshoring” (sourcing from countries that are political allies) have been getting a second look.
In a recent survey of 2,000 US and UK CEOs, 43% said they have been or are currently actively looking at onshoring or nearshoring some or all of their supply chains, according to a July 6 Proxima press release. Plants making everything from solar panels to semiconductors are under development or have come online already. The positive economic impacts of more US manufacturing jobs are showing up in the data and should only intensify.
As might be expected, some problems have cropped up. Companies are grousing about the length of time it takes to receive environmental approvals and local permits, and they’re not happy about the cost of US labor. This week, Taiwan Semiconductor Manufacturing reported that the opening of its Arizona semiconductor chip factory will be pushed back a year to 2025 due to difficulty finding skilled workers in the US and the need to bring in workers from Taiwan. And in March, Stanley Black & Decker shut down the automated Craftsman tool plant built in Texas that was plagued by problems with its machinery among other things.
The Wall Street Journal recently relayed the experience of two manufacturers. Jervois Global tried and failed to launch a cobalt mine in Idaho. Bath & Body Works managed to bring its manufacturing and packaging operations and suppliers to Ohio from their previous locations at home and abroad. Their different outcomes are instructive. Let’s take a look at what these two companies encountered, along with data on how the manufacturing boom is boosting the US economy:
(1) A tale of defeat. Jervois halted progress on its mine because the price of cobalt fell from almost $40 a pound in May 2022 to about $15 more recently. The mine’s breakeven price is about $17.50 a pound, and the company will wait until prices rebound to $25 or more before reopening the mine, a July 22 WSJ article reported. The company spent almost twice what it had expected to spend constructing the Idaho facility and obtaining permits; the required red tape—including environmental reviews and dealing with appeals by rival miners—took almost a decade. A fire in the area presented another challenge.
Even though the mine is closed, its maintenance costs about $1 million a month. Despite the mine’s closure, the Pentagon awarded Jervois $15 million last month to keep drilling in Idaho and to study the potential for a US refinery. The funding, which needs regulatory approval, is expected in August, and the company has also applied for an Energy Department loan.
“A senior official at the Pentagon, which under the Defense Production Act could get priority to buy cobalt in an emergency, said such investments are risks worth taking. With the exception of some deposits in Idaho and Missouri, additional U.S. production would have to come as a byproduct of another metal, the U.S. Geological Survey said in a report earlier this year,” the WSJ article noted.
(2) A tale of success. In 2008, Bath & Body Works wanted to get its products to market more quickly, so it decided to move its production from China, Canada, and Virginia to the outskirts of Columbus, Ohio near the company’s existing distribution center. There, the company and its suppliers now make soaps, bottles, labels, and anything else needed with 5,000 employees during peak season, a July 25 WSJ article reported.
Replicating Bath & Body Work’s success may be tough for companies that produce items like semiconductors or smartphones, which rely on very specialized suppliers located in Asia. Bath & Body Works had to guarantee its suppliers business for a set number of years, and suppliers had to fill their factories with automation to remain competitive. “[P]roduction in the U.S. employs around 10 people and required $12 million in capital investment, versus employing around 50 people with under $2 million in investment for similar production capacity in China,” one supplier told the WSJ. But the company reaped the benefit of production times that shrunk to under a month from five months previously.
(3) Quantifying the boom. The move to bring manufacturing back to US shores may be in the early innings, but the impact is already being felt. Jobs in manufacturing are on the rise. New jobs announced in Q1 related to reshoring and foreign direct investment (FDI) in the US rose to 406,214 on an annualized basis, up 11% from 2022, according to a May 18 press release from the Reshoring Initiative. The figure has jumped dramatically since 2019, when only 100,487 jobs were added due to reshoring or FDI.
Labor Department figures tell a similar tale. The number of people working in manufacturing, 13.0 million as of June, has climbed past the prior peak hit in 2019 to a level last seen in November 2008. Likewise, the number of employees in goods producing jobs—including manufacturing, construction, mining, oil and gas extraction, agriculture, forestry, fishing, and hunting—has climbed to 21.6 million, past 2019 levels and back to levels not seen since May 2008 (Fig. 1).
Companies and suppliers building factories have helped to push up construction machinery orders up 13.5% y/y (Fig. 2). Several categories of machinery orders have posted double-digit gains. Here’s a look: turbines, generators, and other power transmission equipment (20.5% y/y), mining, oil field & gas field machinery (14.8), and material handling equipment (12.8) (Fig. 3).
The influence is also apparent in construction spending. While residential construction spending has slumped over the past year, spending on nonresidential construction has soared 20.5% y/y in May, while spending on public construction was up a more modest 12.3% (Fig. 4).
All this activity has benefited the S&P 500 Industrials sector’s price index. Here’s the performance derby for the S&P 500 and its 11 sectors ytd through Tuesday’s close: Information Technology (45.9%), Communication Services (36.7), Consumer Discretionary (33.5), S&P 500 (19.0), Industrials (11.6), Materials (9.9), Real Estate (4.5), Financials (3.2), Consumer Staples (2.0), Health Care (-0.2), Energy (-1.9), and Utilities (-3.0) (Fig. 5).
Some industries in the Industrials and Materials sectors that are closely tied to industrial activity have also risen sharply ytd through Tuesday’s close: Construction Materials (31.0%), Steel (23.5), Electrical Components & Equipment (18.3), Industrial Conglomerates (17.6), Industrial Machinery (17.0), Industrial Gases (13.7), and Construction Machinery & Heavy Trucks (12.8).
Technology: The AI Shakeup. Artificial intelligence (AI) may dramatically change how we search for news and how we use computer software like Word and Excel. The question is: Will it change which search engines and which software programs we use? The answer may have a material impact on the future of Alphabet and Microsoft.
Both companies are spending billions to infuse AI into their cloud services, office software, and search engines. Google undoubtedly wants to expand its share of the office software market and defend its dominance in search, while Microsoft would like to make Bing a search leader instead of an afterthought and defend its dominance of the office software market.
While the two companies’ shares have risen by a similar amount this year, investors seem to be betting that Microsoft will come out ahead. Microsoft shares climbed 46.4% ytd and Alphabet shares 38.4% ytd through Tuesday’s close. However, Microsoft shares sport a much higher valuation, with a forward P/E of 31.3, while Alphabet shares trade at 20.0 times forward earnings estimates. (FYI: “Forward P/E” is the multiple based on forward earnings, or the time-weighted average of analysts’ consensus operating earnings-per-share estimates for the current year and following one.)
Here's a look at some of the highlights of the companies’ earnings from last quarter and some data on the S&P 500 industries in which the stocks reside:
(1) The search jump ball. Alphabet generated $42.6 billion in advertising revenue from “Google Search & other” in Q2, up 4.8% y/y. Even though the company has diversified into different businesses, Google search remains a cornerstone. Google search advertising revenue is 57.1% of the company’s total Q2 revenue, and the company maintains a dominant share of the search market—83.5% as of March (no wonder “google” has become a verb!). That’s far larger than the 8.2% market share of its largest competitor, Bing, according to Statista data.
Therein lies the opportunity for Microsoft, where search and news advertising increased 3% y/y to $86 million last quarter, a pimple on the company’s $56.2 billion in total revenues. Microsoft has demonstrated AI-infused Bing, which serves up answers with citations showing where the information was sourced. The company will have to offer up a demonstrably better search experience before users shake their googling habit.
(2) Spend big or go home. Spending on AI and on boosting cloud capacity rose much more sharply at Microsoft than it did at Alphabet last quarter. Microsoft’s spending on capital expenditures rose 23.0% y/y last quarter to $10.7 billion “to support cloud demand, including investments in AI infrastructure,” explained CFO Amy Hood on the company’s earnings conference call. Hood said spending will accelerate again next quarter.
Alphabet’s capex was $6.9 billion last quarter, largely unchanged y/y and lower than expected because of construction projects delays. Spending should pick up in H2-2023 and in 2024. “The primary driver is to support the opportunities we see in AI across Alphabet, including investments in GPUs and proprietary TPUs, as well as data center capacity,” said CFO Ruth Porat.
(3) Cloud growth slowing. Revenue growth from both companies’ cloud operations continues to grow fast, but it’s decelerating. Microsoft’s Azure cloud revenue increased 26% y/y last quarter, down from 40% growth a year earlier. The company doesn’t report Azure’s revenue in dollars. Likewise, Alphabet’s cloud revenue jumped by 28.0% y/y to $8.0 billion, but that was down from 40%-plus growth a year earlier.
(4) Industry stats. Microsoft and Alphabet reside in two different S&P 500 industries and sectors: Microsoft is housed in the S&P 500 Information Technology sector’s Systems Software industry, while Alphabet is in the S&P 500 Communication Services sector’s Interactive Media & Services industry.
The Systems Software stock price index has risen 46.1% ytd through Tuesday’s close, and it has topped its December 2021 high after tumbling sharply in 2022 before rebounding this year (Fig. 6). Revenues and earnings growth slowed a touch this year but have been amazingly resilient over the years. Earnings grew 20.7% in 2020, 33.9% in 2021, and 13.1% in 2022; they’re expected to climb 6.6% this year and 14.3% in 2024 (Fig. 7). Earnings estimate revisions have been net positive in May, June, and July after declining for much of the prior year (Fig. 8). The industry’s only potential drawback is its forward P/E of 31.5, which is up from 20.8 in 2022 and not far from its 34.3 high in 2021 (Fig. 9).
The S&P 500 Interactive Media & Services industry (which includes industry giant Meta) has seen its price index rise 60.7% ytd, but it remains 18.5% off of its September 2021 high (Fig. 10). The industry posted a 22.0% drop in earnings in 2022, hurt by a slowdown in digital advertising, but analysts are expecting a strong rebound with targets of 22.7% earnings growth this year and a 20.3% increase in 2024 (Fig. 11). Net earnings revisions have been positive since March, after being negative for more than a year prior (Fig. 12). Yet the industry’s forward P/E remains in the doldrums at 21.5, still down sharply from its peak of 32.3 in September 2020 (Fig. 13).
Disruptive Technology: Altman’s Worldcoin Starts Trading. AI has created a problem. It is increasingly difficult for consumers of online content to know whether what they’re reading, listening to, or watching is the handiwork of humans or robots. Sam Altman, one of the creators of ChatGPT, has devised a solution.
Altman founded Tools for Humanity, a company that uses an orb—a five-pound shiny, round device—to snap pictures of humans’ irises. Each picture is translated into a code that reflects the uniqueness of each iris. It will be used to identify humans as humans and solve the problem that AI has created, as we discussed in the June 1 Morning Briefing. Humans who get their eyes scanned receive 25 free Worldcoin tokens, a cryptocurrency that can be stored in the company’s payment app, the World App.
This week marked a milestone for Worldcoin. It started trading on markets where cryptos can legally trade. That means it does not trade on US exchanges. But internationally, the price of Worldcoin surged more than 60% to a high of $3.58 on Monday from its initial price of $1.70 that morning. It since has settled down to $2.32 by late Wednesday. So far, 110.6 million of Worldcoins have been issued and $294.3 million of the coins have traded, according to Coinbase.
Worldcoin plans to sharply increase the pace of iris scans by boosting the number of available orbs to 1,500 in 35 cities around the world this summer and fall. Doing so will increase the number of signups it can handle five-fold, up to 200,000 a week. Although Worldcoins don’t trade in the US, iris scanners are available in New York, Los Angeles, San Francisco, and Miami, the company’s blog states.
Over There & Over Here
July 26 (Wednesday)
Check out the accompanying pdf and chart collection.
Executive Summary: We keep tabs on how well the world economy is faring by monitoring our Global Growth Barometer as well as the “flash” S&P Global PMIs for the major developed economies. “Soft landing” best describes what the global economy has been undergoing, while “no landing” characterizes the slowly growing US economy. … China’s economy has struggled under the weight of several problems; we doubt the leadership can fix them as promised. … In the US, the latest consumer confidence survey shows that the labor market remains strong.
Global Economy I: Getting Softer. Here in the United States, the debate between the hard landers and soft landers continues even though the data suggest that the no-landing scenario might more aptly describe the performance of the economy.
On a global basis, there was much talk about a hard landing last summer, especially in Europe and China. But the Europeans enjoyed a warm winter and found plenty of natural gas to avoid freezing in the dark had it been a severe winter. The Chinese government abruptly ended its draconian policy of pandemic lockdowns at the end of last year. It was widely expected that the Chinese economy would experience a post-lockdown boom. Instead, the recovery has been anemic at best. Meanwhile, the US economy continues to grow, albeit slowly.
The flash S&P global PMIs for July suggest that the global economy continues to avoid a hard landing, while falling into a soft landing. Let’s review the data, starting with our Global Growth Barometer (GGB):
(1) Global Growth Barometer. Debbie and I like to monitor our daily GGB to assess whether global economic activity is growing or slowing (Fig. 1). The GGB is the average of the Brent crude oil nearby futures price and the CRB raw industrials index (multiplied by 2 and divided by 10). Our GGB closely tracks the S&P Goldman Sachs commodity index (Fig. 2). However, we prefer our GGB because it does not include agricultural and lumber prices and because we can track the contributions of the CRB index (which does not include energy, food, or lumber commodities) and the price of oil to our GGB (Fig. 3).
Our GGB peaked near the beginning of last year at 130.7 on March 8. It fell to 99.9 by the end of 2022. On Monday, July 24, it was down slightly to 97.2.
By the way, both our GGB and the S&P Goldman Sachs index are inversely correlated with the trade-weighted dollar (Fig. 4 and Fig. 5). The dollar tends to be strong (weak) when the global economy is relatively weak (strong) compared to the US. The dollar has been lackluster and range-bound since the start of the year, even though the US economy has performed relatively well compared to the rest of the world.
(2) US PMIs. The S&P Global M-PMI for the US edged up in July to 49.0 (Fig. 6). It has been mostly below 50.0 since November 2022, as consumers have pivoted from buying goods to buying services. The NM-PMI edged down to 52.4 in July, remaining above 50.0 since February.
(3) Eurozone PMIs. The Eurozone M-PMI has been below 50.0 since July 2022 (Fig. 7). It was 42.7 in July, the lowest since May 2020. The region’s NM-PMI was 51.1 during July, the weakest since January.
Especially weak has been Germany’s M-PMI at only 38.8 during July (Fig. 8). During the month France had the weakest NM-PMI at 47.4 (Fig. 9).
(4) Japan PMIs. During July, Japan’s M-PMI edged down to 49.4 from 49.8 in June (Fig. 10). It has been mostly below 50.0 since November 2022.
(5) MSCI forward revenues. Forward revenues for the US MSCI has been on a gradual uptrend since mid-2022 following a steep uptrend that started in mid-2020 (Fig. 11 and Fig. 12). It rose to a record high during the July 13 week. Over the past year, the forward revenues for the developed world ex-US and for the emerging markets MSCI indexes have been flat. (FYI: Forward revenues is the time-weighted average of industry analysts’ consensus revenues estimates for the current year and following one.)
Global Economy II: CCP to the Rescue? As we’ve previously observed, China’s economy is having more difficulty than expected emerging from the three years of zero-Covid lockdowns that ended late last year. Real GDP fell 1.7% q/q (saar) during Q2-2023. China’s property market is in decline and so is the construction work it generates—responsible for about a quarter of economic growth—as the air continues to come out of its property bubble. Consumer spending remains lackluster, as households are cautious about making big purchases. A rapidly aging demographic profile is also weighing on consumption.
The unemployment rate for 16- to 24-year-olds hit a record-high 21% last month. Indebted local governments are edging toward defaulting on their debts. A record 11.6 million people left college this summer and are finding fewer jobs than usual. Some of the young unemployed are living with their parents and jokingly describe themselves as “full-time children” again.
The Chinese Communist Party (CCP) has long justified its authoritarian rule by promising a brighter economic future. President Xi Jinping pledged to reduce inequality and deliver “common prosperity.” But the economy is sputtering, and the future is looking less bright.
China’s leaders are clearly worried about social unrest. The CCP is scrambling to boost economic growth. The government is shifting course to improve the business environment following three years of heavy-handed measures to regulate and supervise the economy more tightly. In addition, Beijing is formulating measures to boost consumption, particularly of electric vehicles. The government also has promised to “adjust and optimize policies in a timely manner” for its depressed property sector, and to “activate capital markets and boost investor confidence.”
It's obviously too soon to tell whether the barrage of promises to make things better for the economy will work. We are skeptical. So far, the reactions of the nearby futures price of copper and the China MSCI stock price index have been muted (Fig. 13). Both are sensitive indicators of China’s economic activity. We do expect China’s leadership will tone down its belligerent rhetoric about Taiwan while the country’s leaders are playing nice, for a change, to attract foreign investors.
US Labor Market: Still Booming. The earliest monthly indicator of the US jobs market is the consumer confidence survey conducted monthly by the Conference Board. July’s survey came out on Tuesday. The Consumer Confidence Index rose smartly this month, with solid gains in both its current conditions and expectations components (Fig. 14). Furthermore, consider the following:
(1) The survey’s “jobs plentiful” series edged up to 46.9% (Fig. 15). That’s down from readings of over 50.0% last year, but it remains elevated and suggests that the “job openings” series in the JOLTS report remained very high in June and July.
(2) The survey’s “jobs hard to get” series edged down to a near-record low (since 1967) of 9.7% this month (Fig. 16). This series is highly correlated with the unemployment rate and suggests that it remained near recent lows during July. July’s employment report will be released on August 4. It could be another strong one. The next recession remains a no-show for now.
Workers Of The World: Strike!
July 25 (Tuesday)
Check out the accompanying pdf and chart collection.
Executive Summary: What’s on our worry list? Yesterday, we covered urban office real estate, which adds credit availability concerns to our worry list. Today, we look at the labor market, specifically the unrest fomented by the effects of the pandemic and inflation. … Labor unions have grown in might, their members are striking, and employers are being forced to meet their demands. … So we are adding a renewed wage-price spiral to our worry list, which could happen if a rebound in wage inflation leads to resurgent consumer price inflation.
Weekly Webcast. If you missed Monday’s live webcast, you can view a replay here.
US Labor Market I: Unrest. Labor unrest in the United States has been on the rise in recent years. In 2022, there were 424 work stoppages—including 417 strikes and seven lockouts—up 52% from 279 in 2021.
Several factors have contributed to the rise in labor unrest:
(1) Pandemic’s labor market effects. The economic recovery from the Covid-19 pandemic unleashed several shockwaves that impacted the labor market. As the economy reopened, workers pushed for higher wages and better benefits. Many did so by quitting their jobs for better paying ones. They could do so because the demand for labor exceeded the supply since May 2021. The former can be measured as the sum of the household employment (which counts the number of people with jobs) plus job openings, while the latter is simply the labor force (Fig. 1). During May, excess demand for labor totaled 3.7 million workers.
The unemployment rate was 3.6% during June (Fig. 2). The short-term unemployment rate was only 2.9%, while the long-term rate was just 0.7%. The jobless rate for adults was 3.3%, while it was 11.0% for teenagers, which is a relatively low reading (Fig. 3). Here are June’s unemployment rates by education level: college degree (2.0%), some college (3.1%), high school (3.9%), and less than high school (6.0%) (Fig. 4).
On the demand side of the labor market, job openings exceeded 10.0 million from June 2021 through January of this year, and have been hovering around 10.0 million through May (Fig. 5). There were more than 1.5 job openings per unemployed worker from October 2021 through this May.
(2) Pandemic’s inflation effects. The pandemic triggered a surge in inflation that started during 2021, peaked during the summer of 2022, and has moderated since then. At first, it seemed to cause a wage-price spiral. While wages increased rapidly, so did prices. Inflation-adjusted wages stagnated from mid-2020 through early 2022 (Fig. 6). Many workers were frustrated to see that their pay increases were eroded by rapidly rising prices. That seems to be changing in recent months, as wages have been rising faster than prices. But many workers may not be experiencing that improvement in their purchasing power.
(3) Labor unions’ heightened power. Labor unions have grown more powerful as they’ve become more successful in organizing new workers and winning strikes in recent years. The labor unrest is being felt across a wide range of industries, including transportation, healthcare, and retail. Some of the most notable strikes in recent months have included:
- Thousands of hotel workers in Southern California walked off the job on July 3, 2023, demanding higher pay and better benefits. The strike involved workers at 19 hotels in Los Angeles, Orange, and San Diego counties. The workers are members of the Unite Here union.
- 20,000 nurses at Kaiser Permanente hospitals in California went on strike on July 11, 2023, demanding better staffing levels and safer working conditions. The strike involved nurses at 10 hospitals in the Los Angeles area. The nurses are members of the National Nurses United union.
- 1,400 pilots at Spirit Airlines went on strike on July 1, 2023, demanding better pay and benefits. The strike involved pilots at Spirit Airlines' main hub in Fort Lauderdale, Florida. The pilots are members of the Air Line Pilots Association.
- Thousands of Hollywood writers went on strike on May 10, 2023, demanding better pay and benefits. The strike involved writers for television, film, and streaming services. The writers are members of the Writers Guild of America, West.
(4) More strikes ahead? Important negotiations going on now that could lead to significant strikes include:
- The Teamsters and UPS are currently in contract negotiations, and there is a possibility of a strike if the two sides cannot reach an agreement. The Teamsters represent 340,000 UPS workers.
- The United Auto Workers (UAW) has three separate contracts with General Motors, Ford, and Stellantis that are due to expire on September 14. Ahead of contract negotiations that began on July 13, the head of the UAW declared that its 150,000 members are prepared to strike against the Big Three US automakers if the automakers do not meet their demands.
These are just a few examples of recent labor unrest. Many other strikes are going on across the country, and we likely will see more in the coming months and years.
(5) Flying wages. On Saturday, CNBC reported that American Airlines raised its offer for a new pilot contract by more than $1 billion to match a preliminary deal last week between rival United Airlines and that carrier’s aviators. The CNBC story observed: “Airlines and pilot unions had been negotiating new deals for years. Unions have won more bargaining power in the wake of Covid as the industry grapples with a prolonged pilot shortage just as travel demand recovered. Delta Air Lines pilots approved a new agreement in March for a deal that includes 34% raises over four years.” American’s new offer includes 21% pay bonuses and pay on par with that paid by United and Delta, according to their union, the Allied Pilots Association.
US Labor Market II: Wages & Prices. Now that almost everyone is bullish on the outlook for the economy and the stock market, a renewed wage-price spiral should be added to our worry list. Yesterday, we added the recession that is rolling into the commercial real estate markets, which might have adverse consequences for the widespread availability of credit. Our risque du jour is that the Fed concludes that a renewed wage-price spiral is a significant risk that can be avoided only by causing a recession.
Both price and wage inflation have been moderating so far this year, with the former down more than the latter. As a result, real wages have been rising at a pace consistent with a modest improvement in productivity growth. The risk is that a wave of labor strikes and expensive new contract settlements could cause wage inflation to rebound, forcing companies to raise their prices at a faster clip again. That would trigger a renewed wage-price spiral.
Don’t get us wrong: We are still 75/25 on the odds of a rolling recovery versus an economy-wide recession. But we are spending more time thinking about what could go wrong. We continue to expect that rebounding labor productivity growth will be consistent with wages’ rising faster than prices. We will be monitoring some of the following wage data:
(1) The quarterly Employment Cost Index (ECI) includes series for union and nonunion compensation (Fig. 7). Since H2-2021, the latter has been outpacing the former. During Q1-2023, nonunion compensation rose 5.0% y/y, while union compensation rose 3.6%. Union workers feel like they’ve fallen not just below price inflation, but also below nonunion workers.
(2) The ECI compensation inflation rate is highly correlated with the core CPI inflation rate (Fig. 8). The Fed focuses on the ECI as one of the important indicators of wage inflation that can spiral up and down with price inflation.
(3) The good news is that labor market turnover is falling, as evidenced by the drop in the quit rate from a peak of 3.0% in April of last year to 2.6% this past May. This series tends to lead the ECI wages & salaries inflation rate by nine months (Fig. 9).
Rolling Recession Rolling Over Commercial Real Estate
July 24 (Monday)
Check out the accompanying pdf and chart collection.
Executive Summary: The urban office real estate niche of the commercial real estate market is increasingly distressed owing to the work-from-home trend escalated by Covid. But the problem is contained to the office districts of big cities, and we expect the fallout to be contained too: Sellers of distressed properties will take losses but find buyers, exposed banks will further increase loan loss provisions, increased M&A activity among small banks may result; but the problem won’t domino into a crisis of the banking system or the economy at large. … We detail why with our analysis of data from the Fed. … Also: Dr. Ed reviews “Oppenheimer” (+ + +).
YRI Weekly Webcast. Join Dr. Ed’s live webcast with Q&A on Mondays at 11 a.m. EST. You will receive an email with the link one hour before showtime. Replays of the weekly webcasts are available here.
Commercial Real Estate I: ‘Category 5 Hurricane.’ Barry Sternlicht was interviewed on Bloomberg Wealth With David Rubenstein on June 28 in New York. The interview with the chairman of Starwood Capital Group will be aired on July 25 at 9 p.m. The highlights were featured in a July 20 Bloomberg story titled “Billionaire Sternlicht Sees ‘Category 5 Hurricane’ Spurred by Fed Rate Hikes.”
Sternlicht has amassed his fortune in real estate by purchasing distressed properties during financial crises. He did so during the savings & loan collapse and again during the Great Financial Crisis. He sees similar opportunities now in the commercial real estate (CRE) market for office buildings. Nevertheless, he said, “It’s sort of a blackout hovering over the entire industry until we get some relief or some understanding of what the Fed’s going to do over the longer term.”
Among the companies exposed to this CRE hurricane is Starwood, which has more than $115 billion in assets under management. On July 9, the firm failed to refinance or pay off the $212.5 million mortgage on Tower Place 100 in Atlanta’s Buckhead district. The firm is negotiating an agreement with its lenders. Blackstone Inc. and Brookfield Asset Management Ltd. also have stopped making payments on a few of their office buildings.
June’s Trepp CMBS Research reported that “the commercial mortgage-backed securities (CMBS) market saw a noticeable uptick in delinquencies,” during May and June, with the overall CMBS delinquency rate (i.e., percent late by 30 or more days) rising to 3.90% last month led by retail (6.48% down from 6.69% a year ago), lodging (5.35% down from 5.94%), and office (4.50% up from 1.68%) (Table 1, below). The Atlanta area’s office-vacancy rate climbed to 22.4% in the second quarter, compared with the US average of 20.6%, according to brokerage Jones Lang LaSalle Inc.
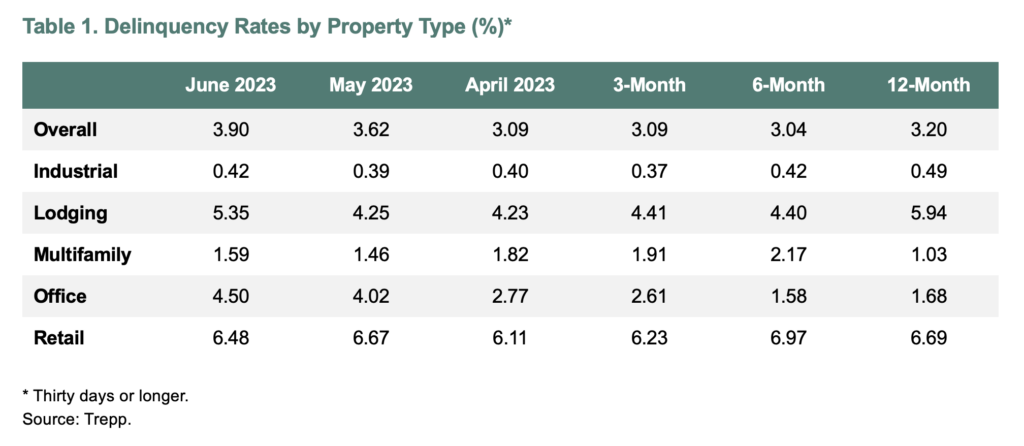
Office vacancies are up sharply since the pandemic forced many office workers to work from home. Now many of them want to continue doing so and are resisting returning to their cubicles. Many employers are fine with that and have adopted hybrid schedules allowing workers to come to the office part of the time and work from home otherwise. Many of the employers haven’t been renewing their leases, opting instead to move to smaller spaces.
In a CNBC interview on November 17, 2022, Sternlicht warned that the Fed’s aggressive tightening of monetary policy would depress the economy more than expected. “It’s not sustainable,” he said. “What they want to do is clearly suicide.” In his latest interview on Bloomberg, he said, “You could see 400 or 500 banks that could fail. And they will have to sell. It also will be a great opportunity.”
Commercial Real Estate II: How Distressing Is It? Debbie, Melissa, and I aren’t distressed about the distress in the CRE market for office buildings. There will be a market for distressed properties. There’s lots of cash ready to be deployed in distressed asset funds. Sellers will take their losses, reducing the rate of returns on their CRE portfolios. Many of the banks already have increased their provisions for loan losses.
In his latest interview, Sternlicht said, “You could see a second RTC.” He was referring to the Resolution Trust Corporation, the government entity charged with liquidating assets of the savings & loan associations that failed in the late 1980s and early 1990s. But what about the hundreds of bank failures that he expects? We think that CRE loan losses and higher regulatory costs will result in a wave of mergers and acquisitions, averting a banking crisis.
After all, hurricanes are local, not national events. In this case, the financial storms are likely to hit the office districts of several urban areas. The loan losses will likely be concentrated among large banks and institutional investors. Suburban office buildings are less likely to be distressed by the work-from-home trend because suburban workers typically live closer to their workplaces than urban workers with long commutes from homes in the suburbs. So small banks may not be all that exposed to loan losses on their suburban office properties.
Commercial Real Estate III: By the Numbers. Now let’s have a closer look at the loan portfolios of the US commercial banks focusing on their exposure to CRE loans. The data are available weekly in the Fed’s H.8 release titled “Assets and Liabilities of Commercial Banks in the United States - H.8.” The release shows outstanding loans for the following categories: commercial & industrial, commercial real estate, residential real estate, and consumer credit. Series are also available for large and small banks:
(1) All loans. Loans held by banks of all three categories—“all,” “large,” and “small”—have flattened out in recent weeks at record highs around $12.1 trillion, $6.7 trillion, and $4.3 trillion, respectively (Fig. 1).
(2) C&I loans. Commercial & industrial loans soared during the first few months of the pandemic as companies scrambled to take down their lines of credit at the banks. The Fed’s emergency liquidity facilities and ultra-easy monetary policies in response to the pandemic stopped the panic borrowing, and C&I loans fell during most of 2020 and 2021 (Fig. 2). During that period, consumers’ buying binge for goods depleted business inventories and reduced the demand for C&I loans. During 2022 through early 2023, unintended inventory accumulation occurred as the buying binge came to an end, boosting the demand for C&I loans.
Now inventories have been pared back, as reflected by the weakness in C&I loans for all three bank categories in recent weeks. Of course, the tightening of lending standards might also be weighing on C&I loans.
(3) CRE loans. During the July 12 week, all banks held $2.9 trillion in CRE loans, with small and large banks holding $1.9 trillion and $0.9 trillion, respectively (Fig. 3). These loans have plateaued in recent weeks at these record levels. In other words, so far, the data suggest that banks on average are not adding to their CRE loan portfolios.
(4) Residential and consumer loans. Banks of all sizes have $2.5 trillion in residential loans. Small banks’ residential loans rose to a record high of $0.9 trillion during the July 12 week, while large banks, with $1.6 trillion in residential loans, appear to have started paring back their holdings (Fig. 4). Loans for multi-family properties remain on uptrends for the three categories of banks, though they are starting to look toppy at the large banks (Fig. 5).
The same pattern can be discerned in consumer loans. Consumer loans at all banks currently total a record $1.9 trillion, with large and small banks holding $1.4 trillion (a slight downtick from the recent record high) and $0.5 trillion (a record high), respectively (Fig. 6).
Data are also available for auto loans at the banks. They are weakening, especially recently and especially at the large banks (Fig. 7).
(5) Provisions for loan losses. The banks have increased their provisions for loan losses as a result of mounting concerns that the Fed’s aggressive tightening of monetary policy might cause a recession. Allowances for loan losses at all the banks have increased $27.0 billion over the past year through the July 12 week to $187.5 billion (Fig. 8). That’s still below the pandemic high of $220.7 billion during the September 23 week of 2020.
FactSet estimates that the 15 banks in the S&P 500 Banks industry increased their provisions for loan losses to $9.9 billion during Q2-2023, up from $4.9 billion a year ago. On Thursday, Key Bank reported a bigger-than-expected 50% fall in quarterly profits as the lender’s provisions for credit losses jumped by 271% to $167 million at the quarter’s end from $45 million in the year-ago quarter.
(We monitor the weekly balance sheet of the commercial banks with our two chart books: Commercial Bank Book and Commercial Bank Loans. They are automatically updated after the data are released on Fridays at 4:15 p.m.)
Commercial Real Estate IV: The Fed’s Assessment. The Fed’s May 2023 Financial Stability Report included a review of the CRE credit market. Our conclusion is that a hurricane in that market shouldn’t cause an economy-wide credit crunch and a recession. The report observes:
“The shift toward telework in many industries has dramatically reduced demand for office space, which could lead to a correction in the values of office buildings and downtown retail properties that largely depend on office workers. Moreover, the rise in interest rates over the past year increases the risk that CRE mortgage borrowers will not be able to refinance their loans when the loans reach the end of their term. With CRE valuations remaining elevated (see Section 1, Asset Valuations), the magnitude of a correction in property values could be sizable and therefore could lead to credit losses by holders of CRE debt.”
The Fed’s report includes the following table. Below are some of the key findings:
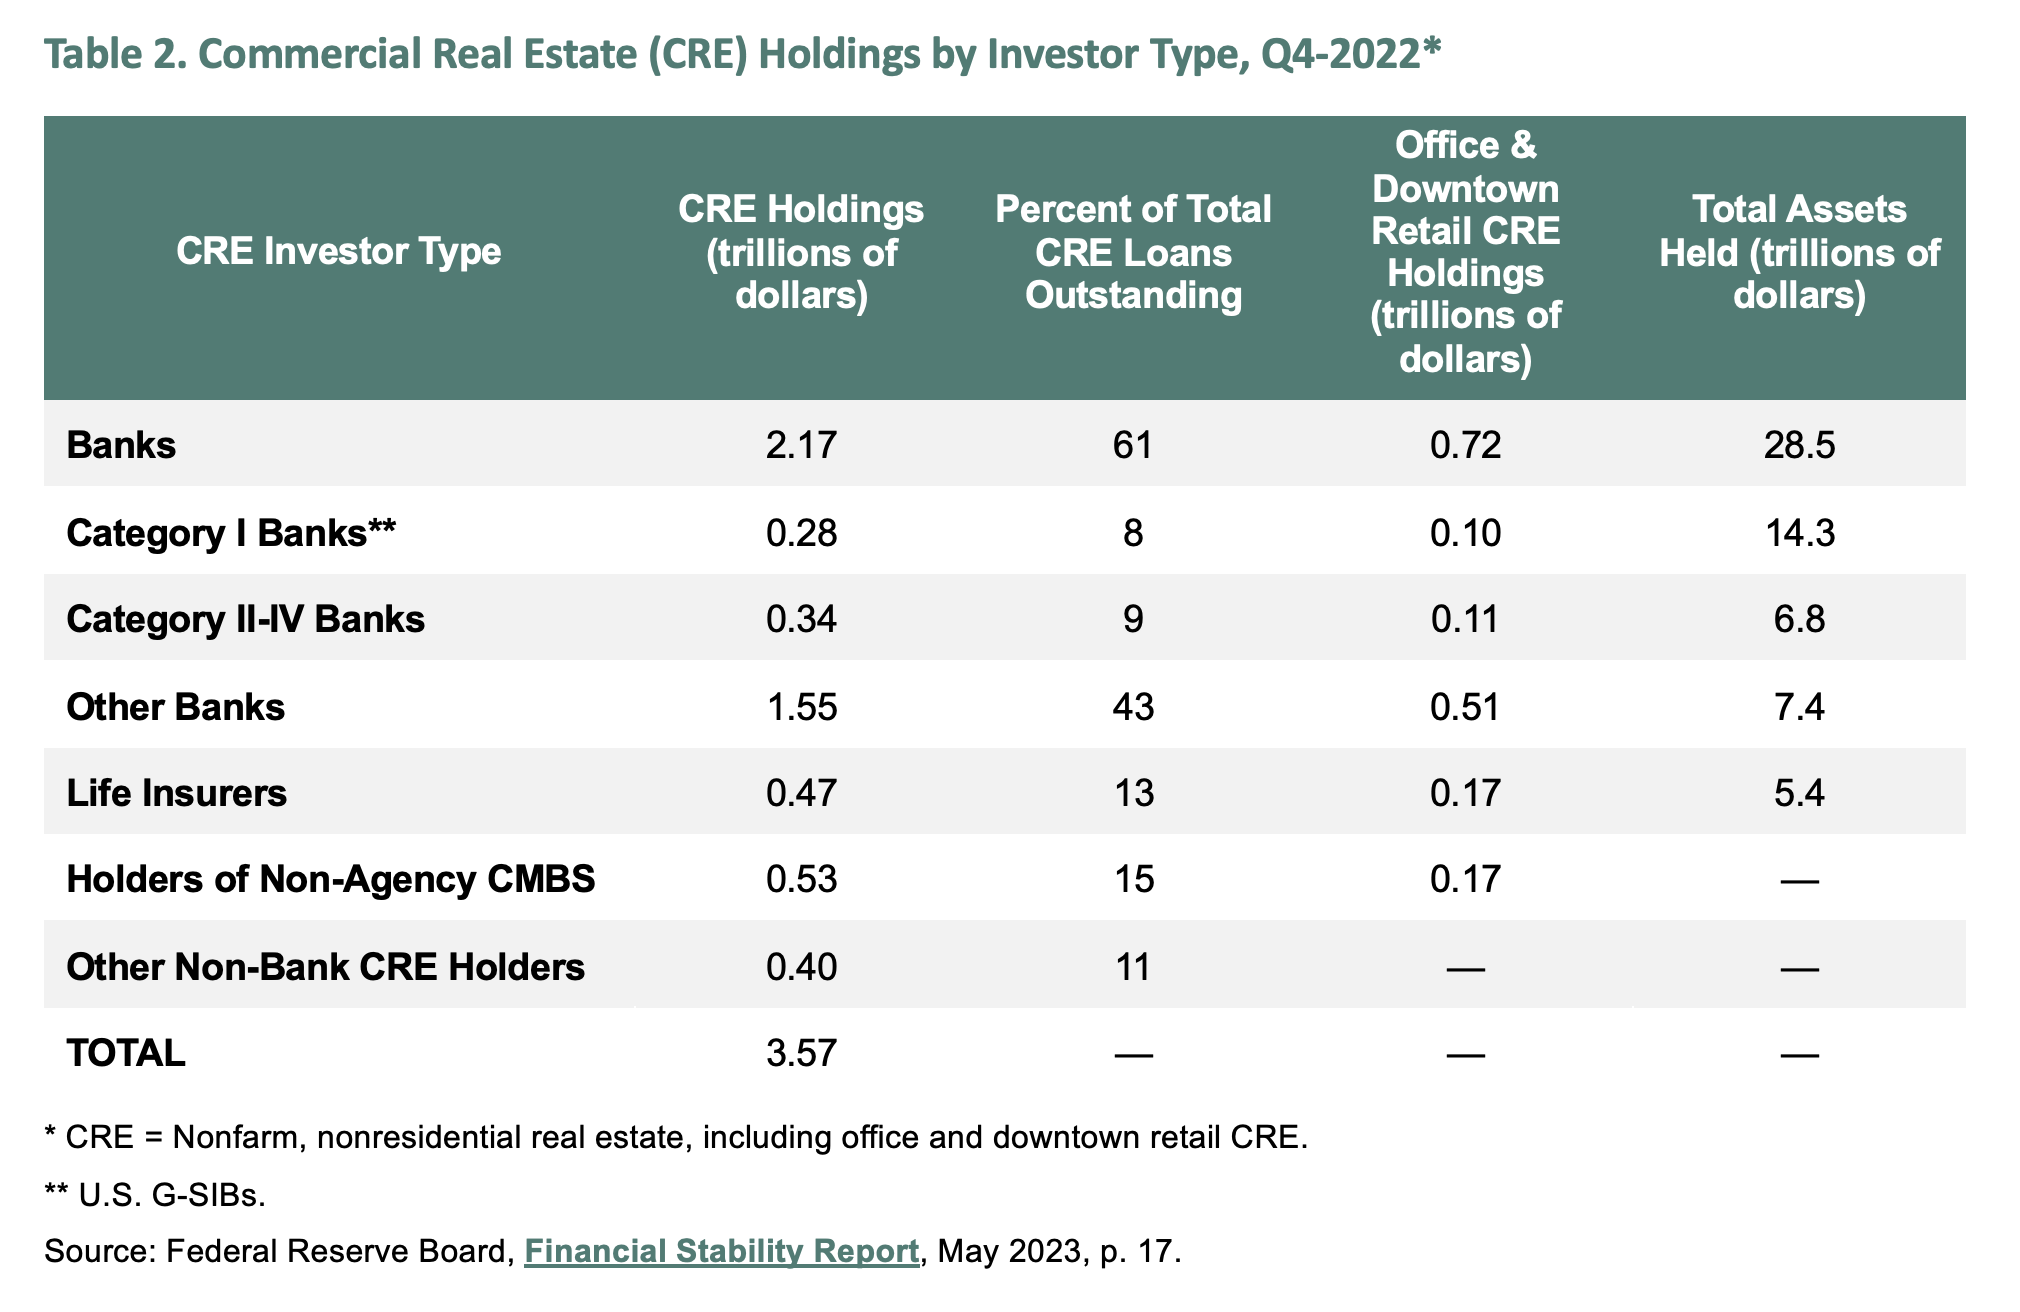
(1) At the end of Q4-2022, banks held $2.17 trillion in CRE mortgage assets, or 61% of the total outstanding. The smaller banks held $1.55 trillion, or 43% of these assets. So the latter group of investors is most exposed to potential losses in CRE, though those whose portfolios have more suburban than urban office buildings might be less exposed. Nevertheless, their CRE borrowers may have to refinance their mortgages at prohibitively high rates or renegotiate the terms of their refinancings with their lenders.
(2) The Fed’s data show that small banks are in fact heavily exposed to office and downtown retail CRE loans to the tune of $510 billion during Q4-2022. The data don’t show how much of the exposure to office buildings is in urban centers versus the suburbs.
(3) In his June 14 press conference, Fed Chair Jerome Powell said that the Fed is closely monitoring the CRE sector. He observed: “There’s a substantial amount of commercial real estate in the banking system. A large part of it is in smaller banks.” He expects that there will be losses and he expects that the problem “will be around for some time.” He doesn’t expect that it “will suddenly hit” in a way that causes “systematic risk.” We agree with him.
Movie. “Oppenheimer” (+ + +) (link) is an excellent biopic and docudrama about Robert Oppenheimer, who directed the secret Manhattan Project, which developed and built the two atom bombs that were dropped on Japan and ended World War II. The cast is outstanding, starring Cillian Murphy in the title role. Standout performances were also delivered by Robert Downey Jr. as Lewis Strauss and Matt Damon as Lt. Gen. Leslie Groves Jr. Director Christopher Nolan’s achievement is to look beyond the bomb at the man behind it as well as the national and geopolitical implications of the bomb. Also considered are the implications for humanity of creating a weapon of mass destruction that could wipe out creation itself.
Defense, China & Quantum Computers
July 20 (Thursday)
Check out the accompanying pdf and chart collection.
Executive Summary: In these geopolitically tense times, countries need to build more formidable military arsenals to deter aggressors—which for defense contractors means surging demand. Meeting it may be a challenge, admitted Lockheed Martin on its Q2 earnings call, voicing the need for a stronger supply chain; investors were swift to punish the stock. Jackie provides context with earnings and valuation data for the S&P 500 Aerospace & Defense industry. … Also: China’s real estate crisis continues to deepen. News of the most recent property developers to default has sunk China’s junk bond prices. … And: The race for quantum computing supremacy among Google, Amazon, and IBM.
Industrials: Playing Defense. On Tuesday, Lockheed Martin reported Q2 earnings that beat analysts’ forecasts and an orders backlog that hit a record high. The company also upped its 2023 earnings-per-share forecast. Nonetheless, that day saw the defense contractor’s share price fall by 3.0% compared to the S&P 500’s 0.7% gain. A couple of company-specific problems revealed on the earnings call apparently diverted investors’ attention from the strong growth in defense spending that’s been occurring around the world in response to threats from China and Russia.
European members of NATO and Canada are expected to boost defense spending by 8.3% this year to $356 billion, faster than the 2.0% increase last year and 2.8% jump in 2021, according to a July 7 NATO press release. This year’s defense spending increase by NATO’s European members and Canada is higher than any annual increase over the past decade, including the prior fastest spending increase of 5.9% in 2017.
The jump in spending by NATO’s European members and Canada on defense equipment specifically is even more dramatic: up an estimated 24.9% this year compared to an estimated 8.5% increase in 2022, 11.3% in 2021, and 8.9% in 2020. These spending changes are calculated using 2015 prices and would be larger had they been adjusted for inflation.
So let’s take a look at what may have disappointed Lockheed investors on Tuesday, while also remembering the surge of spending that should bolster the defense industry’s results for years to come:
(1) Disappointing details. Lockheed shares initially rose on Tuesday after the company reported that sales rose 8.1% y/y to $16.7 billion in Q2, compared to the consensus expectation of $15.9 billion, according to a July 18 Investor’s Business Daily article. Management boosted its 2023 earnings-per-share forecast to $27.00-$27.20, up from the $26.60-$26.90 projected in April. And Lockheed’s backlog grew 5.3% from the start of the year to a record $158.1 billion. The company’s various product offerings include aircraft (e.g., the F-35 and the F-16), missiles, rockets, unmanned systems, helicopters, radar systems, undersea systems, space technologies, and transport systems.
The company’s shares fell later in the day as more details about the quarter emerged. Management didn’t increase the “single-digit growth” it sees for 2024 revenues, albeit now measured off a higher 2023 base than previously expected. Lockheed executives attributed their cautious 2024 outlook to the company’s suppliers’ inability to keep up with demand.
“It’s not a question of demand; it’ll be a question of supply. And we need to go through that analysis over the next few months and determine to what extent our growth outlook will change, if anything from this baseline of low single digit,” said CFO Jay Malave on the earnings conference call.
Lockheed also reduced the number of F-35s it plans to deliver this year to 100-120 from 147-153 owing to difficulties getting certification for updated hardware and software, a July 18 Defense One article reported. The updated planes will have 20-25 times more computing power, more memory, and a new panoramic cockpit display. But the new systems have had reliability issues, and the Pentagon stopped accepting jets with the updates in June. By 2025, however, the company anticipates delivering 156 of the planes annually.
Lockheed suffered another blow earlier this year when it lost a contract with the US Army to produce the next generation of aircraft to Textron’s Bell division’s V-280 Valor. Last year, the Army placed what will likely be its last order for Lockheed’s Black Hawk helicopters in a program that will run through 2027.
(2) Dangerous world boosts defense spending. Defense spending domestically and abroad is increasing as countries respond to the potential threats posed by China and Russia. In addition, munitions and supplies used in the Ukraine war need to be replaced.
Domestically, the US House of Representatives has passed the $886 million National Defense Authorization Act. It includes a 5.2% pay raise for military members, initiatives to counter China, an additional $300 million to support Ukraine, and increased spending on aircraft including the F-35, the July 18 Investor’s Business Daily article reported. The spending would mark a 3.3% increase from this year’s $858 billion defense budget. Senate Democrats are expected to reject social items included in the House bill.
Additionally, the US is expected to announce $1.3 billion of military aid for Ukraine within the next few days that includes air defenses, counter-drone systems, exploding drones, and ammunition, a July 18 Reuters article reported.
As we noted above, European nations and Canada have also been boosting their military budgets, as have other countries around the world. Lockheed received a $3 billion order earlier this month from the Israel Ministry of Defense to supply the country with 25 F-35s, which will expand that nation’s fleet of the aircraft to 75. The Biden administration has agreed to let Turkey buy 40 of Lockheed’s F-16s and modernization kits for other aircraft. The Czech Republic has expressed interest in the F-35, and Germany put in an order for 35 of the planes late last year. Lockheed says its F-35 backlog stands at 421 aircraft.
(3) Lessons from Ukraine. Russia’s risky invasion of Ukraine may imply that it will take similar risks in the future. Defense ministers in NATO countries are increasing their defense budgets because of the “elevated risks that they perceive to their own countries for some foreseeable future,” said Lockheed CEO James Taiclet on the earnings conference call.
In addition, Ukraine has used far more munitions than existing wargame models have implied. So in addition to replacing the munitions used by Ukraine, the US and allies’ stockpiles will need to be larger than they’ve been in the past to deter future conflicts by showing potential adversaries that they can defend themselves for a long period of time, said Taiclet.
“We think this is a longer term, essentially, sea change in national defense strategy for the US and for our western allies, including Japan and the Philippines and others,” said Taiclet. “The lessons and the future demand for these kinds of products is going to stay elevated for a very long time, we think.”
As for Lockheed, it has learned that it needs a stronger, more resilient supply chain that can scale quickly if necessary. The company is also looking to expand production internationally.
(4) Industry data. US industrial production of defense and space equipment has been robust, climbing 5.2% y/y in June, while total industrial production fell 0.4% y/y last month (Fig. 1 and Fig. 2). Likewise, shipments of defense goods rose 7.1% y/y in June, while shipments of defense aircraft and parts increased 7.0% y/y (Fig. 3 and Fig. 4).
Despite strong production, the S&P 500 Aerospace & Defense industry’s stock price index has moved sideways for the better part of this year so far (Fig. 5). It’s down 2.1% ytd through Tuesday’s close, underperforming the S&P 500’s 18.6% climb. That’s a reversal from last year, when the industry’s stock price index climbed 15.5%, way outperforming the S&P 500’s 19.4% decline that year.
The S&P 500 Aerospace & Defense industry’s constituent companies collectively have grown both top and bottom lines in recent years. Revenue grew by 3.2% in 2022, and it’s expected to increase by 7.7% this year and 8.2% in 2024 (Fig. 6). The industry’s earnings grew by 1.8% in 2022, and analysts’ consensus estimates target earnings growth of 41.8% in 2023 and 27.4% next year (Fig. 7). The industry’s share price index has a forward P/E of 21.6, near the high end of the range over the past 29 years (Fig. 8). But after hitting some bumps in recent years, Lockheed’s forward earnings multiple of 16.5 is below the industry’s.
China: Debt Is Such a Drag. China’s government needs to put forward a comprehensive debt restructuring plan to end the two-year drip, drip, drip of bad news from real estate development companies having difficulties meeting their debt obligations. JPMorgan estimates that 50 property developers have defaulted on $100 billion of offshore bonds over the past two years, and the bad news continued this week, sending the price of China’s dollar-denominated junk bonds tumbling. They’re now down 10% ytd, according to a July 19 Bloomberg article.
Here’s a look at some of the recent news that has spooked the market:
(1) Latest default hits. Greenland Holding Group defaulted on $432 million of debt Wednesday. The country’s seventh largest property developer missed an amortization payment on a 6.75% dollar-denominated bond due in 2024. Greenland, which is partially owned by local governments, had extended payments on its dollar bonds last year. The default comes even after Shanghai officials told local state-owned enterprises to buy $350 million of new Greenland debt in late 2021, Reuters reported in a March 15, 2022 article.
Greenland “built Sydney’s tallest residential tower and has billions of dollars worth of projects in London, New York, Los Angeles, and Paris. At home, its projects include construction of the tallest building in northwest China and it is heavily involved in building subways, highways and bridges,” Reuters reported.
(2) More negotiations proposed. Sino-Ocean Group Holding, a Beijing-based real estate state developer, proposed extending by one year the repayment of a local note worth $277.3 million that matures on August 2. The firm reportedly has offered to pay only interest and has asked to extend its maturity, a July 19 Reuters article reported. Sino-Ocean Group also has a payment due later this month on an offshore bond.
Separately, Dalian Wanda Group, China’s largest commercial property firm, warned that it was short the funding needed to make a $400 million payment on a dollar-denominated bond due in 2024. The bond fell 15.3 cents on the dollar to 27 cents on Wednesday.
(3) Future problem? Shui On Land reportedly has been trying to identify bondholders, an action often taken prior to payment delays. Its 5.5% note due in 2025 fell 10.3 cents to 57 cents on the dollar. However, the company said its efforts were part of an investor relations exercise to better understand how its bond investor base has changed in order to enhance communication.
(4) That’s not chump change. China Evergrande Group, which defaulted on its debt in 2021, reported that it lost $81 billion in 2021 and 2022 due to writedowns of properties, return of lands, losses on financial assets, and financing costs, a July 18 CNBC article reported. The company’s debt has risen to $340 billion, and the company says it has $350 billion in assets; but it has struggled to turn those assets into cash to pay bondholders. Trading in Evergrande’s shares has been suspended since last year, and the company has warned that its finances “indicate the existence of material uncertainties that may cast significant doubt on the Group’s ability to continue as a going concern,” a July 18 AP article reported.
Disruptive Technologies: Quantum Leaps. The promise of quantum computing—and what humans can accomplish with such vast amounts of computing power—makes scientists giddy. Google, Amazon, Microsoft, and IBM are leading the race to develop these computers and offer access to them in the cloud.
Here are some recent developments in the area:
(1) Google boasts supremacy. The king of search claims quantum supremacy. The latest iteration of its Sycamore quantum system has 70 qubits and a quantum processor that’s 241 million times more powerful than the company’s previous offering. Google’s quantum computer “can outperform the most powerful supercomputer in the world, running calculations that would take the massive 1.68 exaflops ‘Frontier’ system at Oak Ridge National Laboratories 47 years to complete,” explained a July 18 article in The Next Platform.
(2) Amazon plays host. Amazon Bracket is a service that lets users build their own quantum algorithms and then test them on quantum computers in Amazon’s cloud. Amazon reports that a number of organizations are tapping into quantum computing in Amazon’s cloud, including the Technology Innovation Institute, a scientific research center that’s a part of Abu Dhabi’s Advanced Technology Research Council; Volkswagen Group; Fidelity Center for Applied Technology; Amgen; multinational power company Enel; Aioli, an insurance agency; and the Institute for Quantum Computing at the University of Waterloo.
(3) More qubits than others? Last fall, IBM reported that it has developed a 433-qubit Osprey processor, more qubits than any other IBM processor and more than triple those of the Eagle processor made public in 2021. IBM Quantum System’s goal is to have a system with 4,000 or more qubits by 2025.
IBM also hosts a number of companies that want to tap into more than 20 quantum computers in the cloud. The company said German conglomerate Bosch, telecom provider Vodafone, and French bank Credit Mutuel Alliance Federale all have joined IBM’s Quantum Network.
(4) New particles discovered. Qubits are prone to error, so Microsoft has been building a better mousetrap. Company scientists are building qubits from quasiparticles, “which are not true particles but collective vibrations that can emerge when particles like electrons act together,” a June 21 article in New Scientist reported. Called “Majorana zero modes,” these antiparticles have a charge and energy that equate to zero and make “unprecedentedly reliable” qubits.
(Hot) Global Soft Landing
July 19 (Wednesday)
Check out the accompanying pdf and chart collection.
Executive Summary: Globally, economic growth has been on a downtrend since mid-2022 according to our Global Growth Barometer. Recent drags include the hot summer, Americans’ weaker demand for imports as they spend more on travel and other services, and headwinds in Europe and China unique to them. … Since we don’t expect the US to enter a recession anytime soon, we expect the bull market in stocks to continue. Our new S&P 500 targets for year-end 2024 and 2025 suggest the bull market has legs. … And: Joe explains the importance of the MegaCap-8’s expected earnings turnaround. With these eight stocks representing 27% of the S&P 500’s market cap, their outperformance could power the entire market higher.
Global Economy: Hot Summer Weighing on Growth. It has been a very hot summer around the world, and summer isn’t over yet. Record-high temperatures in many places around the world are likely to weigh on global economic growth during July and maybe August too. Global economic growth was lackluster going into the hot summer. Consider the following:
(1) Eurozone. The Eurozone is in a mild recession, with real GDP falling during the past two quarters. Economic output in the 20 nations that use the euro currency declined 0.4% (saar) during Q1-2023, after a Q4-2022 contraction of the same magnitude. Consumer spending in the Eurozone fell 1.2% (saar) in the first three months of this year after falling 4.0% in the previous quarter. Imports were also down sharply as demand for goods and services shrank.
The volume of retail sales excluding automobiles and motorcycles in the Eurozone has been falling since early 2022 (Fig. 1). It is down 2.9% y/y. The region’s Economic Sentiment Indicator has fallen below 100 since mid-2022 (Fig. 2). That suggests that real GDP, which was up just 1.0% y/y, could turn negative soon.
(2) China. China’s real GDP rose 6.3% y/y during Q2 but fell 1.8% q/q (saar) (Fig. 3). Inflation-adjusted retail sales rose 3.1% y/y through June (Fig. 4). That was relatively weak considering that many areas of China were depressed by government-mandated pandemic lockdowns last year. Indeed, a year ago during June 2022, real retail sales was basically flat y/y.
The Chinese government has been trying to stimulate domestic consumption without much success. The 24-month annualized growth rate of real retail sales has been in the low single digits since early 2020. Of course, some of that weakness was related to pandemic restrictions. But the growth rate in this series has plunged from the high teens during 2010 and 2011, which we attribute mostly to China’s rapidly aging demographic profile. China has turned into the world’s largest nursing home over the past few years. That’s the legacy of the government’s horrible One-Child Policy from 1979 to 2015.
(3) United States. The US economy is performing better than the other major developed economies. However, American consumers have been pivoting toward spending less on goods and more on services. As a result, inflation-adjusted merchandise imports peaked at a record high during March 2022 and fell 8.3% through May of this year (Fig. 5).That’s after these imports jumped 45.2% from their post-lockdowns low during May 2020 through last year’s peak.
All those imports caused a major backup at the West Coast ports as measured by the 12-month sum of container traffic at those ports during 2021 and 2022 (Fig. 6). But that series was back down to its 2020 low during June of this year.
June’s US retail sales report, released yesterday by the Census Bureau, showed that retail sales rose just 0.2% m/m during June, following May’s 0.5% increase, which was revised up from 0.3%. Excluding gasoline station sales, retail sales rose 0.3% last month. Excluding building materials and food services, it was up 0.4% (Fig. 7).
On an inflation-adjusted basis, retail sales has remained relatively flat since mid-2021 (Fig. 8).
More Americans than ever are traveling and spending more abroad during their vacations (Fig. 9). However, the weakness in their demand for imported merchandise is probably on balance still a drag on the global economy.
(4) Global Growth Barometer. Our Global Growth Barometer (GGB) rose slightly last week, but it remains on a downward trend since mid-2022 (Fig. 10). Our GGB is simply the average of the Brent crude oil nearby futures price and the CRB raw industrials spot price index (multiplied by 2 and divided by 100).
Strategy I: Raising Our S&P 500 Targets. In case you missed it, Joe and I raised our forward P/E and price targets for the S&P 500 in our Sunday, July 16 QuickTakes. (FYI: The “forward” P/E is the multiple based on forward earnings, which is the time-weighted average of analysts’ consensus operating earnings-per-share estimates for the current year and following one.)
In our November 3, 2020 Morning Briefing, we wrote that “we think the S&P 500 bottomed on October 12 and see a few potentially uplifting developments to come.” On January 9, 2023, we predicted: “The S&P 500 will move higher during the first half of the year, rising to 4500 and then stall there until a year-end rally drives it up to a new record high of 4800 in anticipation of higher earnings in 2024.”
Along the way, we trimmed our year-end target to a more reasonable 4600. On June 5, we wrote: “Is all the AI euphoria leading the stock market into another ‘MAMU’—'Mother of All Meltups’? If so, our 4600 target for the S&P 500 by year-end might prove conservative, not controversial.”
The S&P 500 is now almost at 4600. It closed at 4556.27 on Tuesday. Rather than raise our year-end target, we are raising our expectations for what the bull market could deliver through the end of 2024 and beyond. We think that 5400 is achievable by the end of next year. If that happens, then 5800 would be our target for the end of 2025. In other words, we think that the bull market has staying power.
That’s because we give only 25% odds to a recession scenario over the next two and a half years. So we estimate that S&P 500 earnings per share should be $225 this year, $250 next year, and $270 in 2025 (Fig. 11). If forward earnings rises to $270 at the end of next year and $290 at the end of 2025, as we expect, then the S&P 500 would be 5400 at the end of 2024 and 5800 at the end of 2025 assuming a forward P/E of 20.0 for both forecasts (Fig. 12).
That might seem like an awfully high valuation multiple. However, the S&P 500’s forward P/E has rebounded from 15.0 to 19.6 since October 12 thanks to the rebound in the MegaCap-8. These stocks now account for a record-high 27.3% of the market capitalization of the S&P 500, and they are likely to remain the market’s leaders for the foreseeable future.
Strategy II: MegaCap-8 Leading the Way. The MegaCap-8 group of stocks (i.e., Alphabet, Amazon, Apple, Meta, Microsoft, Netflix, Nvidia, and Tesla) has been leading the S&P 500 higher in a big way so far in 2023. While they’re not as cheap as they were at the start of this year, when they were very cheap, they are still less expensive than they were during 2020-21, when their forward P/E flirted with 35 (Fig. 13). Their improved performance this year in part reflects much improved revenues and earnings growth prospects for most of the eight companies.
The MegaCap-8 still accounts for a large part of the S&P 500’s market capitalization, and their soon-to-be-released results for Q2—which come on the heels of aggressive cost-cutting—could continue to set the tone for the S&P 500’s performance. I asked Joe for an update on the MegaCap-8. Here it is:
(1) Market capitalization. The combined market cap for the MegaCap-8 tumbled 41.5% in 2022 but has since rebounded 63.6% ytd to an 18-month high of $11.5 trillion through Friday’s close (Fig. 14). Through Friday’s close, the S&P 500’s market cap is up 17.1% ytd with the MegaCap-8 stocks included but up only 5.5% without them. The MegaCap-8’s market-capitalization share of the S&P 500 has recovered too, soaring from 19.4% at the start of the year to a record-high 27.3% during the July 14 week (Fig. 15).
(2) Valuation. The MegaCap-8’s forward P/E rose above 30.0 in mid-June for the first time in 15 months. Since the January 6 week, the forward P/E has soared 46% to 31.2 as of the July 14 week from 21.1. However, it remains below the record-high of 38.5 during the August 28, 2020 week. Since their January 6 bottom, forward P/Es have risen for all of MegaCap-8 stocks, as Joe shows below.
Here’s how much valuation has changed for each of the MegaCap-8 stocks since the S&P 500’s January 6 bottom: Alphabet (up 28% to 21.3 from 16.6), Amazon (27% to 62.2 from 48.8), Apple (up 45% to 29.4 from 20.3), Meta (up 43% to 22.9 from 16.0), Microsoft (up 45% to 31.1 from 21.4), Netflix (up 14.2% to 33.6 from 29.4), Nvidia (up 40% to 48.4 from 34.5), and Tesla (up 201% to 66.2 from 22.0). Tesla’s eye-popping valuation gain has come at the expense of declining forward earnings, as the company has cut vehicle prices sharply to maintain sales growth.
(3) Forward revenues and earnings. Seven of the MegaCap-8 companies have enjoyed both rising forward revenues and rising forward earnings so far in 2023. The only laggards are Apple’s forward revenues and Tesla’s forward earnings. As a group, the MegaCap-8’s forward revenues has risen 4.4% ytd, and its forward earnings has soared 12.3%—trouncing the S&P 500’s forward revenues rise of 3.1% ytd and forward earnings gain of only 1.9% ytd.
Here’s how each of the MegaCap-8 companies’ forward revenues and earnings forecasts have performed ytd: Alphabet (forward revenues up 3.2%, forward earnings up 11.9%), Amazon (5.3, 22.8), Apple (-1.4, 1.6), Meta (9.9, 66.2), Microsoft (4.0, 5.7), Netflix (6.8, 22.6), Nvidia (70.5, 118.2), and Tesla (2.2, -17.2). Nvidia’s surge in such a short period on expectations for AI chip sales is stunning, and must rank near the all-time top (i.e., since consensus forecasts were first calculated over 40 years ago).
(4) Forward profit margin. Through the July 6 week, the S&P 500’s forward profit margin has dropped to 12.4% from 12.6% at the start of the year (Fig. 16). The MegaCap-8’s collective margin has surged from 18.0% to 19.5%. Among the MegaCap-8’s, all but Tesla have seen their forward profit margin rise ytd: Alphabet (up from 23.0% to 24.2%), Amazon (3.0 to 3.7), Apple (25.2 to 26.0), Meta (21.1 to 27.0), Microsoft (34.6 to 35.2), Netflix (14.1 to 16.2), Nvidia (36.7 to 47.1), and Tesla (15.9 to 12.7) (Fig. 17).
(5) Q2 revenue and earnings outlook. During 2022, the MegaCap-8’s revenues and earnings growth sagged. Quarterly revenues growth remained positive on a y/y basis but dropped to single-digit percentage rates. Earnings fared much worse, falling y/y for four straight quarters through Q1-2023.
But both are expected to turn positive again in Q2-2023. The MegaCap-8’s revenues are forecasted to rise 7.8% y/y in Q2-2023 following a 4.6% rise in Q1-2023, and earnings are expected to gain 16.2% y/y after the prior quarter’s 3.5% decline. In stark comparison, the S&P 500’s revenues are forecasted to decline 0.9% y/y during Q2-2023, while its earnings drop 8.1% y/y.
Dismissing The Dismal Definition Of Economics
July 18 (Tuesday)
Check out the accompanying pdf and chart collection.
Executive Summary: The conventional wisdom is that economics is the study of how best to allocate scarce resources—a dismal proposition. I disagree: Economics is all about using technology to create and spread abundance—a much more uplifting definition. The dismal framing taught in universities seems to have produced economists biased toward pessimism. Perhaps that’s why most—after ample evidence that the economy is thriving—are just starting to accept that a recession is not about to happen. … Today, we examine the consensus views of economic forecasters, including within the Fed, and supply context to their outlooks in the form of what inflation has been doing, especially wage inflation.
Weekly Webcast. If you missed Monday’s live webcast, you can view a replay here.
US Economy I: Scarcity vs Abundance. Economics is widely known as the “dismal science.” Economists have tended to be pessimistic ever since Thomas Malthus predicted that population growth would exceed the rate of increase in food supplies, resulting in mass starvation.
Modern-day economists were mostly introduced to the dismal science by reading Paul Samuelson’s famous Economics textbook, which also had a dismal spin. The latest (19th) edition of Economics (2010), by Samuelson and William Nordhaus, teaches students that economics “is the study of how societies use scarce resources to produce valuable goods and services and distribute them among different individuals.” This definition hasn’t changed since the first edition of this classic textbook was published in 1948.
That’s a relatively depressing definition of economics: Resources are scarce, and economists must determine the best way to distribute them. That’s led to lots of infighting within the profession between those who believe that the free market is the best way to divvy up the scarce resources and those who contend that the government should do it.
In my 2018 book Predicting the Markets, I objected to the dismal characterization of economics as follows:
“I’ve learned that economics isn’t a zero-sum game, as implied by the definition. Economics is about using technology to increase everyone’s standard of living. Technological innovations are driven by the profits that can be earned by solving the problems posed by scarce resources. Free markets provide the profit incentives to motivate innovators to solve this problem. As they do so, consumer prices tend to fall, driven by their innovations. The market distributes the resulting benefits to all consumers. From my perspective, economics is about creating and spreading abundance, not about distributing scarcity.”
US Economy II: Today’s Dismal Scientists. Over the past year or so, economists mostly have been very pessimistic about the economic outlook. The vast majority expected a recession as a result of the tightening of Fed policy in the face of mounting inflation. For a while during 2021 when inflation was starting to take off, it was widely perceived that inflation was a transitory problem. But during 2022, the consensus among economists shifted: Inflation was viewed as a more persistent and pernicious problem that could only be stopped with a Fed-engineered recession.
But the economy has defied its detractors, proving to be remarkably resilient. More recently, inflation has proven to be more transitory than persistent, as we wrote in yesterday’s Morning Briefing. As a result, the consensus view among economists is turning less pessimistic.
Indeed, the July 15 WSJ included an article titled “Economists Are Cutting Back Their Recession Expectations.” It is subtitled: “Forecasters still expect GDP to eventually contract, but later, and by less, than previously.” Here’s more:
(1) The article observes: “Easing inflation, a still-strong labor market and economic resilience led business and academic economists polled by The Wall Street Journal to lower the probability of a recession in the next 12 months to 54% from 61% in the prior two surveys.
“While that probability is still high by historical comparison, it represents the largest month-over-month percentage-point drop since August 2020, as the economy was recovering from a short but sharp recession induced by the Covid-19 pandemic. It reflects the fact that the economy has kept growing even as the Federal Reserve has raised interest rates and inflation declined.”
Furthermore, the article explains: “Nearly 60% of economists said their main reason for optimism about the economic outlook is their expectation that inflation will continue to slow.” The survey of 69 economists was conducted July 7-12. That was mostly before June’s lower-than-expected CPI was released on July 12. It rose just 3.0% y/y last month, sharply lower than the peak of 9.1% in June 2022 and the slowest in more than two years.
(2) The Philly Fed’s Survey of Professional Forecasters, which started in Q4-1968, includes the “Anxious Index,” which is the probability of a decline in real GDP (Fig. 1). The survey asks panelists to estimate the probability that real GDP will decline in the quarter in which the survey is taken and in each of the following four quarters. The Anxious Index shows the probability they see of a decline in real GDP in the quarter after a survey is taken and the probability of a recession over the next four quarters (Fig. 2).
The Philly Fed’s Q2 survey, dated May 12, showed that the forecasters saw less risk of negative growth during Q2 than previously estimated but higher risk during subsequent quarters. The estimate for Q2 was 38.8%, down from the previous estimate of 42.4%. The Q1-2024 estimate saw the largest revision in the risk of a contraction in real GDP. The forecasters pegged the risk at 39.3%, marking an upward revision from 31.8% in the previous survey three months earlier.
(3) The Conference Board, which compiles the Index of Leading Economic Indicators (LEI) and the Index of Coincident Economic Indicators (CEI), also maintains a US recession probability model. The latest version, dated April 12, 2023, calculated that the recession probability estimate was “near 99 percent pointing to the likelihood of a recession in the US within the next 12 months.” The proprietors of the model observed: “Despite better-than-expected consumer spending recently, the Federal Reserve’s interest rate hikes and tightening monetary policy will lead to a recession in 2023.” This outlook is consistent with the LEI, which peaked at a record high during December 2021 and is down 9.4% since then through May (Fig. 3). On the other hand, the CEI increased 2.3% over this same period to a new record high (Fig. 4).
(4) Even the Fed’s staff economists have been forecasting a recession. The January FOMC minutes noted: “The sluggish growth in real private domestic spending expected this year and the persistently tight financial conditions were seen as tilting the risks to the downside around the baseline projection for real economic activity, and the staff still viewed the possibility of a recession sometime this year as a plausible alternative to the baseline.”
The March FOMC minutes indicated that a mild recession forecast was now the staff’s baseline: “Given their assessment of the potential economic effects of the recent banking-sector developments, the staff’s projection at the time of the March meeting included a mild recession starting later this year, with a recovery over the subsequent two years.” That outlook was maintained in the May FOMC minutes and the June FOMC minutes.
US Economy III: Waller’s Scenario. Among the Fed officials who spoke publicly before the Fed’s blackout period started this past Saturday was Fed Governor Christopher Waller. He did so in a speech titled “Big Shocks Travel Fast: Why Policy Lags May Be Shorter Than You Think” on Thursday, July 13 at the Money Marketeers of New York University. That was a day after the release of June’s lower-than-expected CPI report for June. Waller said:
“Yesterday, we received new data on consumer price index (CPI) inflation. After 5 consecutive monthly readings of core inflation of 0.4 percent or above, this rate dropped by half in June, to 0.2 percent. This is welcome news, but one data point does not make a trend. Inflation briefly slowed in the summer of 2021 before getting much worse, so I am going to need to see this improvement sustained before I am confident that inflation has decelerated. …
“While I expect inflation to eventually settle near our 2 percent target because of our policy actions, we have to make sure what we saw in yesterday’s inflation report feeds through broadly across goods and services and that we do not revert back to what has been persistently high core inflation. The robust strength of the labor market and the solid overall performance of the U.S. economy gives us room to tighten policy further.”
Waller sees a 25bps hike in the federal funds rate at next week’s meeting of the FOMC. He sees another 25bps before year-end if the economy remains strong, the labor market remains tight, and inflation shows signs of heating up rather than cooling off.
US Economy IV: One of Powell’s Favorite Charts. While the CPI inflation rate is showing more signs of being transitory for both goods and services, wage inflation remains relatively persistent. Fed Chair Jerome Powell addressed this issue in a November 30, 2022 speech titled “Inflation and the Labor Market.”
Powell observed: “In the labor market, demand for workers far exceeds the supply of available workers, and nominal wages have been growing at a pace well above what would be consistent with 2 percent inflation over time. Thus, another condition we are looking for is the restoration of balance between supply and demand in the labor market.”
He provided an interesting chart comparing supply and demand for labor. The former is simply the same as the size of the labor force, while the latter is the sum of household employment and job openings (Fig. 5). It shows that over the past two years or so, demand for labor has well exceeded its supply. That’s boosting wage inflation.
The spread between labor demand and supply is reasonably well correlated with wage inflation, using either the average hourly earnings for all production and nonsupervisory workers (AHE-P&NS) or wages and salaries in the Employment Cost Index (ECI) (Fig. 6 and Fig. 7). The former is available monthly since 1964 and accounts for about 80% of payroll employment, while the latter is quarterly and available since mid-1975 (Fig. 8). Here are their latest readings:
(1) AHE-P&NS rose 4.7% y/y through June. It is down from last year’s peak of 7.0% during March.
(2) ECI wages and salaries rose 5.1% y/y during Q1-2023, down from last year’s peak of 5.7% y/y during Q2-2022.
In his recent press conferences, Powell has said that he would like to see wage inflation down to around 3.0% y/y, consistent with 2.0% price inflation plus 1.0% growth in productivity. Then again, at his May 3 presser, he ambiguated as follows: “I do not think that wages are the principal driver of inflation. … I think there are many things. I think wages and prices tend to move together. And it’s very hard to say what’s causing what. … I’ve never said that … wages are really the principal driver, because I don’t think that’s really right.”
Transitory Inflation Sets Stage For Immaculate Disinflation
July 17 (Monday)
Check out the accompanying pdf and chart collection.
Executive Summary: Big banks’ top managements sounded relatively sanguine about the economy as they reported solid Q2 results, though JP Morgan CEO Jamie Dimon hasn’t totally abandoned the recession storyline that spooked investors a year ago. … There are two versions of the bearish economic script now, one seeing recession at the hands of savings-drained consumers and other seeing recession at the hands of the inflation-fighting Fed. We counter these narratives with data on consumers and liquidity and by making our case for “immaculate disinflation,” the notion that disinflation doesn’t require a recession.
YRI Weekly Webcast. Join Dr. Ed’s live webcast with Q&A on Mondays at 11 a.m. EST. You will receive an email with the link one hour before showtime. Replays of the weekly webcasts are available here.
US Economy I: Dimon in the Rough. Some of the largest banks in the country— JPMorgan Chase, Wells Fargo, and Citigroup—kicked off the official start to earnings season on Friday with relatively upbeat results and comments from their top managements. All three banks beat earnings expectations for Q2. BlackRock did so as well.
In June 2022, JPMorgan Chase CEO Jamie Dimon warned that the economy could be in a recession by about now. Now he sounds more optimistic. American consumers are still driving the US economy, which “continues to be resilient,” Dimon stated on Friday. “Consumer balance sheets remain healthy, and consumers are spending, albeit a little more slowly,” he said. However, he once again noted that consumers’ excess savings are slowly being drained. While job growth remains strong, he said there are still “salient risks in the immediate view,” including stubborn inflation, the risk of more rate hikes from the Federal Reserve, and geopolitical tensions. “While we cannot predict with any certainty how these factors will play out, we are currently managing the firm to reliably meet the needs of our customers and clients in all environments,” he said.
Asked whether moderating inflation has made him more optimistic that a recession could be avoided, Dimon said, “I don’t know if it’s going to lead to a soft landing, a mild recession or a hard recession.” He cited “tailwinds” in the economy that “are receding over time,” including the strength of consumer spending amid fiscal and monetary stimulus. Headwinds he sees include inflation, high US government debt, high interest rates, the Fed’s efforts to shrink its balance sheet, and the war in Ukraine. He noted that the war has been going on for 500 days and could still “get worse.”
Last June, Dimon contributed to investors’ fears of a recession and a prolonged bear market in stocks by saying he was certain that a hurricane was coming, though how bad a hurricane he didn’t know: “That hurricane is right out there down the road coming our way.” But nobody knows if it’s “a minor one or Superstorm Sandy.”
US Economy II: Consumers Still Doing What They Do Best. There’s not much left for the bears to growl about, but Jamie Dimon continues to side with them. There are two versions of the bearish script now: Either consumers run out of excess savings, resulting in a consumer-led recession, or the Fed continues to tighten, fearing that a more resilient-than-expected economy will keep inflation above its 2.0% target. The bears don’t believe in immaculate disinflation, the idea that inflation can come down without a recession pulling it down. We do.
Let’s challenge the first bearish script before turning to the second one:
(1) Consumers still have lots of cash. Dimon is right, of course, about consumers’ excess savings. By most estimates, they accumulated about $3.0 trillion of it during the pandemic, including what they saved during the lockdown and what they didn’t immediately spend of their government pandemic relief checks (Fig. 1). Now it is widely estimated that they have $0.5 trillion left, which should be depleted over the next few months. Then watch out for a consumer-led recession.
This is essentially the same argument made by today’s latter-day monetarists, who observe that M2 peaked at $21.7 trillion during July 2022 and fell by $897 billion through May, led by a $737 billion drop in commercial banks’ total deposits from the final week of July 2022 through the week of July 28 (Fig. 2). Today’s monetarists correctly observe that some of the decline in deposits is attributable to the Fed’s ongoing quantitative tightening program.
Nevertheless, M2 is still about $1.0 trillion above its pre-pandemic trendline, and its demand deposits component is a whopping $2.0 trillion above its pre-pandemic trendline. The sum of total banks deposits plus money market mutual funds (MMMF) rose to a record $22.8 trillion during the July 5 week and is still $2.0 trillion above its pre-pandemic trendline (Fig. 3).
Previously, we observed that the Baby Boom generation held $8.9 trillion in demand deposits and MMMFs at the end of Q1-2023, or about $2.5 trillion more than at the end of Q4-2019, just before the pandemic (Fig. 4). That’s about $1.5 trillion above its pre-pandemic trend. (See our “Baby Boomers Retiring On $75 Trillion In Net Worth,” Morning Briefing, June 26, 2023.)
(2) Consumers have lots of income. We’ve also countered the consumers’ doubters by observing that both inflation-adjusted wages and total disposable income have been rising again in recent months after mostly stagnating during 2021 and 2022. Real average hourly earnings rose 1.5% over the past 11 months through May (Fig. 5). This series is once again climbing along its 1.2% annual growth trendline, as it has been since the mid-1990s.
Real disposable personal income mostly fell during H2-2021 and H1-2022 as price inflation outpaced wage inflation. It has been trending higher since June 2022 and is up 4.4% since then through May (Fig. 6).
Consumers also have other sources of record unearned income including (during May, at a seasonally adjusted annual rate [saar]): proprietor’s income ($1.9 trillion), interest income ($1.8 trillion), dividend income ($1.7 trillion), Social Security benefits ($1.4 trillion), and rental income ($0.9 trillion) (Fig. 7). May’s total was $7.7 trillion, equivalent to 65% of wages and salaries (Fig. 8).
(3) Consumers are turning more optimistic. We’ve often observed that American consumers spend money when they are happy and spend even more money when they are depressed, if they have money to spend (as they certainly do currently). We note that the Consumer Sentiment Index (CSI) fell to a record low of 50.0 during June 2022, which was well below the 2020 lockdown low of 71.8 during April 2020. The CSI rose to 72.6 during the first half of July (Fig. 9). That was just above its pandemic low. Inflation has clearly been depressing consumers and more than offsetting the positive effects of the strong labor market.
What have consumers been doing to counter their depression? They’ve been going shopping to release some dopamine in their brains to make themselves feel better. After the Covid lockdowns, they went on a buying binge for goods. Over the past year, they’ve pivoted to purchasing more services (Fig. 10).
(4) Corporations have lots of cash. Consumers aren’t the only ones with tons of cash. Corporate cash flow rose to a record high during Q4-2022 and edged down to $3.1 trillion (saar) during Q1-2023 (Fig. 11). The Fed’s measure of liquid assets held by nonfinancial corporate business was a near-record $6.5 trillion and $3.6 trillion with and without their holdings of equities and mutual fund shares (Fig. 12).
(5) The federal government’s deficit is widening again. Meanwhile, the federal government continues to pump liquidity into the economy with its huge and widening budget deficit. It rose to $2.3 trillion over the 12 months through June, as outlays increased while revenues decreased (Fig. 13 and Fig. 14).
US Economy III: The Case for Immaculate Disinflation. The second bearish script is that it takes a recession to bring inflation down. Here’s how that narrative goes: While inflation has moderated since last summer, it remains well above the Fed’s 2.0% target. So the Fed will have to raise interest rates further until that causes a recession, which would bring inflation down to 2.0% for sure. A few Fed officials suggested as much in reaction to last week’s better-than-expected CPI and PPI inflation readings for June. They apparently agree with the bears that expecting an immaculate disinflation (i.e., without a recession) is delusional. We don’t agree.
Consider the following counterpoints:
(1) So far, so good for goods. Last week was a good one for disinflationists. June’s reports on expected inflation, the CPI, and the PPI showed that inflation continues to moderate without an economy-wide recession. According to the University of Michigan’s Survey Research Center, consumers’ one-year-ahead expected inflation fell to 3.3% last month, the lowest readings since March 2021; it was little changed at 3.4% in mid-July. On a y/y basis, the headline and core CPI inflation rates fell to 3.0% and 4.8%, the lowest readings since March 2021 and October 2021. The PPI for final demand was up just 0.1%.
(2) Transitory after all. The CPI inflation rate for goods has turned out to be transitory, peaking last summer and falling to -1.2% y/y, with the CPI durable and nondurable goods down 0.8% and 1.3% respectively during June (Fig. 15). Inflation has been one of the shockwaves unleashed by the pandemic that is abating.
Excessively stimulative fiscal and monetary policies during the pandemic resulted in a buying binge for goods that overwhelmed global supply chains, as can be seen in the New York Fed’s Global Supply Chain Pressure Index (Fig. 16). This index soared from 0.11 during October 2020 to 4.31 during December 2021. It was down to -1.20 during June.
(3) Rent inflation is also transitory. In the CPI, rent inflation tends to be a laggard because it reflects rents on all outstanding leases. It is only now showing signs of peaking, while inflation in indexes of new rental leases peaked in early 2022 and are down sharply since then (Fig. 17). The headline and core CPI inflation rates excluding shelter were down to only 1.7% and 2.7% during June (Fig. 18).
(4) One counter example. The naysayers say that that the history of the CPI inflation rate since 1921 shows that the only way to bring inflation down is with a recession (Fig. 19). There was just one exception, immediately following the end of World War II. We are arguing that the current situation may turn out to be the second historical exception.
(5) Inflation isn’t always and everywhere just a monetary phenomenon. What’s different this time is that the high inflation was mostly caused by transitory shockwaves related to the pandemic. As they abate, so does inflation. Monetary policy is an important driver of inflation, but it isn’t the only cause of inflation. Even the Great Inflation of the 1970s was attributable to various developments, including commodity shortages, two oil price shocks, and a widening federal budget deficit.
(6) Inflation is usually symmetrical. The history of the CPI inflation rate suggests that inflation tends to be very symmetric. Once it peaks, it tends to fall at the same pace as it went up. It’s doing so again during the current inflation cycle.
Travel, Banks & AI
July 13 (Thursday)
Check out the accompanying pdf and chart collection.
Executive Summary: Americans are traveling like never before, with record numbers flying to do so. Post-pandemic “revenge travel” has sent the valuations of travel-related stocks skyward too. Jackie takes a timely look at what could go wrong. … Also: Banks’ soon-to-be-released 2Q earnings will show investors whether large banks have continued to fare way better than small ones—shedding light on whether the valuations of the latter have been overly punished. The S&P 500 Regional Banks index has dramatically underperformed the S&P 500 Diversified Banks index ytd. … And: In our Disruptive Technologies segment, a look at how AI is being deployed to speed and improve drug development.
Consumer Discretionary: Everyone’s Got a Ticket To Ride. After being trapped at home during the Covid pandemic, “revenge travel” kicked in last year and continues to accelerate this summer. Everyone seems to be jetting off somewhere fabulous, ditching the Hamptons for a European holiday.
For the five days ending July 4, AAA predicted that 50.7 million Americans would travel 50 miles or more from home over the holiday—a new record surpassing the previous record of 49 million travelers in 2019. AAA also predicted that 4.17 million Americans would fly to their destination, 11.2% higher than in 2022 and 6.6% above the previous record of 3.9 million in 2019, a June 26 AAA press release stated.
Consumers’ travel bug is not news to investors, who have sent the share prices of travel-related companies to recent highs. Here’s the ytd price performance derby for some of the S&P 500’s travel-related industry indexes through Tuesday’s close: Hotels, Resorts & Cruise Lines (41.8%), Passenger Airlines (37.4), and Casinos & Gaming (28.5). All handily beat the S&P 500’s 15.6% ytd advance.
Their outperformance is just as dramatic when measured from the S&P 500’s low on October 12: Casinos & Gaming (58.2%), Hotels, Resorts & Cruise Lines (55.8), Passenger Airlines (48.3), and S&P 500 (24.1). Each of the three travel industries are among the top 11 performing industries in the S&P 500 since the 2022 market low.
Given the giddy optimism surrounding the industry, we thought it might be time to look for some clouds. Possible ice on the wings of travel stocks could be higher oil prices, rising expenses, or satiated demand. Here’s Jackie’s look at what could create turbulence that prevents travel stocks from flying higher:
(1) Oil prices could rise. The airline industry has benefitted from the sharp decline in fuel prices last year. The price of Brent crude futures has fallen 38% from its 2022 peak to its recent price of $79.40 a barrel (Fig. 1).
However, OPEC+ has made clear its intent to cut production to boost the price of oil. The organization has cut production by a total of 3.7 million barrels per day (mbd) in two different cuts in late 2022 and in April that will both extend through the end of 2024 (Fig. 2). That was followed in June by Saudi Arabia’s announcement that it will cut its production by roughly 1mbd to 9mbd through August. The oil producers must hope that their cuts will offset the unexpected increases in oil production from Russia and the US (Fig. 3). So far, their moves appear to have put a floor under the price of crude, which has edged higher in recent days.
(2) Expenses getting more expensive. Carnival Cruise Lines had lots of good news to report during its Q2 earnings release. Booking volumes were at an all-time high and 17% higher than they were in 2019. The company is making progress reducing its debt, and it has been able to increase prices.
However, the market initially focused on costs that the company warned would be higher than initially expected. It attributed the increase to incentive compensation programs, an increase in advertising, and a “slower-than-expected ramp-down in inflationary pressures than previously anticipated, particularly in the area of port costs, freight, crew travel due to air costs, and crew compensation,” said CFO David Bernstein on the company’s earnings conference call.
The company expects revenue to increase faster than expenses, allowing it to return to profitability in Q3 with earnings in the expected range of 70-77 cents per share. The forecast’s midpoint fell short of analysts’ 76-cent consensus, sending Carnival shares down 11% the day earnings were reported, a June 26 Reuters article reported.
Since then, the shares have rebounded, hitting a 52-week high, and analysts have increased their Q3 earnings estimate to 78 cents a share—higher than the company’s guidance. Carnival shares are up 134.5% ytd through Tuesday’s close, trumping the 104.9% ytd return turned in by Royal Caribbean shares and the S&P 500’s 15.6% ytd gain.
(3) Life after revenge travel. What happens after consumers take a revenge vacation or three? We have no doubt that vacations will still be taken, but perhaps spending on travel will increase more slowly or even plateau in 2024.
A breather certainly seems due. Personal consumption of air transportation has surged 38.0% from its pre-Covid record high in December 2019 of $124.7 billion (saar) to $172.1 billion this May. Likewise, spending on hotels and motels was $157.9 billion (saar) in May, up 26.5% from its December 2019 record high of $124.8 billion (Fig. 4).
(4) Analysts are awfully bullish. Travel industry analysts are optimistic that the industry’s good times will continue. They’re expecting strong earnings growth this year and next: S&P 500 Passenger Airlines (155.8% in 2023 and 19.1% in 2024), S&P 500 Hotels, Resorts & Cruise Lines (returning to a profit, 31.6%), and S&P Casinos & Gaming (returning to a profit, 73.6%) (Fig. 5, Fig. 6 and Fig. 7).
Because share prices have risen more sharply than earnings, forward P/E multiples in travel-related industries are lofty. The S&P 500 Casinos & Gaming industry’s forward P/E is 23.1, the highest of the three travel industries and near highest levels of the past two decades (Fig. 8). The S&P 500 Hotels, Resorts & Cruise Lines’ forward P/E is 18.6, not far from peaks of 20-23 in years past (Fig. 9). And the S&P 500 Passenger Airlines’ forward P/E is only 7.1, reflecting the industry’s cyclical nature (Fig. 10). (FYI: “Forward P/E” refers to the P/E based on forward earnings, which is the time-weighted average of analysts’ consensus operating earnings-per-share estimates for the current year and following year.)
Financials: Is Bigger That Much Better? Bank earnings start to roll in later this week, and we’ll finally learn the impact that commercial real estate loans and higher interest rates are having on loan portfolios and profits. Entering this reporting season, big banks’ stocks are sharply outperforming the stocks of their much smaller counterparts, which were tarred by the bankruptcies of Silicon Valley Bank, Signature Bank, and First Republic Bank this spring.
The S&P 500 Diversified Banks stock price index is essentially flat ytd through Tuesday’s close, while the S&P 500 Regional Banks index has fallen 33.9% ytd. The recent performance of the two industries is more similar. Over the past four weeks, the Diversified Banks stock price index is up 1.1% while the S&P 500 Regional Banks stock price index is up 0.6%.
Let’s take a look at some of the similarities and differences between the two industries:
(1) Revenue. The revenue of banks in Diversified Banks is expected to grow faster than that of their regional counterparts. The Diversified Banks typically have large capital markets and asset management businesses that can help offset troubles in commercial and retail lending. Smaller banks are typically more reliant on revenue thrown off by their loan books.
Analysts expect Diversified Banks’ revenue to grow by 9.2% in 2023 and to decline by 0.2% in 2024 compared to Regional Banks’ expected revenue growth of 5.3% this year and a decline of 1.3% in 2024.
(2) Earnings. Earnings at smaller banks may take a bigger hit than at their larger competitors if reserves for commercial real estate loans need to increase. Commercial real estate makes up a larger percentage of small banks’ loan books (44.2%) than large banks’ (13.4%).
Here are some of the different loan categories and the percentages they represent in large and small bank loan portfolios: C&I loans (large banks: 22.4%, small banks: 16.3%), residential real estate loans (23.9, 20.9), commercial real estate loans (13.4, 44.2), consumer loans (20.9, 11.6), credit cards & revolving credit (11.9, 4.7), automobile loans (6.5, 1.8), and construction & land development (2.0, 7.7) (Fig. 11).
Analysts expect earnings for companies in the S&P 500 Diversified Banks index collectively to grow 12.0% this year and dip by 1.1% in 2024. The Regional Banks’ earnings are forecast to drop slightly for two years in a row, by 3.2% this year and 2.5% in 2024 (Fig. 12 and Fig. 13).
(3) Valuation. The S&P 500 Diversified Banks and Regional Banks indexes have depressed forward P/Es of 9.1 and 7.5, respectively. Both forward P/Es are close to levels normally reached during a financial crisis, indicating a lot of bad news is priced in. If earnings reports are even slightly better than expected, these industries’ stocks seem positioned to benefit (Fig. 14 and Fig. 15).
Disruptive Technologies: AI Develops Drugs. Scientists are grabbing onto artificial intelligence (AI) as a new tool in their quest to develop drugs faster and less expensively. The latest news on this front arrived yesterday from Recursion, a self-described “techbio” company. It received a $50 million investment from Nvidia, and the two companies will work together to accelerate the development of Recursion’s “AI foundation models” for biology and chemistry that it intends to distribute to biotechnology companies using Nvidia’s cloud services.
“With our powerful dataset and NVIDIA’s accelerated computing capabilities, we intend to create groundbreaking foundation models in biology and chemistry at a scale unlike anything that has ever been released in the biological space,” said Recursion CEO Chris Gibson in a press release.
Here’s a look at how Recursion and other researchers are harnessing AI:
(1) Nvidia provides biotech services. BioNeMo Service is a group of AI models developed by various companies that Nvidia is hosting in its cloud to help scientists understand and develop new proteins, small molecules, and DNA. The service allows scientists to focus on the structure of the drug candidates instead of dealing with the supercomputing infrastructure that Nvidia offers.
Nvidia’s AI offerings to predict proteins’ 3D structures include AlphaFold2, which was developed by Google’s DeepMind, and ESMFold, which was developed by Meta. Users can access MegaMolBART, which was developed by AstraZenca and Nvidia to design small molecules, or DiffDock, designed by MIT’s Jameel Clinic to predict the binding structure of a small molecule ligand to a protein. These and other AI applications are focused on accelerating drug discovery, according to a March 21 Nvidia blog.
(2) Baker Lab’s AI offerings. The University of Washington’s Baker Lab has developed RFdiffusion, a model for generating new proteins that it claims is better than existing protein design methods. The scientists parlayed the theories behind an AI program to create pictures to develop a program that facilitates protein discovery.
“The software tool DALL-E produces high-quality images that have never existed before using something called a diffusion model, which is a machine-learning algorithm that specializes in adding and removing noise. Diffusion models for image generation begin with grainy bits of static and gradually remove noise until a clear picture is formed. Additional pieces of software guide this de-noising process so that the new images end up matching what was asked for,” explains a July 11 publication on the lab’s website. “We have developed a guided diffusion model for generating new proteins called RFdiffusion. With prior design methods, tens of thousands of molecules may have to be tested before finding a single one that performs as intended. Using the new method, the team had to test as little as one per design challenge.”
(3) Powerful proteins. Scientists are focusing on harnessing vast amounts of computing power to design new proteins because many believe that proteins can cure what ails us. In the February 25, 2021 Morning Briefing, we discussed how scientists were targeting proteins responsible for ailments like cancer, Parkinson’s, and Alzheimer’s—which could point the way to potential cures for those diseases as well.
These new AI platforms will speed up research into those areas, with some caveats. For example, scientists will need to understand what causes a disease if they hope to cure it. Not understanding exactly what causes Alzheimer’s makes it difficult to design a protein that treats the disease, explained David Baker of the University of Washington’s Baker lab in an interesting EL PAÍS interview dated February 20. But if the cause of the disease is known, a cure can be arrived at quickly using the AI models.
The Baker Lab has designed a nasal spray that protects humans against Covid-19. Within the next year, they expect to learn whether the spray is efficacious; if so, they would be able to develop other nasal sprays to fight other viruses. Developing proteins using this technology happens in weeks, not months, which means it could be an important tool in fighting future pandemics.
Sunny Or Cloudy Earnings Season?
July 12 (Wednesday)
Check out the accompanying pdf and chart collection.
Executive Summary: We see reasons for optimism that upcoming inflation releases and Q2 earnings news will please stock investors. We expect to learn that inflation continues to moderate in response to monetary policy that’s restrictive enough. And we expect Q2 earnings to be less bad than analysts are predicting. That’s because analysts’ estimates usually are too pessimistic at the start of reporting seasons and because the macroeconomic backdrop likely provided good revenue and earnings support. We look at some of the macro influences on specific industries. … And: Joe examines analysts’ ever-changing earnings growth expectations through various lenses—by index, sector, and in the context of historical trends.
US Inflation: Moderating Expectations. Monday was a sunny day for stocks and bonds following a few stormy days. That’s even though two Federal Reserve Bank (FRB) district presidents—Mary Daly, FRB-San Francisco and Loretta Mester, FRB-Cleveland—said that inflation remains too high and that more rate hikes will probably be necessary to bring it down. On the other hand, Raphael Bostic, president of FRB-Atlanta said the Fed’s “policy right now is clearly in the restrictive territory.” He is willing to be patient. We side with Bostic.
Monday’s good news on the economic front was that the FRB-New York’s survey of consumer expectations showed that the one-year-ahead inflationary expectations fell to 3.8%, the lowest since April 2021 and well below last summer’s readings of more than 6.5%. The three-years-ahead expectations edged down to 3.0% (Fig. 1). The one-year-ahead expectations series has been tracking the PCED inflation rate very closely since early 2021 (Fig. 2).
The question is whether the next batch of inflation data will be sunny as well. The same question applies to the Q2 earnings reporting season, which starts this week. For now, Joe and I are inclined to have sunny dispositions. Let’s see if we can keep them that way through this week’s inflation releases and the next few weeks’ earnings season.
US Earnings Season I: Low Expectations. The good news is that Q2 earnings expectations might be too negative for companies in the S&P 500/400/600 indexes (Fig. 3). Here are their actual Q1 and expected Q2, Q3, and Q4 y/y growth rates: the S&P 500 (-2.8%, -8.9%, -0.5%, 8.3%), S&P 400 (-7.2, -22.4, -5.7, 4.2), and S&P 600 (-3.0, -24.2, -10.5, 3.5). During periods of economic expansion, analysts tend to be too pessimistic at the start of earnings season. We expect that will be the case again this time.
Now let’s have a look at their annual forecasts:
(1) Earnings. Industry analysts are also still lowering their earnings estimates for S&P 500/400/600 for this year and for next year (Fig. 4). Here are their latest consensus expectations for earnings growth in 2023 and 2024: S&P 500 (0.5%, 11.7%), S&P 400 (-10.3, 13.0), and S&P 600 (-9.5, 13.5). The good news is that the forward earnings of the S&P 500/400/600 seem to be bottoming, as the higher expectations for next year’s earnings are getting more weight day by day.
(2) Revenues. Interestingly, there’s no recession in the analysts’ consensus expectations for S&P 500/400 revenues, though the same cannot be said for S&P 600 revenues (Fig. 5). The forward revenues of the S&P 500/400 rose to new record highs during the June 29 week. The forward revenues of the S&P 600 has been moving sideways in record-high territory since early 2022.
(3) Profit margins. So the earnings recession of the past year has been relatively mild and attributable to falling profit margins rather than falling revenues (Fig. 6). However, in recent weeks the forward profit margins of the S&P 500/400/600 seem to be bottoming, which explains why forward earnings are doing the same.
(FYI: “Forward earnings” and “forward revenues” are the time-weighted average of analysts’ consensus estimates for the current year and the following one. “Forward profit margins” are the margins calculated from forward earnings and forward revenues.)
US Earnings Season II: The Macro Environment. The weekly series for S&P 500 forward revenues is a very good coincident indicator of actual S&P 500 revenues (Fig. 7). Again, the former rose to a record high during the June 29 week.
Aggregate S&P 500 revenues is also highly correlated with business sales of goods and nominal GDP of goods (Fig. 8). There has been a growth recession among goods-producing industries since early last year. However, the S&P 500 also includes plenty of service-providing industries that have been doing very well. They’ve more than offset the weakness among the goods producers, which is why nominal GDP rose 7.2% y/y during Q1 to a record high.
So the macroeconomic environment should support the S&P 500’s Q2 revenues at a record high. Let’s briefly look at the macro variables that drive the revenues (and earnings) of selected industries:
(1) Banking. The Q2 earnings season starts off this week with the major banks reporting their results. Based on weekly data provided by the Fed, we know that loans and leases at the large domestic banks rose 3.0% y/y through the end of June (Fig. 9). We also know that allowances for losses increased 16.9% over the same period (Fig. 10). Banks undoubtedly responded to the banking crisis in early March by raising their deposit rates. That probably squeezed their net interest margins. Investment banking fees probably remained weak during Q2 given that the 12-month sum of new issues of US corporate bonds and stocks was $1.37 trillion, little changed from May’s $1.30 trillion, which was the lowest since fall 2012 (Fig. 11).
(2) Transportation. The airlines and cruise ships are packed with tourists. The restaurants and Taylor Swift concerts are also packed. The service-providing industries that cater to consumers are booming.
The trucks and railcars that haul merchandise to be sold by wholesalers and retailers to consumers aren’t doing as well, and their costs have gone up over the past year. Both the ATA truck tonnage index and intermodal container traffic have been weak lately, consistent with a growth recession in the goods-producing and distribution industries. Inflation-adjusted real consumer spending on goods has been flat since the second half of 2021 (Fig. 12).
(3) Industrials. Demand for civilian aircraft is booming. Orders for construction machinery are up 13.5% y/y through May to the highest reading since March 2008 (Fig. 13). They undoubtedly are getting a boost from the onshoring of manufacturing and public spending on infrastructure. Industrial machinery orders are down 6.4% y/y but should be rising soon, reflecting the boom in construction of manufacturing facilities.
(4) Semiconductors & high-tech hardware. The upturn in the forward earnings of the S&P 500 Semiconductors industry suggests that worldwide semiconductor sales have bottomed and should be on the rise over the rest of this year (Fig. 14). US industrial production of high-tech equipment rose to a new record high in May, led by an 11.1% y/y increase in computer & peripheral equipment output (Fig. 15).
(5) Restaurants & retailers. Restaurant sales are booming. Retail sales of food services & drinking places rose 8.0% y/y through May (Fig. 16). They now exceed spending on food consumed at home. Retail sales excluding building materials and food services have been flat since the second half of 2021. Sales of warehouse clubs and super stores also were flat y/y in April. The same can be said for housing-related retail sales (Fig. 17).
US Earnings Season III: A Sweet & Sour Outlook. Joe has been tracking the analysts’ consensus S&P 500’s quarterly earnings forecast each week since the series started in Q1-1994. Each quarter typically begins with analysts cutting their estimates gradually until reality sets in during the quarter’s final month, when some companies warn of weaker results. The combination of reduced forecasts for poorly performing companies and steady forecasts for companies quietly keeping good news close to their vests inevitably leads to an “earnings hook” in the charted data series, a.k.a. a positive surprise, when the results are released during the subsequent earnings reporting season.
During the strong recovery following the Great Virus Crisis (GVC), analysts scrambled to raise their forecasts for six straight quarters from Q2-2020 through Q3-2021, but they still didn’t come close to the actual earnings. The S&P 500 recorded unusually high double-digit percentage earnings beats for the first time since the aftermath of the Great Financial Crisis (GFC). The tide turned after Q1-2022. But signs of a turnaround in the y/y growth rates are emerging amid a slower pace of estimate cutting.
I asked Joe to separate the good news from the bad news:
(1) Less drastic estimate cutting. After falling slightly during H1-2022, the pace of estimate declines throughout the quarter accelerated in Q3-2022, when it dropped 6.6%. The pace of declines remained elevated during Q4-2022 and Q1-2023 but has abated for Q2-2023. The Q4-2022 estimate was down 5.9% during the runup to its earnings season; the Q1-2023 estimate was down a nearly similar 6.2%. The Q2-2023 estimate has dropped just 2.5% in its slowest decline since Q2-2022.
Q2-2023’s meager estimate decline marks a return to estimate cutting as usual. In the 105 quarters from Q2-1994 to the GVC in Q2-2020, the estimate fell during 90 quarters in the runup to earnings season, or more than 85% of the time. Half of the gains occurred following the GFC, when shell-shocked analysts mistimed the recovery.
Similarly, since the GVC, the quarterly estimate rose for six straight quarters through Q4-2021, before the earnings recovery began to run out of steam during H1-2022. Including Q2-2023, the quarterly estimate has now declined for six straight quarters.
(2) Fewer sectors have falling estimates now. Analysts had been too bullish and overestimated the length of the post-GVC boom in earnings, resulting in very broad quarterly earnings declines at the sector level during their runup to the earnings seasons through Q1-2023. At the peak of optimism in Q2-2021, nine of the 11 S&P 500 sectors had their quarterly estimate rise during the quarter. By Q1-2022, that count was down to five sectors (Energy, Financials, Real Estate, Tech, and Utilities) before dwindling to just one sector during Q3-2022 (Energy), Q4-2022 (Utilities), and Q1-2023 (Utilities). The broad sector declines have ended with the upcoming Q2-2023 season, with the Q2 estimate rising for four sectors (Fig. 18).
Among the four sectors, Industrials’ Q2-2023 estimate has risen 2.9% since the end of Q1-2023, edging out Communication Services (2.8%) and well ahead of Tech (0.7) and Consumer Discretionary (0.3). Financials has held up surprisingly well despite the regional bank crisis in early March, while Energy’s declines have accelerated.
Here's how much each sectors’ Q2-2023 estimate changed over the course of the quarter: Industrials (2.9%), Communication Services (2.8), Tech (0.7), Consumer Discretionary (0.3), Utilities (-2.9), Financials (-3.1), Health Care (-4.4), Real Estate (-6.2), Consumer Staples (-7.3), Materials (-8.0), and Energy (-15.2).
(3) More sectors to show y/y growth in Q2-2023, but Energy drags down the S&P 500. Six sectors are expected to record positive y/y percentage earnings growth in Q2-2023, up from five sectors doing so in Q1-2023 and only two sectors in Q4-2022 (Energy and Industrials). With 26.6% expected y/y growth for Q2-2023, Consumer Discretionary is the only sector projected to be a double-digit percentage grower. A distant second is Communication Services (9.3%), followed by Industrials (6.7), Financials (5.4), Consumer Staples (1.9), and Utilities (1.6).
Despite the rising number of sectors with positive y/y growth, analysts expect the S&P 500’s earnings growth rate to be negative on a frozen actual basis for a third straight quarter in Q2-2023, weakening to -8.9% y/y from -2.8% in Q1-2023 and -1.6% in Q4-2022. On a pro forma basis, they expect earnings to decline 5.7% in Q2-2023 following a surprising 0.1% gain in Q1-2023 and a 3.2% decline in Q4-2022.
Excluding the Energy sector, S&P 500 earnings are expected to decline just 0.7% y/y in Q2—the fifth straight y/y decline in this data series but less of a drop than the 1.6% decline in Q1-2023 and the 7.4% drop in Q4-2022. A strong surprise could result in positive y/y growth for the S&P 500 on a pro forma basis yet remain negative on a frozen actual basis.
Here are the five sectors expected to report a y/y earnings decline in Q2: Energy (-45.5%), Materials (-29.0), Health Care (-15.9), Real Estate (-4.9), and Tech (-3.0).
(4) Y/y growth streaks: winners and losers. The S&P 500 is expected to record its third straight quarter of y/y earnings declines in Q2-2023 on a frozen actual basis. The Industrials sector remains on a strong positive earnings growth path, with Q2-2023 possibly marking nine straight quarters of growth. Communication Services is expected to rise y/y in Q2-2023 for the first time in six quarters, but Materials and Tech are expected to mark their fourth straight y/y decline in quarterly earnings. However, a strong earnings beat could turn Tech’s growth rate positive.
Stay Home Or Go Global?
July 11 (Tuesday)
Check out the accompanying pdf and chart collection.
Executive Summary: Global stock markets have climbed a wall of worry impressively this year despite all the global headwinds—including lackluster GDP growth, high inflation, and the tightening of many central banks’ monetary policies—as well as regional headwinds in Europe and China. The markets’ resilience may reflect investors’ relief that worst-case scenarios didn’t pan out. … Japan’s stock market is a case in point. It’s been soaring despite investors’ uncertainty over the BOJ’s next move. Will this holdout among central banks at long last lift its ultra-easy monetary policy and adjust its yield curve control program accordingly?
Weekly Webcast. If you missed Monday’s live webcast, you can view a replay here.
Global Strategy I: Weak Growth, Strong Stocks. The All Country World MSCI stock price index is up 11.2% in dollars so far this year through July 7 (Fig. 1). The US MSCI is up 14.8% over this period (Fig. 2). It makes sense that the US index would be up more than the global one since the US economy has been growing faster than most expected at the beginning of this year. More surprising is that the All Country World ex US MSCI is up 5.6% in local currency and 5.8% in dollars since the start of the year notwithstanding weaker-than-expected economic growth in Europe and China (Fig. 3).
That’s all quite impressive, especially in the face of the ongoing tightening of monetary policy by the major central banks around the world. Some of the bullishness among global stock market investors may reflect relief that global economic activity hasn’t weakened as much as was feared in response to the tightening of global monetary policies since early last year.
The dire consensus views on several major economies of the world during the second half of last year failed to pan out. It was widely believed that the US would fall into a recession in early 2023 as consumers ran out of excess savings accumulated during the pandemic, that the shortage of natural gas resulting from Russia’s invasion of Ukraine would cause Western European economies to freeze in the dark last winter, and that the Chinese government’s severe pandemic lockdowns would depress China’s economy, exacerbate the country’s property crisis, and disrupt global supply chains.
As these worst-case scenarios didn’t play out, stock markets climbed the wall of worry impressively. In addition, foreign stock markets were extremely undervalued relative to the US. So they had more upside room from a valuation perspective. Consider the following:
(1) Lackluster global growth. Debbie and I like to monitor our daily Global Growth Barometer (GGB) to assess whether global economic activity is growing or slowing (Fig. 4). The GGB is the average of the Brent crude oil nearby futures price and the CRB raw industrials index (multiplied by 2 and divided by 10). Our GGB closely tracks the S&P Goldman Sachs commodity index (Fig. 5). However, we prefer our GGB because it does not include agricultural and lumber prices and because we can track the contributions of the CRB index (which does not include energy, food, or lumber commodities) and the price of oil to our GGB (Fig. 6).
Our GGB peaked near the beginning of last year at 130.7 on March 8. It fell to 99.9 by the end of 2022. On Friday, July 7, it was down to 94.5. By the way, both our GGB and the S&P Goldman Sachs index are inversely correlated with the trade-weighted dollar (Fig. 7 and Fig. 8). The dollar tends to be strong (weak) when the global economy is relatively weak (strong) compared to the US. The dollar has been range-bound since the start of the year, even though the US economy has performed relatively well compared to the rest of the world.
(2) European recession. Figures from Eurostat, the EU’s statistical agency, showed that the Eurozone’s real GDP fell by 0.1% during Q1-2023 and Q4-2022 after revisions to earlier estimates. A technical recession is generally defined as two consecutive quarters of negative growth. With consumers under pressure from the higher energy and food prices, household final consumption dragged down GDP across the Eurozone by 0.3% after a larger 1.0% drop in the previous quarter.
On a y/y basis, the region’s real GDP rose by 1.0%, the weakest since Q1-2021. This series is highly correlated with the Eurozone’s economic sentiment indicator, which has been fluctuating below 100 since July 2022 (Fig. 9). Germany’s IFO business confidence index also remained relatively depressed in June, at 88.5, led by weakness in its expectations index (83.6); its current situation index edged down to 88.5 (Fig. 10).
These recent results were not as bad as was widely anticipated last summer.
(3) China’s anemic recovery. The Chinese government lifted its strict pandemic lockdown requirements at the end of last year. The widely expected strong rebound in the country’s economy was disappointing. The official manufacturing index rose above 50.0 during the first three months of this year (Fig. 11). It has been back under that breakeven level since then through June. The services PMI rebounded more significantly, to a high of 56.9 during March, but was back down to 52.8 in June.
On Monday, we learned that China’s PPI for total industrial products fell deeper into deflationary territory with a reading of -5.4% y/y (Fig. 12). The CPI was flat y/y during June and could also turn negative in coming months.
The price of copper tends to be especially highly correlated with China’s economic activity and MSCI stock price index (Fig. 13). Both prices rose sharply when the government ended the lockdowns but have given back much of those gains in recent months.
China has at least two chronic problems that are likely to weigh on economic growth for several years. The country’s rapidly aging demographic profile is already depressing retail sales growth (Fig. 14). China's property sector has been thrust into a severe debt crisis over the past two years. It was initially triggered by government moves to rein in ballooning debt, with many developers defaulting on payments as they struggled to sell apartments and raise funds. The country’s real estate property crisis is likely to persist.
(4) Submerging emerging economies. The weakness in China’s stock market has weighed on the Emerging Markets MSCI stock price index, which is up just 2.5% ytd in local currency and 3.3% in dollars (Fig. 15). The CRB raw industrials spot price index is highly correlated with the Emerging Markets MSCI in both local currency and in dollars (Fig. 16). The latter doesn’t do well when industrial commodity prices are weak, as they are currently.
Global Strategy II: US vs the World. Let’s have a closer look at the performance of the US MSCI to the rest of the world:
(1) Performance derby. Since the start of the bull market on October 12, 2022, the US MSCI is up 22.8%. Here is the performance derby in dollars and in local currency for the major MSCI stock price indexes: EMU (39.3%, 23.5%), Europe (30.7, 15.9), US (22.8, 22.8), Japan (25.7, 21.7), All Country World (22.4, 19.2), UK (22.0, 5.3), All Country World ex US (21.7,13.7), and Emerging Markets (13.3, 10.7).
(2) Relative performance. Joe and I track the ratios of the US MSCI to the ACW ex US in both local currency and in dollars (Fig. 17). Both ratios have been on uptrends since 2009, confirming our preference for a Stay Home investment strategy over a Go Global one. That’s especially true for the ratio in dollars.
We’re sticking with our Stay Home strategy recommendation.
(3) Valuation. We may be overstaying our welcome in the Stay Home approach of overweighting the US in global portfolios. After all, the forward P/E of the US MSCI was 19.4 at the end of June, well above those of the UK (10.2), EMU (12.1), Emerging Markets (12.2), and Japan (14.6) (Fig. 18). The ratio of the US forward P/E to the ACW ex-US valuation multiple remains historically high at 1.52 (Fig. 19). That’s still true if we remove the MegaCap-8 stocks from the US MSCI: The index’s forward P/E is 19.4 with them and 16.5 without them.
Japan I: Hot Stock Market. One of the hottest markets in the world in recent weeks has been Japan’s Nikkei (Fig. 20). This index has a strong inverse correlation with the yen, which has been very weak recently because the Bank of Japan (BOJ) is lagging all the other major central banks in normalizing its monetary policy, as Melissa discusses below.
The Japan MSCI soared 7.6% during June as its forward P/E jumped from 14.0 to 14.6. The rally was fueled by news on Monday, June 19 that Warren Buffett’s Berkshire Hathaway added to its holdings in Japan’s five biggest trading houses. That likely underpinned the strong buying momentum that propelled the nation’s stock market to multi-year highs.
Japan II: BOJ Policy Uncertainties. On June 16 in its Statement on Monetary Policy, the BOJ upheld its long-standing ultra-loose monetary policy, including its yield curve control (YCC) bond-purchasing plan. Financial market participants are wondering how long it will keep doing so.
Inflation in Japan has been surpassing the BOJ’s 2.0% inflation target in recent months, as discussed below, and recent wage inflation has been substantial. In April, when Governor Kazuo Ueda took his post, the BOJ removed its promise to keep interest rates at current or lower levels. That was widely viewed as a first step toward normalizing monetary policy. But Governor Ueda defended the BOJ’s decision not to change rates or the YCC in June.
Now market watchers are carefully scanning the horizon for hints of the BOJ tweaking its YCC policy, by slowing the pace of bond purchases or eliminating the aspect of the program that targets long-term interest rates altogether. Likely, this change is forthcoming. YCC will have to end eventually, as already the BOJ owns a large share of the Japanese bond market, a Bloomberg article recently observed. The BOJ’s new quarterly growth and inflation projections are due at its next rate review on July 27-28.
Let’s dive into where the BOJ currently stands:
(1) Unchanged policy. The BOJ maintained its ultra-loose monetary policy last month, keeping the short-term interest rate target at -0.1% intact and not changing its YCC policy. Governor Ueda championed the BOJ’s stance, highlighting underlying inflationary softness despite headline inflation exceeding 3.0%. Notably, Japan’s CPI inflation rate excluding fresh food has consistently overshot the BOJ’s 2.0% target for the past 14 months (Fig. 21).
(2) Uncertain inflation. Governor Ueda cautiously articulated a guarded outlook on inflation stability in the years ahead. Nevertheless, he acknowledged that once the central bank attains sufficient confidence that it can achieve a sustainable rate of inflation, that could potentially serve as a catalyst for policy adjustments.
Paving the way for wage inflation to surge, workers have been basking this year in the glow of the most substantial pay hikes witnessed in 30 years, courtesy of annual negotiations with premier Japanese firms. That’s according to a survey conducted by Rengo, Japan's umbrella trade union group, Reuters reported on July 5. But the bank will want to see real wages consistently rising as inflation stabilizes. Real contractual earnings per employee per month in Japan declined 1.5% on a yearly basis through May (Fig. 22). Nominally, the same figure rose 1.7%.
(3) U-shaped recovery? The bank expects a measured recovery in Japan’s economy around the midpoint of fiscal 2023, propelled by pent-up demand. Earlier this month, Q1 growth in Japan was revised upward to an annualized 2.7% from estimates of 1.6%, according to a Reuters survey. Real GDP rose 1.8% y/y through Q1 (Fig. 23). Factors such as fluctuating commodity prices and the deceleration of overseas economies loom large as potential impediments to growth, according to the BOJ’s statement.
(4) Uncertain curve. On June 25, a summary of opinions from the BOJ’s June meeting showed that a BOJ policymaker called for an early revision to its controversial YCC, reported Reuters. The policymaker said that the bank needs to prevent sharp fluctuations in interest rates in the future phase of an exit from current monetary policy. Like the April statement change, any shift in the YCC policy could indicate that the tide slowly could be turning for the BOJ’s ultra-loose monetary policy. The YCC aims to anchor 10-year Japanese government bond yields around the zero mark through appropriate purchases of government bonds.
In December, the BOJ widened the band around its yield target. The central bank stressed that this change was not a step toward abandoning the YCC but was intended to strengthen market functioning. Meanwhile, the assets on the bank’s balance sheet remain unprecedentedly high, having risen from around 450 trillion yen during 2016 at YCC’s start to nearly 750 trillion yen today (Fig. 24).
(5) Unconventional contrasts. In stark contrast to the BOJ’s unyielding ultra-easy policy stance, the US Federal Reserve has been tightening over the past year—most recently keeping rates unchanged after an aggressive series of hikes—while the European Central Bank has taken the bold step of raising its main rates to their loftiest levels in over two decades. It’s likely that the BOJ won’t be as aggressive as those two counterparts but will be on a normalizing path soon too.
Fully Employed
July 10 (Monday)
Check out the accompanying pdf and chart collection.
Executive Summary: June’s newly released employment report gives us clues about June’s not-yet-released CEI, and the CEI closely tracks GDP. So from the employment report, we extrapolate that June’s CEI will likely confirm that real GDP grew around 2.0% y/y during Q2, close to the Atlanta Fed’s current prediction (2.1%). A recession is still possible if the Fed keeps tightening, but we see just a 25% chance of a hard landing. … Also: A look at our resilient labor market. Wage inflation continues to moderate, but wages adjusted for inflation have resumed their growth trend—suggesting revived productivity growth. … And: Dr. Ed reviews “The Diplomat” (+ +).
YRI Weekly Webcast. Join Dr. Ed’s live webcast with Q&A on Mondays at 11 a.m. EST. You will receive an email with the link one hour before showtime. Replays of the weekly webcasts are available here.
US Labor Market I: Another Soft-Landing Month. Friday’s employment report released by the Bureau of Labor Statistics (BLS) suggests that the Index of Coincident Economic Indicators (CEI) probably rose slightly in June, by 0.2%, to yet another record high. The CEI has posted only one decline over the past 11 months, climbing 1.9% over the period. That’s even though the Index of Leading Economic Indicators (LEI, which historically has predicted changes in the economic cycle by an average of 12 months in advance) has fallen sharply since peaking during December 2021 (Fig. 1). Real GDP growth on a y/y basis tracks the comparable growth rate of the CEI (Fig. 2). The former was up 1.8% during Q1, while the latter was up by the same amount through May.
Let’s review the outlook for June’s CEI based on what we know from June’s employment report:
(1) Payroll employment is one of the four components of the CEI (Fig. 3). It rose 209,000 m/m during June to a new record high. It counts the number of jobs both full-time and part-time. Among payroll employment, the following industries rose to record highs during June: construction, educational services, financial activities, heavy & civil engineering construction, health care & social assistance, hospitals, professional & business services, transportation & warehousing, and wholesale trade.
The household measure of employment, which measures the number of workers with one or more jobs, rose 273,000 during June, led by a 382,000 increase in full-time employment to a record high (Fig. 4). The labor force rose less than household employment; it rose by 133,000, so the unemployment rate fell from 3.7% in May to 3.6% in June. The labor market’s performance continues to be very impressive indeed.
(2) Real personal income less transfer payments rose 0.3% m/m during May. The biggest component of this CEI series is wages and salaries. In June, our Earned Income Proxy (EIP) for private-sector wages and salaries rose 0.8% m/m in current dollars as the workweek rose 0.3%, payrolls increased 0.1%, and average hourly earnings increased 0.4% (Fig. 5). It’s likely that the headline PCED rose 0.2% m/m in June. If so, then our inflation adjusted EIP rose by a solid 0.6% to a new record high in June (Fig. 6).
Also likely rising to a new record high in both nominal and real terms during June is the sum of the following components of personal income: dividend income, interest income, proprietor’s income, and rental income (Fig. 7 and Fig. 8). During May, these four sources of income totaled $6.3 trillion compared to $11.7 trillion for wages and salaries, and the four together accounted for 27.3% of personal income. Collectively, they were up 0.3% m/m and 5.5% y/y during May to yet another record high.
(3) Real manufacturing & trade sales is an estimated component of the CEI. It includes retail sales, which will be released for June on July 20. At the same time, the sales of total manufacturing and trade will be released only through May. In the past, inflation adjusted retail sales was highly correlated with our EIP since the main source of purchasing power for most Americans is wages and salaries (Fig. 9).
However, real retail sales has been flat on a record-high plateau since early 2022 following consumers’ goods-buying binge during the pandemic. Real retail sales probably rose slightly in June. We do know that retail motor vehicle sales rose 4.4% m/m during June to 15.8 million units (saar) (Fig. 10).
(4) Industrial production is the fourth component of the CEI. Again, June’s employment report provides a good clue for what it did last month. Aggregate weekly hours worked in manufacturing was flat during June, suggesting the month’s industrial production will be flat too (Fig. 11). That’s confirmed by the weakness in the M-PMI’s production and new orders components during June (Fig. 12).
(5) Bottom line. June’s CEI is likely to confirm that real GDP continued to grow by around 2.0% y/y during Q2. As of July 6, the Atlanta Fed’s GDPNow tracking model predicted that real GDP rose 2.1% q/q (saar) during Q2.
On the other hand, the LEI likely fell again in June. In our opinion, the LEI has been a misleading indicator lately. Even so, a recession remains possible, maybe next year, if the Fed continues to tighten monetary policy because the economy remains resilient (as demonstrated by the CEI) and inflation remains persistent. Nevertheless, our subjective odds of a soft-versus-hard landing remain at 75/25 through the end of next year, for now.
US Labor Market II: Wage Inflation Still on Moderating Trend. Friday’s employment report didn’t provide much relief on the inflation front. Average hourly earnings (AHE) for all workers rose 4.4% y/y during June, the same as in May (Fig. 13). However, that’s down from last year’s peak of 5.9% during March. AHE for production and nonsupervisory workers peaked last year at 7.0% and was down to 4.7% in June.
Fed Chair Jerome Powell frequently has said that wage inflation around 3.0% would be more consistent with the Fed’s 2.0% target for consumer price inflation. We think that both can get to those levels with the current restrictiveness of monetary policy and without a recession. Another 50bps hike in the federal funds rate during the second half of this year wouldn’t change our view. A hike greater than that would.
The good news is that inflation adjusted AHE for production and nonsupervisory workers, who account for about 80% of payroll employment, has been rising along its long-term 1.2% annualized growth rate again for the past six months after stagnating over the past three years (Fig. 14). We’ve contended that consumers’ spending will continue to grow even once they deplete their excess saving (accumulated during the pandemic) because we expect that real wages will grow. So far, so good. By the way, rising real wages suggests that productivity growth is making a comeback.
US Labor Market III: Revisions, Job Openings, Quits & ADP. It was hard to find anything wrong with June’s employment report. But the nattering nabobs of negativism pounced on the 196,000 downward revisions in payroll employment during the first five months of this year (Fig. 15). Even so, payrolls rose by 1.46 million over that period.
Among Fed Chair Powell’s favorite labor market indicators is job openings. The latest reading is for May (Fig. 16). It edged down but remained elevated at 9.8 million, or 1.6 jobs for each unemployed worker. Meanwhile, we know that job openings remained high during June based on the “jobs plentiful” series included in the consumer confidence survey and the “small business with job openings” series from the National Federation of Independent Business’s survey of small business owners. The jobs plentiful series is also highly correlated with quits, which rose in May and remained elevated at 4.0 million (Fig. 17).
Finally, the following table compares June’s BLS and ADP measures of employment on a m/m and y/y basis. They can differ quite a bit on a m/m basis and even on a y/y basis. The devil definitely is in the detail. Our conclusion is that the labor market remains strong, but not as strong as suggested by June’s ADP report.
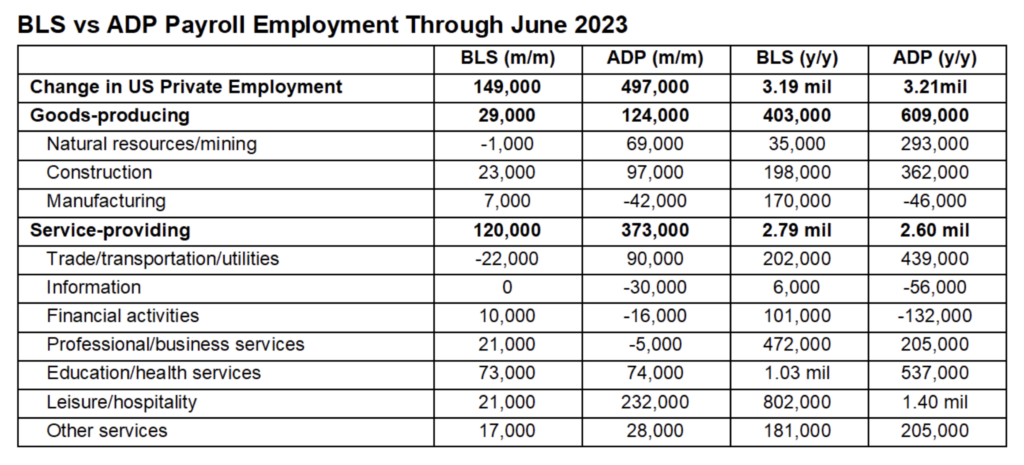
Movie. “The Diplomat” (+ +) (link) is an eight-part mini-series on Netflix starring Keri Russell, who plays a career diplomat sent to London to be the US ambassador to the United Kingdom during an international crisis. Her husband, played by Rufus Sewell, is a retired high-profile diplomat in his own right, but is the ambassador’s “wife,” who is constantly meddling in her professional affairs. The series starts off slowly but picks up steam by the third episode.
Getting Harder To Be A Contrarian
July 06 (Thursday)
Check out the accompanying pdf and chart collection.
Executive Summary: Since last summer, when conventional wisdom held that a recession was coming, we argued that one was already going on, rolling through the economy in stages instead of walloping it all at once. Now that the consensus view is moving toward no recession coming after all, and relieved investors have driven the stock market higher, our contrarian instincts are on high alert. The no-show recession could still show up, and we are on the lookout. … Today we revisit the main reasons that some respected observers still expect a recession, and we weigh in on each. The upshot: We’re not changing our (recently raised) subjective odds of a soft landing, at 75%, for now.
Weekly Webcast. If you missed Monday’s live webcast, you can view a replay here.
US Economy I: Godot Watch. One of our accounts sent me an email on July 4 alerting me to several recent stories in the financial press declaring that there won’t be a recession after all. He asked: “How much are you worried about stories like the attached, where the conventional wisdom seems to have already converged to your view in news articles widely by now? What are the prospects that this is close to spoiling the party soon enough?”
Here are the articles he flagged and my brief summaries of their upbeat assessments:
(1) “The case for a 2023 US recession is crumbling” (CNN, June 5). Matt Egan observes that this was the year that was widely expected to be a recessionary one. But he notes that “the case for a 2023 US recession is crumbling for a simple reason: America’s jobs market is way too strong.” However, he ends his upbeat article by warning that the resilient economy might force the Fed “to slam the brakes even harder.” That could set the stage for a recession in 2024.
(2) “Where’s the Recession We Were Promised?” (WSJ, June 23). James Mackintosh starts his column by reporting, “The 2023 recession is missing in action.” He argues that there were two “pieces of surprisingly good news.” First, in his opinion, is that energy prices dropped as Europe was able to replace Russian gas with alternative sources. Second, the US economy has been remarkably resilient in the face of the tightening of Fed policy. Mackintosh attributes that to the fact that borrowers locked in historically low rates during the pandemic. Under the circumstances, he isn’t convinced that the inverted yield curve will be followed by a recession: “The key lesson of the yield curve is that inversion doesn’t guarantee recession, but it is foolish to dismiss it.”
Sure enough, mortgage applications for refinancing and for home purchases rose sharply during 2020 and 2021 when mortgage rates fell to record lows (Fig. 1 and Fig. 2). Nonfinancial corporations raised a record amount in the bond market during 2020 and 2021, with much of those funds used to refinance outstanding debt at record-low interest rates (Fig. 3 and Fig. 4).
(3) “There Won’t Be a Recession This Year. You Can Take That to the Bank” (Barron’s, June 23). In his column, Andy Serwer states, “What I’m doing, of course, is ridiculing the most widely predicted economic event in modern history—which seems pretty certain not to happen.” He observes that a recession seems very unlikely during the rest of this year given the strength of the labor market, the crowded airports, the rebounding of consumer confidence, and the biggest boost in Social Security benefits since 1981.
We’ve been making the point that fiscal policy has never been this stimulative prior to previous recessions, thus reducing the likelihood that another one is imminent. Serwer agrees: “But the most positive fact, certainly over the longer term, is the underrecognized $2 trillion of spending from Washington in three bills: the Infrastructure Investment and Jobs Act, the Creating Helpful Incentives to Produce Semiconductors and Science Act, and the Inflation Reduction Act.”
Spending by federal, state, and local governments on goods and services in real GDP rose 3.1% over the past three quarters through Q1 (Fig. 5). This is just the beginning of a significant upturn in such government outlays.
(4) “Is it Time to Cancel the Recession Altogether?” (Bloomberg, June 27). Jonathan Levin reports that the “US economy keeps surprising the doomsayers.” He lists three better-than-expected economic indicators released on June 27. He quotes me as follows: “Here’s Yardeni Research’s Ed Yardeni’s spot-on take on the numbers (emphasis mine): ‘The permabears will have to postpone their imminent recession yet again based on today’s batch of US economic indicators, which suggest that our “rolling recession” is turning into a ‘rolling expansion.’”
Levin notes: “For the past 15 months or so, economists and strategists have been obsessed with Federal Reserve history and the yield curve.” That blinded them to the strength of household and business balance sheets as well as the strong job market, which was recently confirmed by three measures of job openings (Fig. 6).
(5) “Waiting for the Godot Recession” (Bloomberg, June 28). John Authers writes: “That the US economy is expected to plunge into a recession later this year is perhaps the most anticipated downturn on record. The last two years have been a chronicle of a recession foretold. But global investors who had positioned their portfolios for the slowdown have been left twiddling their thumbs (and losing out) as the economy shows one sign of strength after another.”
(6) Bottom line. Our no-hard-landing scenario has been at odds with the consensus hard-landing scenario since early last year. Indeed, it was mocked by a few of the permabears as obviously “delusional.” Just to be clear, we’ve been arguing that the US has been in a recession since early last year, i.e., a rolling recession. Now we are seeing signs of a rolling recovery in the sectors that were hardest hit by the tightening of monetary policy and consumers’ pivot to purchasing more services while buying fewer goods.
Nevertheless, the tables have turned, as evidenced by the articles listed above. The hard-landing scenario now seems to be the delusional one. As a result, our contrarian defensive mechanisms have been activated. We’re sticking with the change we made last week in our subjective probabilities of a soft-versus-hard landing from 70/30 to 75/25. But we are on high alert for what could go wrong now that everything seems to be going better than had widely been expected.
In this light, let’s consider what still could go wrong, resulting in a recession perhaps in 2024. We do so in the next section.
US Economy II: What Could Go Wrong? Ed Hyman, our good friend (and role model), is chairman of Evercore ISI and vice chairman of Evercore. He heads Evercore ISI’s Economic Research Team. He appeared on “Bloomberg Surveillance” Wednesday morning.
Ed is convinced that a recession is coming for three reasons. First is the inversion of the yield curve. Second is the drop in M2. Third is the significant tightening of monetary policy resulting from the increase in the federal funds rate combined with quantitative tightening (QT). Meanwhile, our friends at BCA Research warn that consumers’ excess saving could run out as soon as September.
A more immediate risk to the economy is a possible strike by 300,000 UPS workers. Bloomberg (July 5) reports: “Weeks of talks between UPS and the Teamsters fell apart early Wednesday morning in Washington after stretching through the July 4 holiday, with beleaguered negotiators emerging just after 4 a.m. to say the talks had collapsed.” A union spokesperson said that union employees will not work beyond July 31 when the current contract expires.
Let’s revisit our upbeat response to the most frequently cited reasons to be worried about a recession:
(1) Falling leading indicators and M-PMI. The Index of Leading Economic Indicators (LEI) peaked at a record high during December 2021 (Fig. 7). It is down 9.4% since then through May. The LEI correctly anticipated the previous eight recessions with an average lead time of 12 months.
We’ve previously shown that the LEI is biased, giving more weight to the manufacturing than the services sectors of the economy. The y/y percent change in the LEI (which was down 7.9% in May) closely tracks the M-PMI (which fell to 46.0 during June) (Fig. 8). Both are consistent with our rolling recession scenario, with the recession currently rolling through the goods sector. That’s confirmed by the weakness in the ATA truck tonnage index and railcar loadings of intermodal containers over the past year (Fig. 9).
(2) Inverted yield curve. Melissa and I “wrote the book” on the yield curve in 2019. It is titled The Yield Curve: What Is It Really Predicting?. We concluded that inverted yield curves signal that investors believe that the Fed’s continued tightening of monetary policy would result in a financial crisis, which could turn into an economy-wide credit crunch and recession. It is credit crunches that cause recessions, not inverted yield curves that anticipate these events.
This time, the yield curve inverted last summer. It once again correctly anticipated a banking crisis, which occurred in March. What is different this time, so far, is that the Fed responded very quickly with an emergency bank liquidity facility, which has worked to avert an economy-wide run on the banks and a credit crunch, so far (Fig. 10).
So there has been no recession, so far. There still could be if the banking crisis slowly turns into a credit crunch. That’s why Melissa and I are closely monitoring the weekly commercial banks’ balance-sheet data (Fig. 11). They show that bank deposits peaked at a record $18.2 trillion during the week of April 13, 2022 and fell to $17.3 trillion during the June 21, 2023 week. Yet bank loans remained at a record high of $12.1 trillion during the June 21 week. Banks held a record $5.8 trillion in securities during the week of April 13, 2022. This sum has dropped by $645 billion to $5.2 trillion as the securities have matured. Banks are using the proceeds to offset the weakness in their deposits and to make loans.
(3) Declining M2. Monetarists seem to be making a comeback, and they are sounding the alarm that the recent weakness in the M2 measure of money is confirming that monetary policy already is tight enough to cause a recession. We’ve addressed this issue in the past, and we still aren’t alarmed.
The money supply as measured by M2 climbed $130.9 billion in May after falling the prior nine months by $1.0 trillion (Fig. 12). It is down $897 billion since it rose to a record high during July 2022. It is down 4.0% y/y. However, M2’s decline follows a $6.3 trillion (41%) increase from January 2020 (just before the start of the pandemic) through its record high. M2 still remains about $2 trillion above its pre-pandemic uptrend!
As we noted above, the weakness in bank deposits has been partly offset by the proceeds from maturing securities held by the banks. Meanwhile, demand deposits in M2 totaled $5.0 trillion during May. We reckon that’s $1.5 trillion above the pre-pandemic trendline in deposits. Demand deposits currently account for 24% of M2, up from 10.3% during January 2020 (Fig. 13). M2 hasn’t been this liquid since September 1972!
(4) Running out of excess savings. The yearly change in M2 has been closely tracking the 12-month moving sum of personal savings, suggesting that there’s still plenty of excess savings left based on our analysis of M2 above (Fig. 14).
This conclusion is confirmed by Fed data on the ownership of deposits plus money market funds by generation cohorts. Here are their Q1 holdings and the increases since Q4-2019 in these liquid assets: Silent ($2.6 trillion, -$65 billion), Baby Boomer ($8.9 trillion, +$2.5 trillion), GenX ($3.9 trillion, +$1.1 trillion), and Millennial ($1.6 trillion, +$625 billion) (Fig. 15).
Again, we reckon that the excess liquid assets held by the Baby Boomers alone ranged between $1.0-$2.0 trillion at the end of Q1.
(5) Tightening monetary policy. Ed Hyman is certainly right about monetary policy. It is very restrictive, especially considering the tightening of lending standards in reaction to the March banking crisis as well as the ongoing QT program. He expects that the Fed’s rate hiking is “one and done.” Presumably, mounting evidence of an impending recession and disinflation would stop the Fed from implementing additional rate hikes.
I would counter that tight monetary policy has been offset somewhat by very stimulative fiscal policy. In the past, fiscal stimulus usually occurred at the tail end of recessions or even once they were over. This time, plenty of fiscal stimulus has been enacted before the next recession. That’s another reason why the next recession has been a no-show so far.
Rolling Recovery
July 03 (Monday)
Check out the accompanying pdf and chart collection.
Executive Summary: Instead of the economywide recession that was widely expected to result from the Fed’s monetary tightening, recessionary weakness rolled through different areas of the economy at different times. Now that rolling recession is turning into a rolling recovery. Accordingly, we’re raising our Q2 real GDP forecast from 1.0% to 2.0%, followed by 2.0% in Q3 and Q4. We now see a 75% chance of a soft landing (up from 70%)—subject to change depending on what the Fed does, which depends on what inflation does. … We expect inflation to continue to moderate, with a headline PCED rate closer 3.0% by year-end, down from 4.6% in May. ... And: Dr. Ed reviews “Ghosts of Beirut” (+ + +).
YRI Weekly Webcast. Join Dr. Ed’s live webcast with Q&A on Mondays at 11 a.m. EST. You will receive an email with the link one hour before showtime. Replays of the weekly webcasts are available here.
US Economy: Rolling Along. The Fed has raised the federal funds rate by 500bps since March of last year and seems to be on course to raise it by another 50bps over the rest of this year. Despite the monetary tightening, the US economy has avoided falling into an economy-wide recession. Instead, it has been experiencing a rolling recession since early last year, rolling through various industries at various times.
Now the economy is showing signs of experiencing a rolling recovery. Growing confidence in the resilience of the economy has been one of the main reasons why the stock market has been so strong since October 12, with the S&P 500 up 24.4%, the Nasdaq up 32.4%, and the S&P 500 Transportation index up 21.0% since that date.
Let’s review some of the signs of that resilience and why we think that the rolling recession is turning into a rolling expansion:
(1) GDP growth has slowed but remained positive. It has been a soft-landing for real GDP so far. Here are the q/q increases over the past three quarters at a seasonally adjusted annual rate (saar): Q3-2022 (3.2%), Q4-2022 (2.6%), and Q1-2023 (2.0%). The most recent quarter’s number was revised up from an initial estimate of 1.1% (Fig. 1).
Real final sales growth rates for the past three quarters were mostly strong at 4.5%, 1.1%, and 4.2% (Fig. 2). Real consumer spending remained remarkably resilient at 2.3%, 1.0%, and 4.2% notwithstanding rapidly rising interest rates. That’s because employment gains remained robust and consumers spent some of the excess saving they had accumulated during the pandemic.
(2) Residential investment has been in a recession for the past eight quarters, except for multi-family housing. It first turned negative during Q2-2021, before the Fed started raising interest rates during March 2022. It fell 22.3% through Q1-2023 (Fig. 3). Contributing to the decline over this period were single-family housing (-25.6%), home improvements (-17.9%), and real estate brokers’ commission (-33.6%). On the other hand, multi-family housing held up well, rising 5.4%.
Both new home sales and single-family housing starts soared during May by 12.2% and 18.5% m/m, respectively (Fig. 4). There’s lots of pent-up demand for housing and a significant shortage of inventory. That may be enough to end the housing recession even if mortgage interest rates remain elevated. The Atlanta Fed’s GDPNow tracking model is currently estimating a 0.7% increase in residential investment during Q2, up from -4.0% during Q1.
(3) Capital spending on structures declined for six quarters (Q2-2021 through Q3-2022), but has risen for the past two quarters (through Q1-2023) (Fig. 5). The latest rolling recession in capital structures was in spending on commercial, health, power, and communications facilities (Fig. 6). That weakness was partially offset by mining exploration, shafts, and wells structures. Spending on manufacturing plants was flat and depressed following the pandemic lockdowns, but it has surged over the past couple of quarters thanks to onshoring.
(4) Capital spending on equipment declined during the past two quarters, but R&D and software spending have been strong (Fig. 7). The weakness was widespread among information processing, industrial, transportation, and other equipment (Fig. 8). We are expecting information processing equipment spending to turn up soon. Meanwhile, business spending on software and R&D in real GDP rose to new record highs and should continue to do so. The Atlanta Fed GDPNow model is currently estimating that business equipment spending rose 6.7% (saar) during Q2.
(5) Inventories rose sharply from Q4-2021 through Q4-2023, but inventories should no longer be a drag on real GDP going forward (Fig. 8). Much of that was unintended, as consumers pivoted from buying goods to purchasing services. Their goods buying binge during 2021 depleted inventories, causing wholesalers and retailers to order more merchandise, which piled up as unintended inventories when they finally arrived. Inventory investment in real GDP dropped sharply from $136.5 billion (saar) during Q4-2022 to $3.5 billion during Q1-2023, suggesting that the inventory overhang has been resolved. That drop in inventory investment reduced real GDP during Q1 by 2.14 ppts. Inventories won’t be a negative contributor to real GDP growth over the remainder of this year, in our opinion.
(6) Total government spending on goods and services in real GDP has been rising fast for three quarters (through Q1-2023) after falling for five (Q2-2021 through Q2-2022) (Fig. 9). It has been rising at a faster pace than real GDP for the past three quarters, at 3.7%, 3.8%, and 5.0%. That’s likely to continue as the Biden administration’s program to rebuild national infrastructure cranks up.
(7) Consumers’ spending on services should continue to rise, more than offsetting any weakness in their spending on goods. The latter peaked at a record high during March 2021 (Fig. 10). It was down 3.9% through May of this year, though it has been essentially flat since H2-2021. Over this same period (since goods spending peaked), spending on services rose 9.5% to a new record high. Actually, during Q1-2023, consumers’ spending on goods in real GDP rose 6.0% (saar), led by a 16.3% jump in spending on durable goods (Fig. 11). Their spending on services rose 3.2%.
Inflation-adjusted disposable personal income (DPI) has been trending higher over the past 11 months through May (Fig. 12). We expect that real DPI will continue to rise along with employment and real wages. We also predict that the personal saving rate will remain relatively low (Fig. 13). It is widely expected that it will move higher and depress consumers’ spending once they deplete the excess savings they accumulated during the pandemic. We disagree, because retiring Baby Boomers have accumulated a much greater $75 trillion in “excess” net worth and we believe they intend to spend quite a bit of it during their retirement years.
(8) Our rolling recovery scenario adds up to no recession ahead. We are updating our soft-versus-hard-landing subjective odds from 70/30 to 75/25. We are raising our forecast for Q2’s real GDP from 1.0% to 2.0% and maintaining this growth-rate projection for H2-2023 (Fig. 14).
We might have to return to 70/30 or even 60/40 for 2024 if the Fed turns too hawkish in response to the resilience of the economy in general and the labor market in particular. Of course, much will depend on inflation. If the headline inflation rate continues to moderate and the core rate shows more signs of moderating, then the Fed should become less hawkish even if the economy continues to defy the recession forecasters.
Let’s turn now to an update of the inflation situation and outlook.
US Inflation: Headline Moderating, Core Stalling. The headline PCED inflation rate fell to 3.8% y/y during May, down from last year’s peak of 7.0% y/y during June 2022 (Fig. 15). So it is now at the top end of our 3.0%-4.0% forecast range for 2023. We expect to see it closer to 3.0% by the end of this year. That would require the core PCED inflation rate to moderate. It has been stuck around May’s reading of 4.6% y/y for the past five months.
Let’s drill down into the latest inflation numbers:
(1) PCED durable goods. The PCED inflation rate for durable goods peaked at 10.5% y/y during February 2022 (Fig. 16). It was down to just 0.7% y/y in May of this year. It has a history of deflating from the mid-1990s through 2020. We think it could continue to be a negative contributor to inflation over the rest of this year.
(2) PCED nondurable goods. The PCED inflation rate for nondurable goods tends to be volatile and hard to predict (Fig. 17). That’s mostly because food and energy prices tend to be volatile and unpredictable. Nevertheless, the three-month annualized percent changes and the y/y percent changes in energy (-25.8%, -11.7%) and food (1.0%, 6.7%) through May suggest that their y/y rates are likely to continue to fall (Fig. 18).
On the other hand, the inflation components in the core nondurable goods category remain persistently high: personal care (7.8% y/y), household supplies (7.3), magazines, newspapers & stationary (5.4), recreational items (5.0), and clothing & footwear (2.9) (Fig. 19).
(3) PCED services. The core PCED services inflation rate is also stalling (Fig. 20). It was 5.3% in May. Rent of shelter accounts for 23% of the core services PCED. The three-month annualized inflation rates versus the y/y rates for rent of primary residence (6.2%, 8.7%) and owners’ equivalent rent (6.3%, 8.1%) suggest that they should moderate over the rest of this year.
The problem is that the PCED for core services excluding housing has stalled around 4.5% for the past several months (Fig. 21). Here are the y/y PCED inflation rates of the major core PCED services components: personal care (10.0%), housing (8.3) transportation (7.1), recreation (4.7), health care (2.7), education (2.6), and communication (0.0) (Fig. 22).
(4) Bottom line. The headline PCED inflation rate has moderated significantly. The core PCED inflation rate has been stickier. Both remain well above the Fed’s 2.0% inflation target. The core rate’s stickiness isn’t attributable just to rent inflation. Core nondurable goods inflation was 5.3% in May, while the core services inflation rate excluding housing was 4.5%.
So why is the stock market so bubbly? Investors seem to have concluded that another 50bps increase in the federal funds rate won’t knock our resilient economy into a recession, since it has already withstood a 500bps increase since last March. Yet investors must believe that even the stickier inflation components will moderate over the rest of the year. We agree.
Movie. “Ghosts of Beirut” (+ + +) (link) is an excellent docudrama about the efforts of the CIA and Mossad over several years to kill Imad Mughniyey, alias al-Hajj Radwan. He was the founding member of Lebanon's Islamic Jihad Organization and number two in Hezbollah's command. He was often referred to as an “untraceable ghost.” US and Israeli officials accused him of orchestrating numerous terrorist attacks including the Beirut barracks bombing and US embassy bombings, both of which took place in 1983 and killed over 350, as well as the kidnapping of dozens of foreigners in Lebanon in the 1980s. He was indicted in Argentina for his alleged role in the 1992 Israeli embassy attack in Buenos Aires. He was accused of killing more US citizens than any other man prior to the September 11 attacks.
Brokers, Earnings & Green Steel
June 29 (Thursday)
Check out the accompanying pdf and chart collection.
Executive Summary: Is capital markets activity finally picking up? In Jefferies Financial’s recent earnings call, Jackie found reasons to suspect so, including a 16% q/q surge in advisory and underwriting business. Moreover, the IPO market appears to be reviving, and analysts see good earnings growth next year for the S&P 500 Investment Banking & Brokerage industry. … Also: A look at which S&P 500 sectors and industries analysts expect to grow earnings the most and least this year and next. Notably, the Consumer Discretionary and Communication Services sectors top the list for both years. … And: Companies stepping up to the challenge and opportunities of producing green steel.
Financials: Could Better Days Lie Ahead? Jefferies Financial Group’s latest quarterly earnings report, which came out after the stock market closed on Tuesday, was awful, but it did contain a glimmer or two of hope that the worst may have passed for the capital markets and investment banks. The markets have certainly been friendlier of late. The S&P 500 has risen 14.0% ytd through Tuesday’s close, the VIX has fallen to 13.4, and the IPO market has thawed, with four deals expected to raise more than $100 million each this week. And while interest rates are higher than they were a year ago, they appear to have stabilized and stopped their upward trajectory.
Let’s take a look at Jefferies’ fiscal Q2 (ended May 31) earnings, with an eye toward what they might mean for the larger investment banks that will report results in the days and weeks ahead:
(1) Looking hard for sunshine. Jefferies reported a 22.5% y/y drop in revenue to $1.0 billion for its fiscal Q2. The bottom line didn’t look much better, with net earnings attributable to Jefferies common shareholders tumbling to $12.4 million from nearly ten times that—or $114.0 million—in the year-ago quarter. Results were hurt by $72 million of pretax losses related to a merchant banking investment in OpNet.
Look a little deeper, and there were some signs that capital markets activity has started to pick up after being almost completely shut down earlier in the year. Jefferies’ revenue from advisory and equity and debt underwriting was up 15.9% q/q and up 3.9% y/y in its fiscal Q2. Equity and fixed-income capital markets revenue presented a more mixed picture, falling 15.1% q/q but rising 30.4% y/y.
“The month of June has brought green shoots in our investment banking and capital markets business and we are growing increasingly optimistic about the return to a more normal environment. These developments include a more forward-looking attitude from our investor base and a stronger willingness from our corporate clients to engage in capital formation and other major strategic initiatives,” stated CEO Richard Handler and President Brian Friedman in the earnings press release.
(2) IPO market shows signs of life. After being abnormally silent for more than a year, the IPO market has started to return to life. This first signs arrived when fast-food chain Cava Group’s IPO almost doubled when it came to market on June 15, even after being priced well above the initial price range.
The market’s momentum continued this week with six IPOs slated to price. Four of the planned offerings are attempting to raise north of $100 million. They are Vesta Real Estate, which owns and operates industrial real estate properties in Mexico; Kodiak Gas Services, a natural gas compression service; Savers Value Village, a for-profit thrift store; and Fidelis Insurance Holdings, a specialty insurance and property reinsurance provider, according to Renaissance Capital. In Q2, 23 IPOs came to market, the same as in Q1, but the $6.7 billion raised in Q2 was the highest in six quarters, the firm reports. While some of the small deals that sold stock didn’t perform well, the large deals that raised more than $100 million rose 25% from their IPO price.
The Renaissance analysts are optimistic about upcoming months: “Looking ahead, we believe the summer IPO market is poised to capitalize on several positive developments from the past quarter: the pause in rate hikes, the pickup in larger deals at quarter end, and improving returns, with the IPO Index up 26% year-to-date. The backlog appears brimming with solid IPO candidates, and we expect a steady rise in listings in the second half.”
(3) Banks & brokers getting lean. After almost a year and a half of slow investment banking activity and tough stock markets, many investment banks have announced layoffs. Goldman Sachs Group reportedly plans to lay off about 125 managing directors around the world, a June 26 Bloomberg article reported. These cuts come after three other rounds of layoffs over the past year. Smaller cuts have been reported at JPMorgan Chase and Citigroup as well.
UBS Group, which acquired Credit Suisse Group in an emergency takeover, plans to cut more than half of the acquired firm’s 45,000-person workforce beginning in July. “Bankers, traders and support staff in Credit Suisse’s investment bank in London, New York, and in some parts of Asia are expected to bear the brunt of the cuts, with almost all activities at risk,” according to a June 28 Bloomberg article citing “people familiar with the matter.”
Jefferies has used these dislocations to add to its workforce, hiring 21 new managing directors since the beginning of fiscal 2023 in areas that are incremental to its existing coverage universe. The firm plans to continue recruiting additional talent as it plays “prudent offense.”
(4) Analysts see earnings improving. The S&P 500 Investment Banking & Brokerage stock price index—which includes Goldman Sachs, Morgan Stanley, Raymond James Financial, and Charles Schwab—has fallen 14.6% ytd through Tuesday’s close, a performance that beats that of only one other industry in the S&P 500 Financials sector: the Regional Banks industry, with a 38.0% ytd decline (Fig. 1).
The Investment Banking & Brokerage industry’s revenue and earnings declined during the bear market of 2022 and were basically flat this year, but 2024 may be the year results turn around. Revenue was down 10.5% in 2022, and it’s expected to rise only 1.1% in 2023 before increasing 7.6% in 2024 (Fig. 2). Earnings follow a similar pattern: They fell 30.7% in 2022, and they’re expected to rise only 1.5% this year before jumping 19.4% in 2024 (Fig. 3). Analysts’ net earnings revisions have been decidedly negative for 15 months and were -34.8% in June, -36.8% in May, and -38.5% in April (Fig. 4).
The industry’s forward P/E isn’t down in the single digits as is sometimes seen during a financial crisis. But at 11.4, it’s lower than the 14.6 it hit in January 2021 (Fig. 5). If the capital markets continue to awake from their slumber, the S&P Investment Banking & Brokerage industry may finally emerge from the doghouse.
Strategy: Peeking into 2024. In addition to planning Fourth of July barbeques, the year’s halfway point is a great time to look at analysts’ forecasts for S&P 500 sectors’ and industries’ earnings growth in the coming year. With the start of 2024 just six months away, investors begin to focus on what they hope will happen after the New Year’s ball drops. Let’s take a look at where 2024 earnings estimates stand:
(1) Consumer Discretionary on top again. The S&P 500 Consumer Discretionary and Communication Services sectors are expected to have the strongest earnings growth among sectors during 2024 for the second year in a row. And for both this year and next, Energy and Materials will have among the slowest earnings growth.
Here’s the performance derby for the 2024 earnings expected for the S&P 500 and its 11 sectors: Consumer Discretionary (18.7%), Communication Services (17.9), Information Technology (15.6), Industrials (13.4), S&P 500 (11.5), Financials (9.4), Consumer Staples (9.2), Health Care (9.1), Real Estate (8.9), Utilities (8.6), Materials (5.2), and Energy (0.4) (Table 1).
Compare that to the S&P 500 sectors that are expected to have the best and worst earnings in 2023: Consumer Discretionary (24.4%), Communication Services (17.0), Industrials (14.6), Financials (10.6), Utilities (6.0), Consumer Staples (1.4), S&P 500 (0.2), Information Technology (-2.6), Health Care (-9.4), Materials (-17.0), Real Estate (-17.0), and Energy (-25.4) (Table 2).
(2) Industries in travel and the Industrials sector top the list. Analysts seem to expect consumers to continue their wanderlust in 2024. Among travel-related industries, those with the fastest projected earnings growth in 2024 are: Casinos & Gaming (74.4%), Hotels (32.3), and Passenger Airlines (20.6). In addition to Passenger Airlines, two large industries that hail from the S&P 500 Industrials sector also top the list: Aerospace & Defense (26.8) and Industrial Conglomerates (25.0).
Here are the industries that are expected to have the top 10 fastest earnings growth next year: Publishing (87.3%), Casinos & Gaming (74.4), Movies & Entertainment (59.2), Personal Care Products (57.5), Property & Casualty Insurance (35.5), Wireless Telecommunication Services (34.9), Semiconductors (34.8), Hotels (32.3), Commodity Chemicals (30.5), and Reinsurance (30.2).
(3) A look at the downtrodden, too. The S&P 500 industries with the slowest earnings growth—or outright declines in earnings—include a number of industries in the Financials, Materials, and Energy sectors. Here are the bottom 10 industries: Steel (-34.3%), Oil & Gas Refining & Marketing (-29.8), Semiconductor Materials & Equipment (-7.4), Agricultural Products & Services (-3.9), Construction Machinery & Heavy Transportation Equipment (-3.3), Fertilizers & Agricultural Chemicals (-2.2), Integrated Oil & Gas (-2.1), Regional Banks (-1.8), Diversified Banks (-1.1), and Food Retail (0.5).
Disruptive Technologies: Making Green Steel. The global steel industry contributes between 7% and 9% of the world’s carbon dioxide emissions, which makes it a prime candidate for greenification; but greenifying this industry is difficult. Steel making requires vast amounts of energy, typically supplied by burning coal. Figuring out how to eliminate coal from the process—and the CO2 emitted when it burns—is a challenge that many companies, small and large, have taken on. Here are some of the leading candidates:
(1) Harnessing hydrogen. H2 Green Steel aims to replace coal with clean-burning hydrogen. But to do so, the Swedish company will have to produce a ton of hydrogen. To that end, it’s building one of the world’s largest electrolysis plants, in Boden, Sweden, a company press release states. It will use hydropower and wind power generated nearby. The hydrogen produced will be used onsite in a mill that produces green steel using a direct reduction process, which reduces iron ore to sponge iron. Completion of the green steel plant is expected in 2025, with deliveries targeted for 2027.
Scania, a truck building company; Mercedes Benz; and Marcegaglia, an Italian steel company, are investors in H2 and have entered contracts to buy green steel produced by the company. Cargill Metals, which is not an investor in H2, has also agreed to buy green steel. H2 and Swedish shipping company Gotland are exploring the possibility of building a plant to generate hydrogen to power two new ferries that Gotland is developing; they’ll be powered both by hydrogen and other carbon-free fuels.
H2 hopes to produce five million tonnes of green steel a year by 2030, and it’s in talks to build additional green steel plants in Spain and Brazil, a February 17 BBC article reported. H2 faces competition on its home turf from Hybrit, another Swedish steel company that plans to open a carbon-free plant in Sweden by 2026.
And in Europe, the BBC reported, GravitHy plans to open a hydrogen-based plant in France in 2027, Thyssenkrupp aims to introduce carbon-neutral production at all its plants by 2045, and ArcelorMittal and the Spanish government are investing in green steel projects in northern Spain.
(2) US green steel. Boston Metal, a company spun out of the Massachusetts Institute of Technology, has developed a new way of making steel. The company counts ArcelorMittal; Breakthrough Energy Ventures, the fund founded by Bill Gates; and Microsoft’s Climate Innovation Fund as investors.
Instead of combining iron ore or iron oxide with coal in a blast furnace, the company passes electricity through iron oxide mixed with other chemical compounds to make iron and oxygen, a January 27 CNBC article reported. The catch: Making one million tons of steel per year requires 500 megawatts of electricity, or enough to power half a midsized city. Boston Metal is hoping that by the time its plants are built, green electricity will be readily available.
The company has a pilot facility in Woburn, Massachusetts, and plans to add a demonstration steel plant next year and commercial-sized plant in 2026. In the future, it intends to license the technology to steel producers and not enter the production business directly.
(3) Watching ArcelorMittal. The biggest player in the steel business, ArcelorMittal, is an investor in Boston Metal, but it’s also exploring a number of avenues to make its own steel production greener. In some plants, it’s replacing coal with existing biomass from agricultural waste or waste plastic. These waste products naturally emit CO2 as they decompose, so using them in a steel mill makes for a carbon-neutral process. The company has built a plant that converts waste wood into renewable energy through a process called “torrefaction.” The plant, which is being built in Belgium next to an existing steel plant, is expected to reduce the steel plant’s CO2 emissions by 225,000 tonnes per year, according to Arcelor’s website.
ArcelorMittal notes that there isn’t currently the infrastructure available to make large enough quantities of green hydrogen. Until there is, the company is using blue hydrogen (hydrogen extracted from natural gas) and carbon capture and storage technologies. At the company’s steel plant in Hamburg, Germany, hydrogen is generated from the capture of waste gasses. When green hydrogen is abundant enough and economical enough, ArcelorMittal hopes to make the switch.
More AI & More Lithium
June 28 (Wednesday)
Check out the accompanying pdf and chart collection.
Executive Summary: AI is sparking a new industrial revolution that’s bound to transform business processes in every industry. But capitalizing on the promise may mean upgrading legacy IT systems in multiple corporate areas—launching a new technology capital spending cycle. Jackie looks at how companies in various industries are planning to leverage AI to their advantage. … Also: A more efficient way to extract the lithium that electric vehicles’ batteries use is under development. If direct lithium extraction proves viable, it could do for lithium production what fracking did for oil production. That could mean cheaper EVs, EVs with expanded driving range, or both.
Technology: AI Everything Everywhere All at Once. Lately, a day doesn’t pass without a company touting how it plans to use artificial intelligence (AI) to revolutionize its business. Yesterday, it was Snowflake’s turn. The cloud data analytics company announced that it was partnering with Nvidia so customers could build AI models using their own data hosted in Snowflake’s cloud. AI is the new Gold Rush.
“Every industry is on this. They used to say software is eating the world. Well, now data is eating software,” said Snowflake CEO Frank Slootman in a June 26 Reuters article. Both companies’ shares rallied on the news; Snowflake’s shares jumped 4.2%, and Nvidia’s shares added 3.1% on Tuesday compared with a 1.2% gain for the S&P 500.
The news also helped to arrest the slide in the S&P 500 Information Technology sector, which had fallen 3.8% from its June 15 peak through Monday’s close compared with a 2.2% decline for the S&P 500 (Fig. 1). The sector gained 2.0% on Tuesday, leaving it only 2.6% from its December 2021 record close (Fig. 2). The AI-adoption race is taking place across sectors and industries, as hopes are high that the technology will make operations of all sorts more efficient and boost operating margins.
S&P 500 companies’ profit margins on the whole have held up remarkably well over the past year with the US economy evading an economy-wide recession. Here are the forward operating margins for the S&P 500 and its 11 sectors today and one year ago: Information Technology (24.1, 25.4), Financials (18.5, 19.0), Real Estate (17.0, 17.9), Communications Services (15.4, 16.0), Utilities (13.0, 13.8), S&P 500 (12.5, 13.4), Energy (11.2, 11.7), Materials (11.1, 13.6), Industrials (10.6, 10.4), Health Care (9.5, 11.0), Consumer Discretionary (7.6, 7.7), and Consumer Staples (6.7, 7.3) (Table 1 and Fig. 3).
The widespread adoption of AI reinforces our anticipation of the Roaring 2020s, a time when we expect companies will use technological innovations to solve labor shortages and boost productivity. I asked Jackie to take a look at some recent corporate announcements that shed light on how executives hope to harness AI:
(1) AI develops drugs. Insilico Medicine, a biotech company backed by China’s Fosun Group and Warburg Pincus, reported that one of its drugs discovered and designed using AI was beginning Phase 2 clinical trials. The drug treats idiopathic pulmonary fibrosis, a chronic lung disease.
Insilico’s founder Alex Zhavoronkov believes his AI-powered company can roughly double the productivity of every big pharmaceutical company, a June 26 FT article reported. The company’s AI platforms could halve the time it takes to discover drugs and cut the cost of bringing medicines to market. “AI platforms can crunch vast amounts of data to rapidly identify drug targets—proteins in the body associated with particular diseases—and molecules that can be made into medicines,” the FT article explained.
Insilico has used AI to select 12 pre-clinical drug candidates, three of which are in clinical trials. That said, AI isn’t infallible. Benevolent AI’s leading drug candidate, developed using its AI drug discovery platform, failed.
(2) AI designs cars. Toyota announced that it’s using AI in the early stages of car design when different versions of a project are being evaluated by engineers. “[S]imply put, if the automaker decides to build a new large two-door coupe, it could ask AI to generate a number of early designs based on preset parameters,” explained a June 22 Motor1.com article.
Parameters like a drag coefficient and chassis dimensions are fed into the AI system along with descriptive terms, like “sleek” and “modern.” The system tends to focus on designing the most aerodynamic cars to help improve their energy efficiency. “Toyota says the AI-enhanced early design process could help the company design electrified vehicles more quickly and efficiently,” the article reported. BMW likewise says that it is evaluating the use of AI in its automobile designs.
(3) AI finds minerals. Kobold Metals is exploring how AI can help it explore for metals. “Traditionally, geologists examine spatial data to guess where metals are most likely to be located underground, and then mining companies explore those areas manually to see if that expert judgment was correct. Kobold combines AI with large volumes of data on the Earth’s crust, building complex sub-surface models to locate minerals in areas that are less obvious,” a June 23 article in Global Corporate Venturing reported. Some of the metals used in batteries and windmills have become harder to find, and it’s hoped that AI tools can make the process easier and more efficient.
(4) AI requires IT investment. Here are a few more examples that caught our eye of AI either being tested or deployed in various industries: Booking.com, a digital travel platform, announced yesterday the launch of its AI Trip Planner, which will make better destination and accommodation recommendations to users. Mattel is exploring how it can use generative AI to help its cybersecurity team eliminate tedious tasks. Paul McCartney tapped AI to isolate John Lennon’s voice from an old demo tape and used it to mix a new record. And Wendy’s is working with Google to create an AI chatbot that can take drive-thru orders.
Developing and rolling out features that use AI may first require companies to update their existing technology systems. In a survey by Rackspace Technology, 83% of IT executives at global retailers said they would benefit from AI only if they modernize legacy apps and data. Enterprise resource planning, customer relationship management, and HR apps were identified as those that most needed upgrading, followed by business intelligence, data storage, content management, data analytics, governance and security, and data integration, according to a June 23 article in Chain Store Age. Looks like a new technology capital spending cycle—and the Roaring 2020s—are underway!
This isn’t news to technology stock investors. Here’s how some of the largest S&P 500 Technology industries have performed ytd through Monday’s close: Semiconductors (67.5%), Technology Hardware, Storage & Peripherals (41.4), Systems Software (37.4), Information Technology Sector (36.6), Application Software (32.3), Semiconductor Equipment (23.7), Communications Equipment (7.3), IT Consulting & Other Services (1.9), and Home Entertainment Software (0.3) (Fig. 4). (In comparison, the S&P 500 is up 12.7% ytd.)
Materials: A Lithium Game Changer. The advent of battery-filled electric vehicles (EVs) has sent the price of lithium heavenward as many feared there won’t be enough to meet the growing demand. But enterprising scientists are developing new lithium extraction methods that may dramatically increase supplies, perhaps within the next five years.
Traditionally, lithium is either dug out of the ground in mines or separated from brine through evaporation over some 18 months. Direct lithium extraction (DLE) is a new method that extracts the lithium from brine by using chemicals or a sorbent; the process takes hours, not months, and increases the recovery of lithium dramatically. The hope is that this new technology jumpstarts the production of lithium just as fracking did for the production of US oil.
The impact could be substantial: If viable, DLE could drive down the price of lithium, the cost of EV batteries, and perhaps even the sticker price of EVs themselves. Automakers may have more pricing flexibility: They could opt to increase battery size—extending driving range—for the same EV prices as today, or to keep the current battery size and lower the prices of the cars they sell, or to implement some combination thereof.
Again, I asked Jackie to take a look at what has experts so excited:
(1) A bit of background. The amount of lithium produced is expected to increase from 737,000 tonnes of lithium carbonate equivalent in 2022 to an estimated 964,000 tonnes this year and 1,167,000 tonnes in 2024, an April 21 Reuters article reported, citing the Australian Department of Industry, Science and Resources. Nonetheless, the price of lithium has soared in recent years, as demand is expected to outstrip supply increases. The price of lithium carbonate fell sharply during the pandemic, then soared to a high of $81,375 in December 2022 before tumbling this year to a low of $26,850 during early May (Fig. 5).
The price slump earlier this year occurred as China ended its national subsidy for EVs at year-end 2022 and manufacturers of autos with combustion engines cut their prices to boost demand, a June 21 Reuters article reported. EV sales subsequently picked up after Tesla cut its prices and China reversed course: China recently announced $72 billion of tax breaks over four years for EVs and other green cars to boost demand. The price of lithium has responded, jumping to $43,775 as of Monday’s close.
Lithium prices may also have been boosted by news in April that Chile’s President Gabriel Boric plans to nationalize the country’s lithium industry. While he said he will respect current contracts with SQM and Albemarle, he plans to establish a state-owned company, and future contracts will be issued as “public-private partnerships with state control,” an April 21 Reuters article reported. SQM’s contract expires in 2030 and Albemarle’s in 2043. Chile has the world’s largest lithium reserves and is the second largest producer behind Australia.
An arm of the new state-owned company will be tasked with developing technology to reduce the environmental impact of lithium extraction, and the use of DLE will be favored over evaporation ponds, the Reuters article noted. While Chile’s move to favor DLE could help the technology progress, nationalizing the industry may prompt companies investing in lithium development to favor business-friendlier countries.
(2) The promise of DLE. The amount of new lithium production may be determined by whether DLE is successfully developed. An April 27 Goldman Sachs report called DLE a “potential game changing technology” that could double lithium recoveries from brine to 70%-90%, up from 40%-60% currently. (Lithium recoveries from hard-rock mining range 60%-80%).
Improved recoveries will more than offset the higher upfront capital costs involved with the equipment needed for DLE, Goldman’s analysts contend. DLE also has environmental benefits, as it uses less land and water than the traditional brine evaporation method. However, there are some concerns about pollution that may result if DLE uses chemicals as part of the separation process, and it does require more energy than the traditional evaporation process.
Goldman expects projects using DLE could be up and running between 2025 and 2030 in Chile and Argentina. If 20%-40% of Latin American brine projects adopted DLE, Latin American lithium brine supply could increase by 35%, and global raw supply by 8%. If DLE is adopted in China or America, the impacts would be even larger.
(3) Who’s doing what. There are a handful of companies developing DLE technologies, and some of them are hoping to use the technology to develop lithium supplies in the US. Compass Minerals is using DLE absorption technology from EnergySource Minerals at its Great Salt Lake location. Compass received a $252 million equity investment from Koch Minerals & Trading in September, most of which will be used to fund the development of its DLE project.
Energy Exploration Technologies (EnergyX) received $50 million from General Motors and is building demonstration facilities in Argentina, Chile, California, Arkansas, and Utah. The facilities in the US will be near brine owned by Standard Lithium, Compass Minerals International, and CTR.
Lilac Solutions, which counts Bill Gates’ Breakthrough Energy Ventures as an investor, is working with Controlled Thermal Resources to develop a DLE at the Salton Sea in California. Controlled Thermal wants to use the super-heated underground fluid in the area to power a geothermal plant. The company then would like to extract lithium from the fluid using Lilac’s technology, a March 16, 2020 Los Angeles Times article reported.
Europe, What A Drag!
June 27 (Tuesday)
Check out the accompanying pdf and chart collection.
Executive Summary: The Eurozone’s economic outlook has darkened, and we’re not nearly as bullish on European equities as one year ago. … The ECB’s interest rate hikes so far have triggered a technical recession, which is bound to worsen because the region’s stubbornly high inflation implies no end to the tightening in sight. … Other red flags: Analysts have been cutting consensus earnings estimates; high interest rates have depressed demand for business loans to 2008 levels; Europe’s energy resilience could be challenged this winter; and the GDP of Europe’s biggest economy, Germany, is projected to contract this year. … Risks associated with China trade present yet another headwind for the European economy.
Europe I: Greetings from Dubrovnik! My wife and I started our vacation in Croatia last Thursday. We will be back in the USA this coming Thursday. There were no signs of a recession at Newark’s International Airport, which was packed. So was our flight. Croatia’s port cities of Split and Dubrovnik are teeming with cruise ships.
We started our trip in Zagreb for one day and Split for three days. Now we are in Dubrovnik for the rest of our stay. Croatia is beautiful and attracts lots of tourists this time of year. Tourism is the biggest industry here. Many Croatians have moved elsewhere in Europe for steady work year-round. The small country joined the European Union (EU) on July 1, 2013 and the Eurozone on January 1, 2023. The Croatians we met are complaining that they’re plagued by the EU’s inflation while their wages at home remain depressed because of the limited employment opportunities in Croatia.
I asked Melissa to update our outlook for Europe today, which she does below.
Europe II: Less Attractive. Last June, Melissa and I recommended that investors overweight their positions in Europe. That turned out to be a good call. However, last month, we turned less bullish on European equities. We’re now advising investors to consider reducing their positions in European equities if they haven’t already done so. Rising interest rates and numerous other challenges have caused a technical economic recession in Europe, diminishing the investment opportunities in the region’s stock markets.
Growth should pick up in Europe over the long term, however. That could begin as soon as H2-2024 if inflation recedes as we expect it will and the European Central Bank (ECB) ceases its monetary policy tightening. This coming winter will test Europe’s energy resilience, especially if it’s colder than last winter. Waiting out European markets through this season could be prudent.
European investors appear to be more optimistic than consumers and producers. Europe’s MSCI Index is up 32.2% in dollar terms through Friday’s close from a recent low on September 27, when Russia’s war on Ukraine was escalating as winter was approaching (Fig. 1). However, Melissa and I believe that this increase is less reflective of investors’ outlook and more of a valuation catch-up after fears that had depressed valuations failed to materialize (e.g., reduced Russian gas exports to Europe never caused the region to run out of gas, partly because it was a very mild winter).
Our Blue Angels Implied Price Index shows that European valuations have become less attractive (Fig. 2 and Fig. 3). Analysts had been increasing their earnings expectations heading into 2023 despite all the negative headlines. However, since the beginning of this year, consensus estimates for the Europe MSCI’s earnings per share (in local currency) have been declining, likely due to expectations of higher interest rates (Fig. 4).
Factors such as inflation, energy resilience, Germany’s economic performance, China’s impact on Europe, and risks in the banking sector will continue to shape the region’s economic outlook. It’s important for investors to closely monitor these developments to best assess the potential risks and opportunities in the European stock markets.
Europe III: Pricey Pasta. Parisians have to dig deeper in their pockets to buy a baguette, as we discussed in our May 2 Morning Briefing. Italians are holding crisis meetings to discuss the problem of rising pasta prices, reported a May 22 CNBC article. Europeans widely are battling high rates of inflation in food and other categories even though the energy crisis has taken a welcome summer break.
While headline inflation has decreased, certain price categories remain elevated despite the ECB’s efforts to combat them. This means that the ECB’s tightening cycle still has a long way to go, which poses the risk that higher interest rates could push the European economy deeper into recession. Here’s more detail on the problem:
(1) Price plunge. Due to significantly lower energy prices since Russia invaded Ukraine in February 2022, European headline inflation has fallen dramatically. The yearly percent change in Eurozone consumer prices dropped from a peak of 10.6% during October 2022 to 6.1% during the latest reading in May (Fig. 5).
(2) Lingering core. However, core consumer inflation—which excludes food, alcohol, and tobacco—remains stubbornly high at 5.3% in May. Likely, this reflects a lag before the steep drop in energy prices lowers producers’ costs enough that they can lower prices for consumers. Notably, the article highlighting increased pasta prices attributes the situation to producers’ selling batches of pasta that were made back when raw material costs were higher.
(3) Uphill battle. ECB Vice-President Luis de Guindos acknowledged in a June 25 interview that headline and underlying inflation will likely decrease over the medium term but emphasized that the ECB’s price-stability target of 2.0% has not yet been achieved. If a significant decline in credit demand leads to a slowdown in economic activity, he said, then the “finishing line is in sight.”
The growth of bank lending in the Eurozone seems to have been halted by the ECB’s rate hikes. The ECB has raised interest rates 400bps from -0.5% in July 2022 to 3.5% at this June’s meeting (Fig. 6).
According to a survey conducted by the ECB between March 22 and April 6, net demand for loans to businesses fell the most during Q1-2023 that it has since year-end 2008, at the height of the Great Financial Crisis. Furthermore, total loans outstanding at the Eurozone’s monetary financial institutions decreased by 0.2% over the past three months through April (Fig. 7).
However, the ECB finds itself in a challenging situation as it contends with factors beyond its control, such as Europe’s energy dependency, which calls for a combination of luck and strategic redirection. In response to inflation, the European Commission has urged member states to scale back the fiscal support measures they implemented in response to the energy crisis. Guindos stated that if governments fail to do so, an even tighter monetary policy stance would be necessary.
Europe IV: Energy Threat. The invasion of Ukraine by Russia in February 2022 initially caused a steep increase in gas prices in Europe. Russia’s energy war on Europe, aiming to disrupt support for Ukraine, was widely expected to exacerbate Europe’s energy crisis. But Europe has successfully weathered the storm, for reasons discussed in an article in the June 23 The Atlantic. However, the question remains: Will Europe encounter renewed energy difficulties in the coming winter?
Here’s a recap of the key contributors to Europe’s energy stability cited by the article as well as potential challenges that we observe on the horizon:
(1) Favorable circumstances. Europe’s energy resilience can be partly attributed to a stroke of luck. The availability of sufficient gas inventories coupled with milder-than-expected winter weather resulted in lower heat demands than initially projected, easing the strain on energy supplies.
(2) New sources. To enhance energy security, European countries adopted strategies to reduce consumption and diversify their energy sources—such as redirecting liquefied natural gas shipments from the US, the Persian Gulf, and West Africa to Europe, bolstering the region’s energy supply. Additionally, Germany invested in the construction of new gas-receiving terminals, further enhancing its energy infrastructure.
(3) Government support. EU governments played a crucial role by allocating nearly 800 billion euros ($860 billion) in subsidies to offset soaring fuel bills in 2022. This relief helped businesses and households navigate the period of high gas price inflation.
That relief may not be available next winter if fiscal policymakers heed the European Commission’s guidance (and the ECB’s wishes) to pull back on energy supports because of the risk of higher sustained core inflation.
(4) Next winter. Despite the progress made, challenges loom. Germany’s nuclear-power plants, which played a significant role in mitigating the energy shock last winter, were taken offline in April. If the upcoming winter proves colder than anticipated, Europe’s resilience may be put to the test. A study mentioned in Hydro Review highlighted the importance of nuclear power during the cold winter of 2021, indicating the potential impact of weather conditions on Europe’s energy landscape.
(5) Seismic activity. Europe’s natural gas prices are susceptible not only to geopolitical manipulations and harsh weather conditions but also seismic activity. Recent reports of the Netherlands closing Europe’s largest gas site due to earthquake risks caused a spike of nearly 30% in natural gas prices on June 15. The decision to permanently shut down the Groningen gas field, which has been a crucial gas source for Western Europe, further underscores the need to address vulnerability.
Europe V: German Drag. Germany, Europe’s largest economy and a key player in manufacturing, faces significant impediments to both its own growth and that of the broader European economy.
Europe’s soaring energy inflation hit German manufacturers, heavily reliant on energy, hard. Even as energy prices have started to decline, manufacturers continue to grapple with reduced demand, particularly from China, a crucial market. Moreover, Germany faces long-standing structural challenges such as transitioning to renewable energy sources, shifts in global supply chains, and a shortage of skilled labor, all of which have increased production costs.
The economic institute IFO forecasts Eurozone GDP will expand by 0.6% in 2023, while Germany’s GDP will contract 0.4%. Manufacturing accounted for approximately 20% of German GDP in 2021, the June 23 WSJ observed.
Let’s explore indicators of weakness within the Eurozone and Germany:
(1) Eurozone output. The Eurozone has experienced a mild technical recession, with a decline in seasonally adjusted real GDP for two consecutive quarters. During Q1, the Eurozone’s real GDP contracted by 0.4% (saar) during both Q4-2022 and Q1-2023 (Fig. 8). Notably, government spending witnessed the largest decline since Q1-2020, while domestic demand, household spending, and exports also showed negative growth. This indicates weakened economic sentiment and consumption in the region.
(2) Eurozone sentiment. The Eurozone’s economic sentiment indicator (ESI) dipped below 100 during July 2022 due to concerns over winter energy shortages and remained depressed through May, reflecting current concerns over rising interest rates (Fig. 9).
Consumer sentiment in the Eurozone has been consistently weak, and this sentiment is reflected in the volume and value of retail sales, as evident from the latest available data in April (Fig. 10 and Fig. 11).
(3) Industrial performance. Germany’s energy-intensive manufacturing sector has experienced a decline in production, with a significant decrease of 12.9% compared to the previous year. In contrast, the overall Eurozone’s factory output has slightly surpassed the previous year’s levels, reported the June 23 WSJ.
The backlog of unfilled orders, built up during the pandemic, is gradually diminishing, posing challenges for manufacturers to maintain productivity. Incoming orders for German manufacturers have declined, indicating sluggish demand (Fig. 12 and Fig. 13).
(4) Business confidence. Germany’s IFO business confidence index, encompassing both manufacturing and service industries, fell to a recent trough during October 2022, then experienced a brief recovery through April of this year. From there, the index declined through June (Fig. 14). Both the current situation and expectations indexes have witnessed recent drops, reflecting uncertainties and dampened confidence among businesses in Germany (Fig. 15). Today, we learned that German business confidence suffered another setback in June, as Debbie discusses in the Global Economic Indicators section below.
(5) Depressing PMIs. While we were in the process of writing this, the release of Eurozone flash PMI estimates confirmed our pessimism about the European economic outlook. The flash PMI estimates indicate that economic activity in the Eurozone has slowed almost to a standstill (Fig. 16). Manufacturing activity has further contracted, and growth in the service sector has decelerated sharply.
Unsurprisingly, Germany’s Manufacturing PMI has further deteriorated. Additionally, Germany’s Non-Manufacturing PMI has declined for the first time in several months.
The somewhat positive news is that the decline in demand for manufactured products has led to an increase in manufacturing price discounts, with input prices dropping the most since July 2009. However, input costs in the service sector have continued to rise above the survey’s long-term average rate.
Europe VI: China Chill. The economic slowdown in China and the deteriorating relations between Beijing and Europe are serious enough potentially to affect Europe’s growth prospects. The European Commission recently unveiled its strategic economic-security approach, which aims to mitigate the risks associated with conducting business with China and Russia. This approach calls for member states to implement stricter controls to manage the risks involved in engaging with these countries, the WSJ wrote on June 21.
The business landscape in China has become increasingly challenging for European companies, as highlighted by a survey conducted by the EU’s Chamber of Commerce in China. The survey revealed that nearly two-thirds of the respondents experienced greater difficulties in conducting business over the past year.
Moreover, more than 10% of the participants already have shifted their investments away from China, with an additional 7% considering similar actions. Among the top challenges cited by 36% of the respondents was the economic slowdown in China. Jens Eskelund, the president of the Chamber, expressed concerns about China’s newly implemented espionage laws, which are perceived as ambiguous and pose difficulties for international companies in navigating the business environment.
Europe VII: Wobbly Banks. In the wake of the Silicon Valley Bank scare earlier this year and its subsequent impact on Europe, concerns surrounding the European banking sector have resurfaced. This was further emphasized by the recent emergency rescue of Credit Suisse.
The ECB’s Guindos recently highlighted the presence of imminent risks: “The current outlook poses significant challenges, increasing the uncertainties surrounding the profitability and resilience of banks. Although higher interest rates have the potential to enhance banks’ net interest income, their advantages might be somewhat diminished due to a deceleration in lending growth and the inversion of the yield curve.”
Baby Boomers Retiring On $75 Trillion In Net Worth
June 26 (Monday)
Check out the accompanying pdf and chart collection.
Executive Summary: There’s a $75 trillion-wide hole in the theory that consumers’ running out of pandemic savings will sink the economy; that’s the size of Baby Boomers’ collective nest egg. What these seniors don’t pass on to their heirs, they’ll be spending in their Golden Years. … More Boomers than not have retirement savings, reveals data on retirement account ownership by generation cohort, and many face mandatory distributions soon. … Also: The CEI and LEI are conflicted on the question of whether a recession is around the bend or not. We believe not, and investors are coming around to that view too.
YRI Weekly Webcast. Dr. Ed is on vacation and will see you next week for his webcast. Replays of past weekly webcasts are available here.
US Consumers I: Retiring Baby Boomers. When the Fed started to raise interest rates aggressively last year, there was lots of speculation that it would cause a recession. Housing certainly fell into a recession as housing starts plunged 25.7% from a peak of 1.80 million units (saar) during April 2022 to a trough of 1.34 million units during January and April 2023 (Fig. 1). Consumer spending adjusted for inflation has been on a modest uptrend from October 2021 through May of this year, led by services spending (Fig. 2). However, real consumer spending on goods was flat over this same period.
Late last year, the consensus view was that the recession could start during H1-2023. Now the common explanation for the no-show recession despite the 500bps hike in the federal funds rate is that consumers were still spending their excess savings from the pandemic (Fig. 3). But once this cash is spent over the rest of this year, the thinking goes, a consumer-led recession is likely in 2024.
Debbie and I disagree.
Consumers may run out of their excess pandemic savings by the end of this year, but they have lots of other sources of purchasing power. These include not only fast-rising wages and salaries but also a record $7.6 trillion in unearned income including interest income ($1.8 trillion), dividend income ($1.7 trillion), proprietors’ income ($1.9 trillion), rental income ($0.9 trillion), and Social Security ($1.3 trillion) (Fig. 4).
Melissa and I recently observed that consumers’ excess saving of roughly $0.5 trillion currently is dwarfed by the net worth held by the Baby Boom generation that is retiring. The Baby Boomers are currently 59-77 years old. The number of seniors (65 years old and older) rose to a record 58.0 million in May (Fig. 5). Of this total, a record 46.9 million are not in the labor force, leaving 11.1 million still in the labor force. The Baby Boomers will all be seniors by 2029.
The Baby Boomers had $74.8 trillion in net worth at the end of Q1-2023 (Fig. 6). They have just started to spend it. Their progeny undoubtedly expects to inherit some of that wealth and therefore can save less. In any event, the net worths of the GenX and Millennials generations are much smaller, at $39.9 trillion and $7.9 trillion currently. Adding the net worth of the Silent Generation ($18.0 trillion), the total is $140.6 trillion in net worth for all US households.
Let’s have a look at the distribution of assets among the Baby Boomers compared with other generations:
(1) Corporate equities & mutual funds is the largest asset class held by the Baby Boomers, at $20.1 trillion (Fig. 7). None of the other generations’ holdings of stocks and mutual funds come close: Silent Generation ($5.5 trillion), GenX ($9.4 trillion), and Millennials ($0.8 trillion).
(2) Real estate is the second largest asset class held by Baby Boomers, at $18.0 trillion (Fig. 8). All the other generations’ real estate holdings are lower: Silent Generation ($4.7 trillion), GenX ($13.4 trillion), and Millennials ($5.0 trillion).
(3) Pension entitlements held by the Baby Boomers total $15.3 trillion, dwarfing the other generations’ pension entitlements: Silent Generation ($1.9 trillion), GenX ($8.8 trillion), and Millennials ($2.3 trillion) (Fig. 9).
(4) Equity in noncorporate businesses held by the Baby Boomers equates to $7.9 trillion (Fig. 10). GenX isn’t far behind in this measure at $6.0 trillion, followed by only $1.5 for the Millennials and $1.7 trillion for the Silent Generation.
(5) Life insurance reserves are the current cash value of life insurance policies. (Fig. 11). So their value to beneficiaries is much larger. At the end of Q1-2023, here are life insurance reserves: Silent Generation ($0.2 trillion), Baby Boomers ($1.0 trillion), GenX ($0.7 trillion), and Millennials ($0.1 trillion).
(6) Deposits and money market funds by generations are distributed as follows: Silent Generation ($2.6 trillion), Baby Boomers ($8.9 trillion), GenX ($3.9 trillion), and Millennials ($1.6 trillion) (Fig. 12). Here are the changes in this asset by generation from Q4-2019, just before the pandemic, until Q1-2023: Silent Generation (-$0.1 trillion), Baby Boomers ($2.5 trillion), GenX ($1.1 trillion), and Millennials ($0.6 trillion). Clearly, the Baby Boomers have the bulk of the excess savings parked in liquid assets.
(7) Mortgage loans by generation are distributed as follows: Silent Generation ($0.5 trillion), Baby Boomers ($3.3 trillion), GenX ($5.2 trillion), and Millennials ($3.5 trillion) (Fig. 13).
(8) Consumer credit by generation is distributed as follows: Silent Generation ($0.2 trillion), Baby Boomers ($1.0 trillion), GenX ($1.5 trillion), and Millennials ($2.0 trillion) (Fig. 14). The last two cohorts are undoubtedly burdened with too many student loans.
US Consumer II: Census on Retirement Accounts. At year-end 2022, Americans had $8.6 trillion in 401(k) retirement plans and $17.5 trillion in IRAs. Distributions from many retirement plans are required at a certain age, so more and more Baby Boomers will be taking their required minimum distributions in future years.
According to a US Census Bureau report, in 2020, Baby Boomers aged 56 to 64 were the most likely age group to own at least one type of retirement account (58.1%). GenX members aged 40 to 55 were the next most likely to own retirement accounts (56.1%). About half (49.5%) of Millennials aged 24 to 39 owned at least one type of retirement account in 2020, but only 7.7% of Generation Z, or “GenZ,” members aged 15 to 23 did.
Despite the low representation of retirement account holders among GenZ members, they have the most time ahead of them to accumulate additional retirement savings. Moreover, 2013 SIPP estimates showed that only 17.7% of Millennials owned retirement accounts when they were aged 15 to 31—a wider age range than the GenZ measurement but reassuring nonetheless.
US Economy: Contradictory Indicators. The Index of Leading Economic Indicators (LEI) peaked at a record high during December 2021. It dropped 0.7% m/m in May and declined for the 14th month in a row, but there’s still little evidence that the US is headed toward a recession. Indeed, the Index of Coincident Economic Indicators (CEI) edged up by 0.2% m/m during May to yet another record high (Fig. 15). The Conference Board, which compiles both the LEI and CEI, still anticipates a recession, but now it starts during Q3-2023 and lasts through Q1-2024. We still believe that we have been in a rolling recession, making an economy-wide recession less likely.
Data from the Bureau of Labor Statistics released on Thursday showed that 264,000 new claims were filed for jobless benefits on a seasonally adjusted basis in the week ended June 17, unchanged from the prior week’s upwardly revised level, which is the highest level of initial claims activity since October 2021 (Fig. 16). The monthly jobless series is one of the 10 components of the LEI. However, job openings is not a component, and it remains very high.
Among the other 10 LEI components is the yield curve. It has been a negative contributor since it inverted last summer (Fig. 17). It accurately predicted the banking crisis that occurred in March. But so far, that hasn’t morphed into an economy-wide credit crunch or recession.
Meanwhile, the S&P 500, which is also an LEI component, has been rallying since last October. Investors are growing weary of waiting for the most widely anticipated recession of all times (Fig. 18). It remains a no-show.
Transports & Batteries
June 22 (Thursday)
Check out the accompanying pdf and chart collection.
Executive Summary: As consumers continue to celebrate their freedom from Covid with vacations and other experiences, spending less on tangible things, not only retailers have felt the sting—and not only last year. Transport companies continue to report less freight to haul, as FedEx’s recent earnings report illustrated. Jackie examines the S&P 500 Transportation industry’s demand problem. On the bright side, fuel costs have fallen, and analysts are optimistic about improved results next year. … And: When the solid-state batteries for EVs now being developed become commercialized, the much greater driving range they offer may be just the shove the EV market needs to take off.
Transports: Inventory Weighs. It seems so 2022, but inventory levels remain elevated almost a year after retailers, like Target, first warned of the problems building in warehouses. FedEx’s earnings report on Tuesday described how it struggled in this tough market environment but noted that some areas may improve over the next year as comparisons to this year’s results get easier.
FedEx blamed soft demand for a 10.2% drop in revenue to $21.9 billion and a 20.6% drop in adjusted operating income to $1.8 billion in its fiscal Q4, ended May 31. The company is in the midst of a restructuring program that aims to reduce costs by $1.8 billion in the current fiscal year and $4 billion in fiscal 2025. FedEx has retired a number of aircraft, cut US headcount by about 29,000 during fiscal 2023, and is merging its ground and express operations. The company is also rolling out new technology, including a system to provide residential customers with a picture showing that their package has been delivered. The program has led to a 14% reduction in disputed delivery cases and a 17% reduction in call volume in the US, said CEO Raj Subramaniam on the company’s earnings conference call.
Management is hopeful that some parts of its operation will improve this year, helped by easier y/y comparisons. Subramaniam also believes the “reset” in the e-commerce market has run its course, leaving the area set to grow again in fiscal 2024. But he warned that other areas are expected to continue to struggle, resulting in projected revenue growth this fiscal year of flat to up at a percentage in the low single digits. The company’s cost-cutting program, however, is expected to boost adjusted operating earnings to $16.50-$18.50 a share in fiscal 2024, up from $14.96 in fiscal 2023.
Investor optimism about the company’s restructuring and the glimmers of an industry recovery have sent FedEx’s shares flying this year, up 33.8% ytd through Tuesday’s close. That performance trounces the ytd advances of competitor UPS (2.0%) and the S&P 500 (14.3%), as well as the S&P 500 Transportation composite (5.6%) and all of its constituents: Passenger Airlines (21.9%), Air Freight & Logistics (9.4), Cargo Ground Transportation (8.2), and Rail Transportation (-2.2) (Fig. 1).
Let’s use FedEx’s earnings report as an opportunity to review some of the data emanating from the transportation industry:
(1) Inventories remain elevated. Consumers opting to set sail on cruises instead of redecorating home offices has led to bloated inventory levels; companies were unprepared for the post-pandemic changes in consumer behavior. While inventory levels adjusted for inflation have stopped climbing, they remain elevated, particularly at wholesalers. Real business inventories at wholesalers hit $789.8 billion in March, up from $668.4 billion in April 2021 but down slightly from the peak of $792.7 billion in December 2022 (Fig. 2).
Real inventory levels have climbed faster than sales. The business inventory-to-sales (I/S) ratio, adjusted for inflation, has climbed to 1.49 in March, up from 1.37 in September 2021 (Fig. 3). The ratio appears most elevated at manufacturers and at wholesalers; the retail I/S ratio is off its lows of 2021, but it’s not elevated relative to its history (Fig. 4).
(2) Trade has slumped. With US inventories still plentiful and the Chinese economy sluggish, US trade has slowed sharply. Container traffic passing through the West Coast ports has fallen from its 13.3 million TEUs pandemic high to 10.7 million TEUs in May, a level that’s more consistent with those of the last decade (Fig. 5). The slowdown is also evident in the value of real merchandise imports and exports, which has plateaued at a very high level (Fig. 6).
(3) Truck and rail traffic growth has fallen. Sluggish trade volumes have led to less intermodal truck and rail traffic. Railcar loadings of intermodal containers have fallen from their recent peak of 248,640 units in early September 2022 to 217,670 units in mid-June. Likewise, the ATA Truck tonnage index has fallen slightly from its September 2022 peak and remains below 2019 levels (Fig. 7). As business inventories have risen, truck tonnage has fallen (Fig. 8).
(4) Prices are still falling. Weakness in the transportation industry is reflected in the Producer Price Index’s sharp decline this year in the cost of shipping freight by truck. Truck shipping prices, which rose by more than 20% y/y in 2022, declined by 13.6% in May (Fig. 9). Ocean shipping prices may have bottomed, however. The Shanghai Export Container Freight index has been bumping along very low levels since March after falling from peak levels earlier in the year, according to a chart from MacroMicro.
(5) Wages rising, gas prices falling. Looking forward, the transportation industry faces one headwind and one tailwind: Unionized employees are pushing for higher wages and fuel prices have fallen.
Most recently, UPS’s Teamsters union voted to authorize a strike if the union and the company can’t agree on a new contract by July 31, when the current contract expires. They represent more than 340,000 delivery drivers and logistics workers. This follows the tentative labor contract agreement that raised West Coast unionized dockworkers’ wages by 32% through 2028 and granted them a one-time bonus for working through the pandemic, a June 15 WSJ article reported.
Conversely, the cost of fuel has been declining. The price of gasoline futures has fallen 39% from its June 9, 2022 peak to $2.61 (Fig. 10).
(6) Earnings set to improve. Wall Street analysts appear to be hoping that the transportation environment will improve next year. Here are Wall Street analysts’ earnings estimates for 2023 and 2024 for the members of the S&P 500 Transportation index: Air Freight & Logistics (-10.9%, 12.7%), Cargo Ground Transportation (-10.1, 14.6), Passenger Airlines (146.8, 20.6), and Rail Transportation (-0.9, 8.5).
Disruptive Technologies: Batteries’ Solid Advancement. Toyota reports that it has developed a solid-state battery that allows electric vehicles (EVs) to drive more than 900 miles on one charge. That’s much further than the 300 miles that many EVs on the road today, powered by liquid lithium and cobalt batteries, typically can drive on a charge.
Solid-state batteries in general offer not just longer driving range; they are also expected to be less flammable and contain fewer rare, expensive metals than today’s liquid electrolyte batteries that use lithium and cobalt. Solid-state batteries could help EVs become commonplace if they assuage drivers’ range anxiety, assuming that the price of solid-state batteries drops.
We’ve been following the evolution of solid-state batteries, most recently in the March 16, 2023 and October 5, 2022 Morning Briefings. In addition to the established auto makers attempting to decode the mysteries of solid-state batteries (e.g., Toyota, BMW, Nissan, and others), upstarts Solid Power and QuantumScape are racing to develop the ultimate battery. Let’s take a look at some of the latest advancements:
(1) Toyota makes promises. Toyota has been slow to embrace pure EVs, instead hedging its bets by also developing plug-in hybrid electric vehicles (PHEVs), hybrid electric vehicles (HEVs), and cars using fuel cells. But that may change if new solid-state battery technology developed by the company gives it an edge in the EV market.
Earlier this month, Toyota laid out a plan to roll out more advanced lithium-ion batteries followed by solid-state batteries that can be charged in 10 minutes and drive roughly 900 miles, thanks to new technological breakthroughs that were not disclosed. If the batteries develop as hoped, they could be mass produced in 2027-28; but they will likely be more expensive than liquid, lithium-ion batteries. Toyota has been making optimistic claims about solid-state batteries since 2014 but has yet to bring one to market, observes a June 13 Electrek article.
(2) Nissan developing solid batteries, too. Nissan plans to have a pilot production plant making solid-state batteries running in 2025 and aims to start producing solid-state batteries in 2028. The extra power held in solid-state batteries will make it easier to launch electric pickup trucks and SUVs, according to a Nissan exec interviewed by Autocar in February. The automaker hopes that solid-state batteries will triple charging speeds, double the energy density, and cut production costs in half compared to current lithium-ion batteries.
Solid-state batteries and lithium-ion batteries will probably coexist for a number of years. So Nissan has continued to invest in lithium-ion batteries and plans to introduce versions that are cobalt free and up to 65% less expensive than today’s lithium-ion batteries by 2028.
(3) Little guys keep on swimming. QuantumScape and Solid Power are small companies developing solid-state batteries. Both went public during the SPAC (Special Purpose Acquisition Corporation) merger boom a few years ago, and the share prices of both have sagged in the ensuing years.
QuantumScape has delivered solid-state battery prototypes for evaluation by EV manufacturers and consumer electronics companies. The company’s testing with an auto manufacturer has yielded successful results, according to its April 26 shareholder letter, and now its focus is transitioning from demonstrating the technology to improving battery reliability and developing a commercial product.
QuantumScape, which has a shelf registration outstanding, ended Q1 with about $1 billion in liquidity and a “cash runway [that] is forecast to extend into the second half of 2025.” The company’s shares briefly spiked above $130 in December 2020 but closed at $7.43 on Tuesday.
Meanwhile, Solid Power has received a $5 million award from the US Department of Energy to continue developing nickel- and cobalt-free batteries, a January 12 Electrek article reported. The company is focused on developing a solid-state sulfide-based electrolyte technology that it hopes will have more energy density but roughly the same price as current lithium-ion batteries. Solid Power, which counts Ford and Hyundai as investors, has licensed its technology to BMW group. The two companies hope to test the solid-state batteries in vehicles this year, a January 25 Autoweek article reported.
At the end of Q1, Solid Power had $468.2 million of cash, cash equivalents, marketable securities, and long-term investments. Its shares closed at $2.32 on Tuesday.
Notable among other companies developing solid-state batteries are Factorial Energy—which has backing from Mercedes-Benz, Stellantis, and Hyundai—and ProLogium.
Inflation Here & There
June 21 (Wednesday)
Check out the accompanying pdf and chart collection.
Executive Summary: High rates of US inflation are one of the pandemic’s many shockwaves. As these continue to recede, so should inflation—and without further Fed tightening. Goods inflation already has plummeted from 14.2% y/y at its peak to 0.6% in May. High rent inflation is buoying the headline CPI rate, but it should normalize as pandemic effects fade. … In Europe, elevated inflation rates are dropping as well, even though the war in Ukraine grinds on. … In China, inflation isn’t the problem; post-lockdown economic weakness is. The ailing property market doesn’t help. The PBOC is easing in response.
Weekly Webcast. If you missed yesterday’s live webcast, you can view a replay here.
Inflation I: Pandemic Shock Continues To Abate. Debbie and I are coming to the conclusion that inflation might have been one of the many results of the pandemic shock, which is abating. If so, then inflation should continue to moderate without any additional tightening by the Fed. In our opinion, high inflation may turn out to be relatively transitory rather than persistent as widely feared. It has certainly turned out to be transitory for the CPI goods inflation rate (Fig. 1). It was only 0.6% y/y in May, the lowest since November 2021 and well below the 14.2% y/y peak during March 2022.
As a result, the headline CPI inflation rate has dropped significantly since last summer, from a peak of 9.1% y/y during June 2022 to 4.0% y/y in May (Fig. 2). That’s the lowest reading since March 2021 but still well above the Fed’s 2.0% inflation target. The problem is that the core CPI inflation rate has been stuck around 6.0% since early last year.
The core CPI inflation rate has been mostly boosted by the rent component of the CPI, which accounts for 34.6% of the total CPI and a whopping 43.5% of the core CPI. The core CPI inflation rate excluding shelter rose just 3.4% during May, down from last February’s 7.6% (Fig. 3). As rent inflation continues to moderate, so will the core CPI. Consider the following:
(1) During the pandemic, many landlords faced state-mandated moratoriums on raising rents and even collecting them. As these restrictions were lifted, landlords increased rents dramatically in 2021 and early 2022. However, this shockwave from the pandemic has been dissipating:
(2) The CPI rent inflation measures are starting to reflect the drop in new leases (Fig. 4). The CPI primary residence rent index seems to be peaking, edging down to 8.7% through May. This index tends to lag the Zillow and ApartmentList rent inflation rates because it includes all current rents, while the latter two include just new leases. The three-month annualized CPI rent of primary residence fell to 6.2% during May, the lowest rate since February 2022 (Fig. 5).
(3) In his post-FOMC-meeting press conference last Wednesday, Fed Chair Jerome Powell stated: “And rental is a very large part of the CPI, about a third; it’s about half of that for the PCE. So it’s important. And so it’s something that we’re watching very carefully. It’s part of the overall picture. I wouldn’t say it’s the decisive part, but take a step back. … [L]ook at core inflation over the past six months, a year. You’re just not seeing a lot of progress, not the kind of progress we want to see.”
Fed officials have acknowledged that the CPI rent inflation measure has some serious drawbacks. However, they’ve countered that inflation in the core PCED services excluding housing also has remained persistently high, at around 4.0%-5.0% for the past year (Fig. 6). However, the comparable CPI measure peaked at 6.6% during September 2022 and fell to 4.5% in May.
We expect to see more progress ahead in bringing core inflation down as the rent inflation component of the CPI falls. We are still targeting 3.0%-4.0% by the end of this year for both the headline CPI and PCED inflation rates. The stock and bond markets seem to share our optimistic outlook.
Inflation II: Dropping in Europe Too. Inflation in Europe has fallen to its slowest pace since Russia invaded Ukraine, bolstering the case for the European Central Bank (ECB) to stop raising interest rates sooner rather than later. The Eurozone’s CPI rose 6.1% y/y last month, down from 7.0% y/y in April (Fig. 7). That’s the lowest rate of inflation since February 2022, when Moscow launched a full-scale invasion of Ukraine, sending global energy prices soaring.
The pace of food price rises eased for the second month running in May, while energy prices fell. Core inflation, which strips out food and energy, slowed to 5.3% y/y, a four-month low. Inflation has fallen sharply in Germany, France, Italy, and Spain, national data published last Wednesday showed (Fig. 8). Price rises eased across a broad range of product categories in Europe’s biggest economies.
The ECB has increased interest rates by 400bps in less than a year from minus 0.50% in July 2022 to 3.50% today (Fig. 9). The implosion of Silicon Valley Bank in the US and the emergency sale of Switzerland’s Credit Suisse to UBS also have tightened credit conditions in the region. In Q1-2023, net demand for loans to businesses fell the most since the end of 2008, the ECB found after polling 158 banks in the region between March 22 and April 6. “From a historical perspective, the pace of net tightening in credit standards remained at the highest level since the euro area sovereign debt crisis in 2011,” the ECB said.
Nevertheless, the ECB’s Governing Council proceeded to hike its official interest rate by 25bps to 3.25% on May 4 and another 25bps to 3.50% on June 15. The ECB has raised its benchmark interest rate at eight consecutive meetings since last July.
The rate hikes and the global banking crisis during March seem to be stopping the growth in bank lending in the Eurozone. Total loans outstanding at the Eurozone’s monetary financial institutions edged down 0.2% over the past three months through April (Fig. 10).
“We need to see a sustained decline in core inflation that gives us confidence that our measures are starting to work,” Isabel Schnabel, a top ECB official, said in a recent interview with Politico. “What really matters,” she added, is that inflation recedes to the central bank’s 2% target over the medium term.
Inflation III: Deflation in China. Since April, Jackie and I have been observing that China’s economic recovery over the six months since the government lifted pandemic lockdown restrictions in early December has been surprisingly weak. The country’s total imports have been flat since late 2021 through May of this year (Fig. 11). The rallies in the price of copper and in the China MSCI stock price index late last year and early this year have fizzled in recent weeks (Fig. 12). May’s CPI was up by just 0.2% y/y, while the PPI was down 4.6% y/y (Fig. 13).
The government is scrambling to stimulate the economy. Over the past 12 months through May, bank loans are up a near-record $3.3 trillion (Fig. 14). Nevertheless, the People’s Bank of China cut key interest rates on Tuesday for loans issued by the state-controlled banking system. The interest rate cut was small—a tenth of a percentage point for the country’s benchmark one-year and five-year interest rates for loans. However, it was a clear signal that the Chinese government is concerned that the country’s economy is stalling in the face of the ongoing recession in the property market.
Trader’s Perspective. We asked Joe Feshbach for an update on his view of the market from a trader’s perspective: “Breadth has improved for the S&P 500. But the cumulative advance/decline line for the Nasdaq is a galaxy away from confirming the strength in the S&P 500. Sentiment is way too complacent here. Friday had the lowest put/call ratio in many months. Yes, it’s always difficult to predict the end and duration of a blow-off rally, but I'm in the camp that believes that the market rally is close to done—although in fairness, I've said that before. I think that the market could take a big hit to the downside when momentum breaks, as I expect it will.”
Correction. In yesterday’s Morning Briefing, we wrote: “A fleet of trucks can drive through the difference between our S&P 500 earnings-per-share estimate for this year and the Morgan Stanley outlook. As we reiterated last week, we are at $225 this year (up 3.2%), $250 in 2023 (up 11.1%), and $270 in 2024 (up 8.0%).” We meant: “$250 in 2024 (up 11.1%), and $270 in 2025 (up 8.0%).”
Hop, Skip & A Jump?
June 20 (Tuesday)
Check out the accompanying pdf and chart collection.
Executive Summary: The ranks of stock market bears are thinning as investors increasingly concede that no recession is on the horizon. Inflation will continue to drop, with positive—not negative—effects on earnings, we contend, because profit margins have been hurt—not helped—by high inflation. Lower inflation should boost margins and earnings. … The ranks of stock market bulls are growing, their case strengthened by broadening stock market leadership and more bullish sentiment. … Also: We don’t buy the argument that recession will descend once consumers spend their pandemic windfalls, for several reasons. … And: The latest economic releases support our rolling-recession-with-disinflation outlook. ... Finally, Dr. Ed reviews “FDR” (+ + +).
YRI Weekly Webcast. Join Dr. Ed’s live Q&A webinar today at 11 a.m. EST. You will receive an email with the link to the webinar one hour before showtime. Replays of the weekly webinars are available here.
Strategy I: Bearish vs Bullish Spins on Earnings. The most widely anticipated recession of all times remains a no-show. The audience has mostly left the theater, figuring there is no point in waiting for Godot any longer. A few diehard fans of the recession script are staying in their seats, convinced that Godot will show up later this year or early next year. Since the recession is still coming, in their opinion, they are bearish on stocks.
The June 14 Bloomberg reported: “Morgan Stanley’s Mike Wilson is reinforcing his status as Wall Street’s most-famous bear. The bank’s top US equity strategist reiterated his year-end target of 3,900 on the S&P 500 …” He expects S&P earnings to drop 16% this year. Industry sell-side analysts are currently expecting a 2.4% decline for 2023. He thinks that the earnings recession will be worsened by a drop in inflation: “Inflation is going to come down. It’s not going to be good for stocks because that is where the earnings power has been coming from,” said Wilson. He predicts that S&P 500 earnings per share will fall to $185 this year (down 16% from last year) and that the S&P 500 is heading back down.
That’s an interesting bearish spin. He will be right if a recession takes down the economy and brings inflation down with it. He’ll be wrong, in our opinion, if inflation moderates without a recession, as we expect. It’s true that inflation has boosted S&P 500 revenues, while earnings have been weak in recent quarters. That’s because inflation has eroded profit margins, as companies’ costs have risen faster than the prices they charge.
Accordingly, an easing of inflation should ease the pressure on profit margins. This scenario may be starting to unfold, we can see from the latest weekly readings of forward revenues, forward earnings, and the forward profit margin (Fig. 1):
(1) Forward revenues (i.e., the time-weighted average of analysts’ consensus revenue estimates for S&P 500 companies this year and next) rose to yet another record high during the week of June 8. They are up 4.3% y/y. Over the past 12 months through May, the PPI and CPI are up 1.1% and 4.0%. Inflation has certainly boosted revenues.
(2) Forward earnings (i.e., the time-weighted average of analysts’ consensus operating earnings-per-share estimates for S&P 500 companies this year and next) on the other hand fell 5.9% from the week of June 16, 2022 through the week of February 23 this year. It has been edging higher since then and is up 3.0% through the June 8 week.
(3) Forward profit margin (i.e., the margin calculated from forward revenues and earnings) narrowed from a record high of 13.4% during the June 9, 2022 week to a recent low of 12.3% during the March 30 week. Now it is back up to 12.5%.
The bulls clearly have gained ground in their tug-of-war with the bears. As a result, Wilson and the other bears are no longer growling about a retest of the S&P 500’s October 12 low, which was 3577.03. They are implicitly acknowledging that perhaps the bear market ended on October 12, 2022, as we’ve long been saying.
A fleet of trucks can drive through the difference between our S&P 500 earnings-per-share estimate for this year and the Morgan Stanley outlook. As we reiterated last week, we are at $225 this year (up 3.2%), $250 in 2024 (up 11.1%), and $270 in 2025 (up 8.0%) (Fig. 2). That’s with revenues growth slowing to 4.0% during each of those years, reflecting lower inflation and average global economic growth, i.e., no recession. In our forecast, the actual quarterly profit margin is flat this year at 12.3% and rises to 13.2% next year and to 13.7% in 2025 (Fig. 3). (See YRI S&P 500 Earnings Forecast.)
Strategy II: Tug-of-War Favoring Bulls. Meanwhile, the bulls continue to gain ground in our tug-of-war with the bears. Consider the following:
(1) The S&P 500 is now up 23.3% since October 12 to 4425.84 through last Thursday (Fig. 4). That was the highest level since April 20, 2022. It was still 7.7% below the January 3, 2022 record high.
(2) Measures of breadth are improving. The percentage of S&P 500 companies with positive y/y share price changes rose to 72.3% on Friday (Fig. 5). The percentage of S&P 500 companies with positive three-month percent changes in forward earnings rose to 73.5% on Friday (Fig. 6).
The breadth of the market narrowed significantly earlier this year because of the banking crisis in early March. The MegaCap-8 stocks (i.e., Alphabet, Amazon, Apple, Meta, Microsoft, Netflix, Nvidia, and Tesla) led a very narrow advance through May. Since the first week of 2023 through the June 16 week, their collective market cap rose 57.4%, while the S&P 492’s market cap rose 0.9% (Fig. 7).
The market’s rally has broadened significantly so far in June: Consumer Discretionary (9.3%), Industrials (8.8), Materials (8.7), Information Technology (5.7), Financials (5.6), S&P 500 (5.5), Real Estate (4.0), Energy (5.3), Communication Services (3.0), Utilities (3.5), Health Care (3.4), and Consumer Staples (2.8) (Fig. 8 and Table 1).
(3) The rebound in Financials, especially the SMidCap Financials, suggests that investors have concluded that the banking crisis has been successfully contained by the Fed (Fig. 9). Indeed, bank loans remained at a record high during the June 7 week (Fig. 10).
The rebound in Industrials has also been impressive during June (Fig. 11). Here is the performance derby in June so far for the major industries in the S&P 500 Industrials: Agricultural & Farm Machinery (17.8%), Construction Machinery & Heavy Transportation (17.0), Industrial Machinery & Supplies & Components (12.4), Electrical Components & Equipment (10.2), Industrials (8.8), Railroad Transportation (7.1), and Industrial Conglomerates (6.5).
We would like to take some credit for the recent dramatic rebound in the Industrials that are likely to benefit from onshoring and infrastructure boom. Since late May, we’ve been calling your attention to the soaring spending on nonresidential construction, particularly manufacturing facilities (Fig. 12). Also soaring is public construction, especially of highways and streets.
(4) Bullish sentiment has been rising, but not to levels that are too bullish and therefore bearish from a contrarian perspective. The bulls minus bears spread based on the Investors Intelligence and the AAII surveys rose to 25, the highest reading since just before last year’s bear market (Fig. 13).
The bears have clearly lost the hearts and minds of lots of investors since October 12. Nevertheless, they should get at least a small correction for all their efforts. The S&P 500 currently is trading at 10.6% above its 200-day moving average (dma), which was 3985.70 on Friday (Fig. 14). A drop to this average would amount to a 9.6% drop, just shy of a 10%+ correction.
Did you notice that the S&P 500’s 200-dma is just slightly higher than Mike Wilson’s year-end price target for the S&P 500 of 3900? A drop to the 200-dma or even Wilson’s target could happen. But we don’t think it is very likely. And if it does, then we can debate whether it is a continuation of the bear market or a correction in a bull market.
US Economy I: Postponed Recession? When the Fed started to raise interest rates aggressively last year, there was lots of talk that it would cause a recession. Late last year, the consensus view was that it could start during H1-2023. The common explanation for the no-show recession despite the 500bps hike in the federal funds rate is that consumers were still spending their excess savings from the pandemic. But once this cash is spent over the rest of this year, a consumer-led recession is likely in 2024.
That’s a plausible scenario, but not one that we think is very likely, for several reasons:
(1) Much of the tightening of monetary policy has been offset by extremely stimulative fiscal policy, as evidenced by booming nonresidential construction (led by manufacturing facilities and data centers) and public construction (led by highways).
(2) Consumers may run out of their excess savings by the end of this year, but they have lots of other sources of purchasing power. These include not only fast-rising wages and salaries but also a record $7.6 trillion in unearned income including interest income ($1.8 trillion), dividend income ($1.7 trillion), proprietors’ income ($1.9 trillion), rental income ($0.9 trillion), and Social Security ($1.3 trillion) (Fig. 15).
(3) There’s more: According to Google’s chatbot Bard, as of the end of 2022, Americans had $8.6 trillion in 401(k) retirement plans. The AI know-it-all also suggests: “If you are not already contributing to a 401(k), I encourage you to start today. Even if you can only contribute a small amount, it will add up over time. And the earlier you start saving, the more time your money has to grow.” Bard also claims that at the end of 2022, there was $17.5 trillion in IRAs.
Bard also points out that distributions from many retirement plans are required at a certain age, so more and more Baby Boomers will be taking their required minimum distributions in future years. As we’ve noted before, the Baby Boomers have $73 trillion in net worth.
We will be fact-checking Bard, which doesn’t source its data. We will also follow up with more detail on the net worth of the Baby Boomers.
US Economy II: RRWD Update. Meanwhile, last week’s batch of economic indicators was consistent with our rolling-recession-with-disinflation scenario (RRWD):
(1) Employment. The job market may finally be cooling off. Thursday’s 262,000 jobless claims was unchanged from the previous week’s revised figure. The latest reading came in above the forecast of 250,000. Initial claims remain at their highest level since October 2021 but still consistent with slower employment growth (Fig. 16). Keep in mind that the measures of job openings continue to show plenty of them (Fig. 17).
(2) Retail sales. Retail sales at stores, online, and in restaurants grew 0.3% m/m in May. That was above economists’ expectations of a 0.1% m/m decline, according to Refinitiv. Inflation-adjusted retail sales has stalled in record-high territory since late 2021 as consumers pivoted to buying more services (Fig. 18).
(3) Industrial production. Industrial production declined 0.2% m/m in May after rising the two prior months, pulled down by falling mining and utilities output. Manufacturing, the bulk of industrial output, gained 0.1% after rising 0.9% in April (chart). Motor vehicles and parts output edged up 0.2% in May following a nearly 10% rise in April.
The Fed: Powell’s Plateau. After the FOMC meeting adjourned last Wednesday, Fed Chair Jerome Powell held his regular post-meeting press conference. The basic message was that the FOMC has tightened monetary policy considerably and sees a possibility that it might have to raise interest rates by 25bps a couple more times. But for now, the committee is giving it a rest “to assess additional information and its implications for monetary policy.”
We expect that the incoming data between the previous and the next meeting of the FOMC on July 25-26 will confirm our RRWD scenario. If so, then the committee might conclude that monetary policy is sufficiently restrictive to cool inflation without causing an economy-wide recession. So we don’t expect that the hops in the federal funds rates so far and the latest skip will be followed by any more jumps.
Movie. “FDR” (+ + +) (link) is a three-part miniseries portrait of President Franklin Delano Roosevelt on the History channel. It was produced by presidential historian Doris Kearns Goodwin and Bradley Cooper. It’s mostly a glowing account from a liberal perspective and fails to address any of the conservative critiques of FDR’s three terms in the White House. He clearly was a Progressive who believed that big government is the answer to most of our national problems. Nevertheless, it is well worth watching for a refresher course on the Great Depression and World War II.
Hawkish Pause, Rotation & Tech
June 15 (Thursday)
Check out the accompanying pdf and chart collection.
Executive Summary: The FOMC voted not to tighten further for now, as we had expected, and raised its real GDP projection for this year to 1.0%—suggesting a soft landing. … June has seen a dramatic rotation in stock market leadership: Tech has underperformed the S&P 500 this month to date after outperforming since October; the mtd performance winners are Consumer Discretionary and Materials, previous underperformers. Jackie unpacks why. … Also: A look at what’s been driving up valuations in various Tech sector industries. … And: Will genetically altering food to make it more delicious have unforeseen consequences?
The Fed: A Hawkish Skip. In Sunday’s QuickTakes we wrote: “On Wednesday, Fed Chair Jerome Powell will update us on the committee’s latest views. Odds are the FOMC will skip another rate hike, but hint that rate hiking might not be over.” Sure enough, the FOMC skipped, and the committee’s statement noted: “Holding the target range steady at this meeting allows the Committee to assess additional information and its implications for monetary policy.”
The FOMC’s latest Summary of Economic Projections (SEP) shows that committee members now see the federal funds rate rising to 5.6%, up from the 5.1% projected in the December and March SEPs. That implies two more 25bps rate hikes before the end of this year. No one on the committee expects a rate cut this year. In his press conference today, Powell said that the core inflation rate remains sticky and too high. He wants to see more progress in getting it down. The SEP shows the core PCED at 3.9% this year, up from the March SEP projection of 3.6%. However, the committee still expects this inflation rate to fall to 2.2% in 2025.
At the May meeting, the Fed’s staff projected a mild recession. However, the committee actually raised its June projection of economic growth, now expecting real GDP to be up 1.0% this year versus the March estimate of 0.4%. That’s a soft landing, in our view, and is consistent with our forecast.
Initially, the S&P 500 swooned briefly yesterday on the Fed’s hawkish skip. However, the next FOMC meeting isn’t until July 25-26. We expect another skip at that meeting, as the lagged impact of the Fed’s tightening should continue to cool the labor market and inflation. We are still projecting 4600 on the S&P 500 by the end of this year.
Strategy: Broader Is Better. As investors have gained more confidence in the economy, the nature of the stock market’s rally has changed dramatically, with cyclical sectors and industries appreciating and leaving the previous leaders—all things tech and AI-related—in the dust. The rotation began around the start of this month, just as the May employment report confirmed that jobs remained plentiful and that a recession was far from imminent.
Consider the performance derby for the S&P 500 and its 11 sectors mtd through Tuesday’s close: Consumer Discretionary (8.9%), Materials (8.2), Industrials (7.7), Energy (5.5), Financials (4.9), S&P 500 (4.5), Information Technology (4.0), Real Estate (3.5), Health Care (2.9), Communication Services (2.3), Utilities (1.9), and Consumer Staples (1.2) (Fig. 1).
That best-to-worst performance order is almost the polar opposite of the sectors’ rankings measured from the S&P 500’s October 12 bottom through Tuesday’s close, when anything related to technology vastly outperformed the rest of the stock market: Information Technology (47.5%), Communication Services (33.9), Industrials (22.6), S&P 500 (22.1), Materials (18.1), Consumer Discretionary (18.0), Financials (9.8), Real Estate (9.6), Consumer Staples (8.7), Health Care (7.7), Utilities (7.0), and Energy (0.3).
In terms of performance by market capitalization, large-cap stocks have been the winners measured since mid-October. But June’s stock market has been rewarding small- and mid-capitalization stocks. This is evident from looking at the S&P 500’s market-cap weighted and equal weighted performances for the two time periods. From the S&P 500’s low on October 12 through Tuesday’s close, the market-cap weighted S&P 500 index rose 22.1%, while the equal weighted S&P 500 index gained only 14.9%. But since the start of June, the market-cap weighted index has underperformed, advancing 4.5%, while the equal weighted index has gained 5.6% (Fig. 2).
As you’d expect, the S&P 500 outpaced the S&P MidCap 400 and the S&P SmallCap 600 from the market’s October low through Tuesday’s close (22.1% versus 14.6% and 11.6%), but the S&P 500 underperformed the indexes with smaller stocks since the start of June through Tuesday’s close (4.5% versus 7.3% and 7.9%) (Fig. 3).
Let’s take a look at the worries that have faded away over the last month, restoring investors’ confidence in the business prospects for smaller companies and helping to propel this major rotation in the S&P 500’s performance:
(1) Recession fears abated. The stock market has been benefiting from a run of economic data strong enough to reassure investors that the economy is growing but not so strong as to worry them that the growth might be throttled by aggressive Federal Reserve tightening. Most recently, the May employment report came in far stronger than expected, with 339,000 jobs added in the month (Fig. 4).
(2) Inflation slowly decelerates. While inflation data remain above the Fed’s target, they have been slowly falling from elevated levels. May’s CPI jumped 4.0% y/y but only 0.1% m/m (Fig. 5). Likewise, producer prices rose 1.1% y/y in May according to yesterday’s release, but they fell 0.3% m/m.
(3) No Fed rate cuts in ’23. Just as the likelihood of a recession this year has faded away, so too have the odds that the Fed will cut interest rates further by year-end. On May 4, the federal funds rate was 5.13%, while the two-year Treasury yield hit a low of 3.75%, reflecting investors’ belief that the economy was headed for a recession and the Fed would cut interest rates by the end of the year. Since then, the two-year Treasury yield has popped up to 4.67%, and the prospect of rate cuts by year-end is largely off the table (Fig. 6).
Perhaps the only thing to worry about is that nothing much is being worried about—for now anyway.
Technology: A Look at Valuations. The S&P 500 Information Technology sector’s market-leading advance since October 12 has lifted its valuation disproportionately relative to the other S&P 500 sectors’. Some of Tech’s outsized advance is rooted in fundamental improvements. Customers are clamoring for updated software that uses artificial intelligence (AI). These programs are expected to increase demand for cloud computing services handled by servers filled with GPU semiconductors. We laid out what some of the biggest bulls in the industry are saying about the benefits of AI in last Thursday’s Morning Briefing. Bears, however, contend that AI-related stocks have risen more than the fundamentals justify.
The forward P/E of the S&P 500 Information Technology sector has risen to 26.5 as of June 8, up from 20.7 a year earlier. That’s the largest earnings multiple increase that any S&P 500 sector has experienced over the past year. Here’s the performance derby for the S&P 500 sectors’ current forward P/E and where it stood last year: Real Estate (34.4, 37.9), Information Technology (25.6, 20.7), Consumer Discretionary (24.9, 23.3), Consumer Staples (19.3, 20.2), S&P 500 (18.5, 17.3), Industrials (18.0, 17.2), Utilities (17.2, 20.5), Communications Services (16.9, 15.7), Materials (16.7, 14.4), Health Care (16.7, 15.9), Financials (13.0, 12.3), and Energy (10.5, 10.9) (Table 1). (FYI: The forward P/E is the multiple based on forward earnings, which is the average of analysts’ consensus operating earnings-per-share estimates for the current year and upcoming one.)
Four of the 15 industries with the highest forward P/Es in the S&P 500 reside in the Information Technology sector: Systems Software, Application Software, Technology, Hardware, Storage & Peripherals, and Semiconductors. Let’s take a look at what’s been driving their multiples ever higher:
(1) Serving returns. The S&P 500 Systems Software industry has the highest forward earnings multiple of any industry in the Technology sector. It also has the fourth highest forward P/E of all the industries that we track in the S&P 500. The industry’s forward P/E is 28.9, up from 24.9 a year ago. Only the Personal Care Products, Diversified Support Services, and Water Utilities industries have higher forward P/Es, at 33.7, 32.3, and 29.7, respectively.
Investors have grown excited about the demand for cloud services that System Software members Microsoft and Oracle provide to customers. AI services require lots of computing power sourced from the cloud. Oracle reported earlier this week that cloud-related revenue grew 54% y/y to $4.4 billion in the fiscal Q4 ending May 31, far above its total revenue growth of 18%. Microsoft also offers cloud computing services to customers that should benefit from AI uptake. The company is also an investor in ChatGPT and is infusing many of its software services with AI capabilities.
AI excitement has boosted Microsoft shares 39.4% ytd through Tuesday’s close and Oracle’s shares by 42.8%. Google and Amazon shares are in other industries, but they too offer cloud services, and their shares have climbed 40.2% and 50.8% ytd as well.
(2) Pricey software. The Application Software industry’s forward P/E of 27.8 might be lofty relative to others in the S&P 500, but it’s lower than 31.4, where it stood a year ago. The industry had forward earnings multiples of 35 to 45 over the past decade (Fig. 7).
Some of the well-known stocks in this industry include Salesforce, which has enjoyed a 57.6% stock price increase ytd through Tuesday’s close, and Adobe, which has jumped 42.3% ytd. Both are rapidly adding AI capabilities to their software offerings. Some of the top performers are benefiting from the bottoming of the semiconductor cycle. Shares of Cadence Design Systems, which makes hardware and software used in semiconductor design, have climbed 48.8% ytd, and Synopsys shares have advanced 40.9% ytd. Synopsys also creates software that allows engineers to design semiconductors.
It’s notable that the S&P 500 Application Software stock price index is still 25.3% off the high it hit in November 2021 (Fig. 8). The industry’s margins have improved nicely over the past three years, helping it to post solid double-digit earnings increases: 12.7% in 2022, an expected 20.9% this year, and 15.1% in 2024 (Fig. 9 and Fig. 10).
(3) Apple leads the way. Apple hit a new 52-week high earlier this week, for the first time since December 2021. The company, with its 27.8 multiple on forecasted earnings of $6.60 per share in its fiscal year ending September 2024 has helped make the S&P 500 Technology Hardware, Storage & Peripherals industry one of the priciest in the S&P 500. The industry’s forward P/E of 26.7 is the seventh highest in the S&P 500, and it has expanded from 21.1 last year (Fig. 11).
The multiple expansion has occurred even though net earnings revisions for the industry have been decidedly negative over the past year (Fig. 12). The industry’s earnings are forecast to drop 7.6% this year and return to 10.6% growth in 2024 (Fig. 13). Apple and others who make computers and related items have had a tough year, as consumers who stocked up on new tech equipment during the pandemic haven’t had a reason to buy new merchandise this year. But computers and iPhones wear out and grow obsolete; so at some point, the company’s fortunes will change as a new upgrade cycle arrives.
(4) Semis shine. Always looking ahead, investors have sent shares of semiconductor companies soaring just as sales in the industry appear to be turning up after an 11-month-long decline. The prospect of increased demand in addition to the excitement surrounding AI and its voracious demand for chips have pushed the S&P 500 Semiconductor industry stock price index up 73.5% ytd to a new record high (Fig. 14). The industry’s forward P/E has climbed to 26.0, up from 15.6 a year ago, higher than all but three other Tech sector industries and 14 other industries in the S&P 500 (Fig. 15).
Worldwide semiconductor sales have fallen 22.7% from their May 2022 peak to $39.9 billion, based on the three-month moving average (Fig. 16). But month-over-month sales were positive in April for the second consecutive month, raising hopes that sales have bottomed and a new semi cycle has begun. The World Semiconductor Trade Statistics organization forecasts record industry sales of $576.0 billion next year. That would mark a rebound from projected sales of $515.1 billion this year and an improvement over the prior peak of $574.1 billion in 2022, a June 6 Semiconductor Industry Association press release states.
There’s also excitement over the prospect of soaring demand for certain semiconductor chips as companies and individuals adopt AI, which requires massive computing power. Shares of Nvidia, which makes GPU chips and software used in AI servers, have rallied 180.7% ytd through Tuesday’s close. Shares of its competitor, Advanced Micro Devices, aren’t far behind, climbing 92.3% ytd.
Nvidia may have been first to focus on AI, but AMD announced on Tuesday that it is targeting the market too, with a “superchip” offering that combines a central processor, GPU, and memory in one package. It’s also offering a GPU-based “accelerator” for AI uses in data centers, a June 14 WSJ article reported. Nvidia will retain its AI dominance for a while longer because AMD’s AI chip production isn’t expected to begin until Q4, pushing shipments into next year.
Still, the AI opportunity will be measured in years, not quarters. The market for AI chips in data centers is worth about $30 billion this year and “over the next three or four years it’s going to grow over 50% every year,” forecasted AMD CEO Lisa Su, according to a June 14 Yahoo Finance article. Analysts expect the S&P 500 Semiconductor industry’s earnings to grow 34.4% in 2024 after declining 16.9% this year and falling 1.7% in 2022 (Fig. 17).
Disruptive Technologies: CRISPR Comes to Dinner. Foods that are genetically altered using CRISPR gene editing technology are getting US regulatory approval and will likely become more prevalent in grocery stores soon. CRISPR altered foods aren’t the same as genetically modified foods (GMOs). CRISPR edits an organism’s existing genes, turning them on and off, and speeds up the process traditionally used when breeding crops or animals to have specific traits. Genetically modified foods have had the genetic material of other organisms inserted into the target food’s genes.
US regulators require genetically modified foods to have specific labeling. Right now, CRISPR edited foods aren’t required to include any special labeling; but some wonder whether more regulation is needed. The “speed and power of the modifications have some scientists concerned that CRISPR may have the potential to be a Pandora’s Box of unintended consequences let loose on the fields just when the world can poorly withstand shocks to the food system. CRISPR is here to stay—but are we ready to manage the risks?” asks a February 27 article in Fortune.
The article speculates that the technology could bring unforeseen ripple effects, e.g., a new CRISPR crop might trigger new allergies or a crop designed to foil an insect might unexpectedly cause an ecosystem to collapse. And, the author notes, once a modified plant is introduced into an ecosystem, it can be difficult to remove it from the environment.
Nonetheless, CRISPR modified foods are heading to our tables. Here are some recent foods that have been approved by the Food & Drug Administration (FDA) for sale in the US after undergoing CRISPR editing:
(1) CRISPR sausages. The FDA has approved the sale of German sausages made from pigs that had their genes edited by the scientists at Washington State University using CRISPR gene editing tools. “The FDA authorization is investigational, and limited to these particular pigs, but shows that gene-editing livestock to quickly produce desirable traits for improved food production is a viable strategy for helping feed the planet’s growing population,” a May 1 press release from Washington State University stated.
The pigs’ genes were edited so that they were sterile and could be implanted with the sperm from other male pigs that had desired traits. Through this accelerated version of selective breeding, the scientists hope to improve the pigs’ health and resilience. The FDA has not reviewed the safety of the meat from the pigs’ babies.
(2) CRISPR salads. Pairwise has taken the bitter out of mustard greens using CRISPR technology to turn off the gene responsible for their strong taste. The company hopes consumers will opt for these better tasting mustard greens, which are known for their high vitamin and mineral content, a May 16 Wired article explained. The company hopes the modified mustard greens will be available this summer in grocery stores in the Pacific Northwest. Up next: Pairwise aims to improve fruits. It’s using CRISPR to develop seedless blackberries and pitless cherries.
(3) CRISPR tomatoes. US companies are following the success of Sanatech Seed, a Tokyo-based firm, and the University of Tsukuba, which together developed a CRISPR edited tomato that contains high amounts of y-aminobutyric acid, or GABA. GABA is believed to relieve stress and lower blood pressure. The partners used CRISPR to reduce the production of enzymes that naturally break down GABA. These tomatoes are already on Japan’s grocery store shelves.
All About Earnings & Inflation
June 14 (Wednesday)
Check out the accompanying pdf and chart collection.
Executive Summary: Like the economy, earnings have been landing softly; revenues haven’t landed at all. The S&P 500’s Q1 results imply earnings weakness totally due to margin contraction as businesses battled fast rising costs. … Analysts see y/y earnings gains resuming in Q3 and Q4, for full-year earnings growth of 0.4% followed by 11.4% next year. … We see a U-shaped earnings recovery and are tweaking our estimates for S&P 500 revenues, earnings, margins, and the price index. Our year-end targets for the S&P 500 are 4600 this year and 5200 next. … Inflation continues to moderate nicely, which should stay the Fed’s hand.
Earnings I: The Past. The Q1 earnings season is over, and the final numbers are in. They were better-than-expected results, which isn’t surprising when the economy is growing. Worse-than-expected results tend to occur when the economy is falling into a recession. That the economy would fall into a recession has been a widespread concern—but not our outlook, as you know. So far, so good.
Today, let’s review the results and then go back to the future by updating our forecasts for S&P 500 revenues per share, earnings per share, and the profit margin for 2023, 2024, and 2025. Then let’s conclude with a discussion of the outlook for the S&P 500’s forward earnings per share, forward P/E, and stock price index. Put on your diving suit:
(1) Revenues. S&P 500 companies’ revenues per share edged down during Q1 from Q4’s record high, but still rose 9.1% y/y (Fig. 1 and Fig. 2). Inflation boosted the growth rate, as the GDP price deflator rose 5.3%; but the inflation-adjusted increase was still a solid gain.
(2) Earnings. S&P 500 earnings per share was flat compared to Q4’s result but still down 3.0% y/y (Fig. 3 and Fig. 4).
(3) Profit margin. We can calculate the S&P 500’s profit margin by dividing the index’s earnings by revenues (Fig. 5 and Fig. 6). The margin edged up to 11.8% from 11.5% during Q4, but it was still down from the record high of 13.7% during Q2-2021.
The earnings recession has been quite modest so far, with two back-to-back quarters of modest declines on a y/y basis. There has been no revenues recession so far. The earnings weakness of recent quarters has been entirely attributable to the decline in the profit margin. This suggests that while business revenues kept pace with price inflation, profits were squeezed by rapidly rising costs. Wage inflation has been high, and productivity has been weak because of unusually high turnover in the labor market, with record-high quits and job openings in recent quarters.
Earnings II: The Present. The S&P 500 companies’ actual Q1 earnings per share turned out to be down 3.0% y/y, which was better than the -7.5% expected by industry analysts collectively at the start of the earnings season (Fig. 7 and Fig. 8). Currently (as of the June 8 week), industry analysts project that S&P 500 earnings will be down 8.1% y/y during Q2, followed by Q3 and Q4 y/y gains of 0.4% and 9.1%. Like the economy, earnings have experienced a soft landing, so far.
Currently, industry analysts are expecting the following y/y revenues and earnings growth rates: for 2023 (1.9%, 0.4%) and for 2024 (4.6%,11.4%) (Fig. 9 and Fig. 10).
The S&P 500 profit margin forecasts implied by analysts’ revenues and earnings estimates have been dropping for 2023, 2024, and 2025 since the start of this year (Fig. 11). The projections may be bottoming now, with the latest readings for the three years at 12.0%, 12.8%, and 13.6%. A bottoming of industry analysts’ implied margin estimates would suggest they believe that the mini recession in earnings attributable to weakening profit margins is over. They’ll be right if margins stop falling.
As you know, Joe and I are big fans of weekly S&P 500 forward revenues per share and forward earnings per share as great coincident indicators of the actual quarterly series for S&P 500 revenues per share and earnings per share (Fig. 12 and Fig. 13). (Forward revenues and earnings are the time-weighted average of analysts’ estimates for the current year and the coming year.) Forward revenues rose to yet another record high during the June 1 week, while forward earnings bottomed during the February 23 week and is up 3.0% since then through the June 1 week. The forward profit margin edged up during the June 1 week to 12.5% (Fig. 14).
Earnings III: The Future. Now let’s turn to an update of our outlook for the S&P 500 companies’ collective revenues, earnings, and profit margin.
Since earnings have had a soft landing so far rather than a hard one, we are expecting a U-shaped, rather than a V-shaped, earnings recovery. If we are surprised, then it’s likely to be because the recovery is more robust than we are projecting. If so, that would be attributable to higher profit margins, boosted by technology-driven productivity gains. Let’s think ahead:
(1) Revenues. We are projecting that revenues per share will increase 4.0% this year to $1,823 and 4.0% in 2024 to $1,896 (Fig. 15). (Our previous estimates were about the same at $1,825 and $1,875.)
(2) Earnings. We are projecting that earnings per share will be $225 this year and $250 next year (Fig. 16). That’s been our forecast since last summer. (The final tally for 2022 was $218. We had been projecting $220.)
(3) Profit margin. Our projections imply that the profit margin will fall from 12.4% in 2022 to 12.3% in 2023 and rise back to 13.2% in 2024 (Fig. 17).
(4) Forward earnings. We are projecting that S&P 500 forward earnings per share will be $250 at the end of this year and $270 at the end of next year (Fig. 18). Those are what we expect the analysts’ consensus earnings expectations then will be for 2024 and 2025. (At year-ends, forward earnings matches the analysts’ projections for the upcoming year.)
(5) Valuation & S&P 500 ranges. Now let’s apply forward P/E ranges of 16.0-20.0 to our forward earnings projections to derive target ranges for the S&P 500 (Fig. 19). The range for 2023 is 4000-5000 and for 2024 is 4320- 5400 (Fig. 20). Our year-end point estimates are 4600 by the end of this year and 5200 at the end of 2024.
We acknowledge that our valuation multiple ranges are high. However, they reflect our expectations that the MegaCap-8 stocks (i.e., Alphabet, Amazon, Apple, Meta, Microsoft, Netflix, Nvidia, and Tesla) will continue to account for a significant portion of the market cap of the S&P 500 and that they will continue to be highly prized by investors.
Inflation: Still Moderating. May’s headline CPI inflation rate continued to moderate, dropping to 4.0% y/y, the lowest reading since March 2021 and well below last year’s June peak of 9.1% (Fig. 21). The comparable core CPI inflation rate has been stickier, falling to 5.3% y/y through May. We are sticking with our forecast that the headline PCED inflation rate will fall to 3.0%-4.0% by the end of this year.
We are also sticking with our position that the federal funds rate is restrictive enough at 5.00%-5.25% to moderate inflation without causing an economy-wide recession. We expect that the Fed will come to the same conclusion and leave the rate where it is through the end of this year.
CPI goods inflation was down to just 0.6% y/y during May, with durables unchanged and nondurables up 1.0% (Fig. 22). The 4.4% m/m increase in used car and truck prices seemed like an anomaly to us.
We are optimistic that the CPI services inflation rate will continue to moderate over the rest of this year. It was down to 6.3% and 4.3% with and without rent of shelter (Fig. 23). Rent inflation remains high, but the three-month annualized inflation rate has been declining for the past three months (Fig. 24).
Long & Variable Lags?
June 13 (Tuesday)
Check out the accompanying pdf and chart collection.
Executive Summary: The economy has responded to monetary tightening quickly, our research finds, not with “long and variable lags” as monetarism theorizes. Today’s economy and financial systems are exceptionally resilient. … Among some of the reasons: A deluge of post-pandemic fiscal spending has dulled the impacts of tightening. Certain typically interest-rate sensitive industries have been atypically resistant to tightening because of pandemic effects specific to them. Tighter credit conditions after the banking crisis have not triggered a widespread credit crunch. Consumers’ excess savings are dropping fast, but the economic effects are offset by retiring Baby Boomers’ massive net worth. AI and other tech advances have kindled the animal spirits of economic actors.
Weekly Webcast. If you missed Monday’s live webcast, you can view a replay here.
Monetary Policy I: Friedman’s Rule. Fed officials have often stated that monetary policy operates with a “long and variable lag” on the economy. Economist Milton Friedman first promoted this concept. He was referring to the growth rate of the money supply rather than to interest rates. He was defending his monetarism theory—i.e., that monetary policy shouldn’t try to manage the business cycle. Instead, policy should be aimed at maintaining a relatively constant growth rate in the money supply that would support real economic growth while keeping inflation subdued.
Theoretically, monetarism makes sense. Empirically, the theory has been challenged by the changing nature and definition of money. Financial deregulation since the 1980s has only reduced the feasibility of implementing monetarism.
In any event, our research over the years shows that tightening monetary policies—as defined by the troughs and peaks of the federal funds rate—tend to have relatively quick and abrupt impacts on subsequent economic activity, not delayed impacts after long and variable lags. In the past, the monetary tightening cycles ended when they resulted in financial crises (Fig. 1). The financial crises typically morphed into economy-wide credit crunches, which caused recessions and brought down inflation.
In the following sections, Debbie and I examine whether this time is different. In summary, we think so because the financial system and the economy have proven to be much more resilient in the face of tightening monetary policy than usual. The labor market has been particularly strong. As a result, the lags might indeed be longer but more muted this time. This conclusion is consistent with our soft-landing outlook for the economy.
The most common explanation for the resiliency of the economy is that consumers accumulated excess saving during the pandemic, allowing them to bolster their spending. The pessimistic view is that excess saving—after declining from around $2.0 trillion to $0.5 trillion—will fall to zero by the end of this year (Fig. 2). That would result in a recession, according to the naysayers. But we don’t see it happening. We’ve previously observed that the Baby Boomers, who increasingly are retiring, have $73 trillion in net worth that they are just starting to spend. Their progeny undoubtedly expects to inherit some of that wealth and therefore can save less.
Monetary Policy II: Interest Rates. The Fed has raised the federal funds rate by 500bps since March 2022 from 0.00%-0.25% to 5.00%-5.25%. It has been the most aggressive tightening of monetary policy since then-Chair Paul Volcker allowed interest rates to soar in late 1979 and the early 1980s to halt the Great Inflation (Fig. 3).
The most interest-rate sensitive sector of the economy is housing, particularly single-family new and existing home sales (Fig. 4). They respond very quickly to changes in mortgage credit conditions. They plunged 29.5% from January 2022 through April 2023. Over this period, the 30-year mortgage rate soared by 383bps to 7.15% on June 9 (Fig. 5). That increase reflected the jump in the 10-year Treasury bond yield as well as the 171bps jump in the spread between the mortgage and bond yields (Fig. 6). The spread widened because Fed officials have indicated they want to get out of mortgage securities for good as part of their quantitative tightening program.
Keep in mind that while single-family housing activity responded quickly to tightening monetary conditions, multi-family construction and spending on home improvements both have remained strong (Fig. 7). Meanwhile, nonresidential construction spending is at a record high, showing no adverse impact yet from higher interest rates (Fig. 8). By the way, public construction is at a record high as well.
Consumer durable goods sales are also interest-rate sensitive, particularly auto sales (Fig. 9). They are even more sensitive to the unemployment rate. So far, the unemployment rate remains very low at 3.7% during May. If and when the jobless rate rises significantly in response to tightening credit conditions, then auto sales would likely weaken with a lag.
Monetary Policy III: Credit Tightening & Credit Crunches. In the past, rising interest rates relatively quickly depressed the most interest-rate sensitive sectors of the economy. As the Fed continued hiking the federal funds rate, the yield curve would flatten and then invert, signaling that bond investors expected additional Fed rate hikes to cause something to break in the financial system. The resulting financial crisis would morph into an economy-wide credit crunch and a recession. The Fed then would scramble to lower interest rates. In other words, the lag times between tightening monetary policy and a recession were shortened by credit crunches.
The banking crisis during March has caused credit conditions to tighten, but the impacts so far haven’t added up to an economy-wide credit crunch. The Fed’s aggressive hiking of the federal funds rate has caused a disintermediation problem for banks, especially small and regional ones. They’ve been losing deposits to money market funds (Fig. 10). They’ve had to raise their deposit rates to stem the outflows, which is squeezing their profitability.
In addition, small banks all together currently have $2.0 trillion in commercial real estate (CRE) loans on their books, as much as they have in all other loans combined (Fig. 11). Large banks have $0.9 trillion in CRE loans. The economy’s rolling recession is just starting to hit the office segment of commercial real estate, which has been hammered by the jump in interest rates and the work-from-home trend. The S&P 500’s Office REITs index is down 31.5% y/y through June 9 (Fig. 12).
The lag between tighter monetary policy and the negative impact on the CRE market is likely to take longer and last longer than usual. The same may apply to bank loans in general given the tightening of credit conditions reported in the latest Senior Loan Officers Opinion Survey (SLOOS). (See our SLOOS chart book.)
Monetary Policy IV: Excess Savings & Wealth Effects. Above, Melissa and I observed that consumers’ excess savings of roughly $0.5 trillion currently are dwarfed by the net worth held by the Baby Boom generation that is retiring. The number of seniors (65 years old and older) rose to a record 58.0 million in May (Fig. 13). Of this total, a record 46.9 million are not in the labor force, leaving 11.1 million still in the labor force. The Baby Boomers are currently 59-77 years old. As we have previously noted, they had $73 trillion in net worth at the end of 2022 (Fig. 14).
Monetary Policy V: Fiscal Policy & the Roaring 2020s. Finally, let’s not forget that tighter monetary policy has been offset by very stimulative fiscal policy since the pandemic. The Fed accommodated expansionary fiscal policy during 2020 and 2021. It stopped doing so and started to tighten in March 2021. The ongoing deluge of fiscal spending has dulled the impact of tightening Fed policy.
Also dulling the impact of the Fed’s tightening may be the animal spirits unleashed by the exuberance for AI and other state-of-the-art technologies that could boost productivity and prosperity while keeping a lid on inflation. That’s what we see happening in our Roaring 2020s scenario.
Inflation & The Fed
June 12 (Monday)
Check out the accompanying pdf and chart collection.
Executive Summary: Investors are on the edge of their seats: Will the FOMC raise the federal funds rate (FFR) when it meets this week or pass this time? Key will be how fast inflation is falling, and the Consumer Price Index for May will be released as they deliberate. We say monetary policy is restrictive enough already, as the higher effective FFR implies a tighter environment than the straight FFR suggests. … Also: We recap what consumer inflation measures have been doing for goods and for services since peaking last year. The latter has proven more stubbornly persistent than the former. … And: Dr. Ed reviews “BlackBerry” (+ + +).
YRI Weekly Webcast. Join Dr. Ed’s live webcast with Q&A on Mondays at 11 a.m. EST. You will receive an email with the link one hour before showtime. Replays of the weekly webcasts are available here.
Inflation I: The CPI Is Coming! Have you heard? On Tuesday, May’s CPI will be released by the Bureau of Labor Statistics, and it could move the financial markets one way or another.
The same day, the FOMC starts a two-day meeting. The Fed’s research staff will scramble to analyze the latest inflation data, and the monetary policy committee’s participants will have to decide whether they should skip another rate hike or move ahead with yet another one. They have increased the federal funds rate (FFR) at each of the 10 FOMC meetings since March 2022 by a total of 500bps to 5.00%-5.25% in May 2023 (Fig. 1). The FFR futures suggest that the FOMC will hike by 25bps at either the June or the July meeting of the committee (Fig. 2).
May’s CPI obviously will affect their decision. For perspective, April’s CPI was up 4.9% y/y; we’ve long been projecting moderation to 3.0%-4.0% this year. Our bet is that May’s CPI release will sway the committee to skip a hike at the upcoming meeting. In fact, we think they should be done through the end of this year. In our opinion, the FFR is sufficiently restrictive to keep a lid on economic growth and to slow inflation.
The June FOMC meeting will provide the latest quarterly Summary of Economic Projections (SEP). In the December and March SEPs, FOMC participants projected that the FFR would get to 5.1% this year, suggesting that 5.1% might be the terminal rate. In recent months, many of them said that they expect to maintain the restrictive terminal rate for a while. In the March SEP, they also projected that the FFR would fall to 4.1% in 2024 and 3.1% in 2025. (See our FOMC Summary of Economic Projections.)
If they skip a rate hike at this week’s meeting, they might signal their willingness to continue hiking again at the July meeting by raising their FFR projections in June’s SEP. That of course will depend on whether May’s CPI and subsequent inflation readings moderate in line with their projections. In the March SEP, the median headline PCED was projected to fall to 3.3% this year, 2.5% next year, and 2.1% in 2025. It was 4.4% in April.
In March, the FOMC participants deemed this pace of moderation possible without causing a recession, as evidenced by their projected real GDP growth rates at 0.4% this year, 1.2% next year, and 1.9% in 2025. The minutes of the May meeting, which did not include a SEP, suggested that the FOMC participants as a group were in the soft-landing camp even though the Fed’s staff projected a mild recession:
“The economic forecast prepared by the staff for the May FOMC meeting continued to assume that the effects of the expected further tightening in bank credit conditions, amid already tight financial conditions, would lead to a mild recession starting later this year, followed by a moderately paced recovery. Real GDP was projected to decelerate over the next two quarters before declining modestly in both the fourth quarter of this year and the first quarter of next year.”
In other words, the staff acknowledged that the effective FFR is higher than 5.00%-5.25% because of the “further tightening in bank credit conditions.” The staff should have mentioned that quantitative tightening also is raising the effective FFR.
In fact, the Federal Reserve Bank of San Francisco provides a monthly estimate of the effective FFR on their website. Four staff economists at the San Francisco Fed published an article titled “Monetary Policy Stance Is Tighter than Federal Funds Rate” in the November 7, 2022 issue of the FRBSF Economic Letter. Their model calculates an effective federal funds rate (EFFR) using a set of 12 financial variables, including Treasury rates, mortgage rates, and borrowing spreads, to assess the broader stance of monetary policy. Here is their conclusion:
“The FOMC’s use of forward guidance provides more information about future policy than what is reflected in the federal funds rate alone. Similarly, the use of the balance sheet has a monetary policy impact that is not captured in the federal funds rate. A proxy funds rate based on financial conditions measures the broader stance of policy and suggests that these combined policy tools have a more complex effect on the economy than the federal funds rate indicates. The stance of monetary policy in September 2022 was conducted as if the policy rate was above 5¼%, as opposed to the actual rate of 3-3¼%. As the FOMC increasingly used forward guidance and the balance sheet, the proxy rate has tended to lead the actual funds rate, reflecting the fact that financial markets are forward looking.”
The monthly EFFR was almost identical to the actual FRR prior to December 2008, when the rate first fell to zero (Fig. 3). From 2009 to 2015—a period that included QE1, QE2, and QE3—the EFFR was negative most of the time (Fig. 4 and Fig. 5). The EFFR has consistently exceeded the FFR since October 2021.
What about now? As of May, the EFFR was 6.01%, well above the FFR’s reading of 5.06%.
Inflation II: Transitory & Persistent. Inflation has turned out to be both transitory, for consumer goods, and persistent, for consumer services. Nevertheless, it has been moderating and should continue to do so. Over a year ago, in the April 19, 2022 Morning Briefing, Debbie and I wrote:
“History shows that the inflation genie is hard to stuff back in the bottle without a recession first slimming the scoundrel down. Fed officials hope to achieve a Goldilocks soft landing by raising interest rates to cool off the demand side of the economy just enough so that the supply side of the economy isn’t forced to cut back production and employment. They must also be counting on some improvements in the supply-chain problem. We think they might succeed. In our scenario, the PCED headline inflation rate peaks during H1-2022 between 6.0%-7.0%. Led by consumer durable goods prices, it moderates to 4.0%-5.0% during H2-2022. Next year, it falls to 3.0%-4.0% as persistently rising rent inflation offsets moderation in other consumer prices.”
Let’s review the latest developments on the inflation front:
(1) Headline and core inflation rates. The headline PCED inflation rate peaked at 7.0% y/y in June 2022 (Fig. 6). It was down to 4.4% during April. The core PCED inflation rate peaked last year at 5.4% in February. It was down to 4.7% in April. The headline and core CPI inflation rates peaked last year at 9.1% and 6.6% in June and September, respectively, falling to 4.9% and 5.5% by April.
(2) Transitory inflation. CPI goods inflation has turned out to be quite transitory after all, having peaked at 14.2% last March before dropping to 2.1% in April (Fig. 7). The CPI for consumer durables plunged from last year’s high of 18.7% to -0.2% in April (Fig. 8). The CPI for nondurable goods (including food and energy) is down from 16.2% last June to 3.2% in April (Fig. 9).
(3) Disinflation correlations. Services account for 61.5% of the CPI. So it isn’t surprising that the CPI inflation rate on a y/y basis is highly correlated with the ISM Services prices paid index, pushed ahead by three months (Fig. 10). The actual latter series fell from a peak of 84.5 in December 2021 to 56.2 in May 2023.
That implies that the CPI inflation rate is on track to fall to 3.0% by August! But it’s a little hard to believe that will happen since rent isn’t reflected in the ISM measure but is a major component of the CPI. Rent inflation seems to be peaking only now and might take a while to fall back down to its pre-pandemic pace.
Christmas comes in December, not September, but maybe it will arrive three months early this year for investors. Christmas might come in September if we can rely on the correlation between the CPI inflation rate and the percent of small business owners planning to raise their average selling prices, pushed ahead by five months (Fig. 11). The actual latter series peaked at a record 54% in November 2021 and fell to 21% in April 2023. That suggests that the CPI inflation rate could fall to 3.0% by September.
(4) PPI and CPI for personal consumption. While the CPI was still up 4.9% y/y through April, the PPI for personal consumption was up only 2.7% y/y through April, little changed from March’s 26-month low of 2.5% and down dramatically from last year’s peak of 10.4% in March 2022 (Fig. 12). The PPI does not include rent either.
(5) Rent. The CPI measures of rent inflation remained elevated in April, with primary residence at 8.8% and owners’ equivalent rent at 8.1% (Fig. 13). However, the three-month annualized rates for both fell to 7.3% and 6.9%, suggesting that both have peaked.
(6) Food & energy. Clearly peaking is the CPI foods index (Fig. 14). The y/y rate was 7.7% through April, but the three-month annualized rate was down to 1.7%. The CPI energy index peaked at 41.6% y/y in June 2022. It was down to -5.1% in April.
(7) Core services inflation excluding housing. Fed officials are particularly concerned about the stickiness of the core services PCED ex-housing costs inflation rate (Fig. 15). It has been stuck around 4%-5% for the past 11 months through April. The comparable series for the CPI is for services excluding energy and shelter. It peaked at 6.7% in September 2022 and fell to 5.0% through April.
Movie. “BlackBerry” (+ + +) (link) is a fascinating and fast-paced docudrama about the very rapid rise and fall of Research In Motion, the Canadian tech company that invented the BlackBerry cell phone. This film is part of a new genre of movies about the development and marketing of new products. “Air” is about Nike’s launch of its Air Jordan sneakers. “Tetris” is about a new game introduced by Nintendo. A few I reviewed last year are “WeCrashed” (about WeWork), “The Dropout” (Theranos), and “SuperPumped” (Uber). They all are interesting depictions of how free market capitalism works. The entrepreneurs behind these inventions are all driven by the profit motive to produce the next New New Thing that will be a big hit with consumers. While some of the entrepreneurs have remained successful, others have crashed, often when competitors came up with a better product; in a few instances, they broke the law. BlackBerry was buried by Apple’s iPhone. Capitalism’s most consistent winners are consumers.
The AI Future & Health Care
June 08 (Thursday)
Check out the accompanying pdf and chart collection.
Executive Summary: Don’t fear AI, just China’s AI aspirations. Out with the CPU, in with the GPU. AI is bound to transform every business process, bar none. Three well respected tech visionaries have been describing our AI-enhanced future with optimistic messages that they insist are not hyperbole. … And: Don’t overlook the lagging S&P 500 Health Care sector’s potential for a rebound given exciting developments in its biotech and pharma industries. Jackie recaps some of the highlights.
Technology: The AI Wizards Speak. In recent days, three Silicon Valley entrepreneurs have been vocal about the wonders of artificial intelligence (AI). We mean none other than the founding (or co-founding) brains behind Netscape, Nvidia, and both Siebel Systems and C3.ai—respectively Marc Andreessen, Jensen Huang, and Tom Siebel.
Andreessen instructs us not to fear AI because it will make our lives better—if we can beat China to the punch. Huang tells us that the world’s data centers will all dump their slow, dumb systems and adopt accelerated computing, which conveniently uses Nvidia’s GPUs. And Siebel, who believes we are in the first half of the first inning of the AI transition, believes companies will use AI across all business processes.
Let’s take a deeper look at what these three gentlemen have to say:
(1) AI will save the world. To say that Andreessen, a renowned venture capitalist, co-founder of Netscape, and a Meta Platforms board member, is a fan of AI is an understatement. “AI is quite possibly the most important—and best—thing our civilization has ever created, certainly on par with electricity and microchips, and probably well beyond those,” he wrote in a June 6 missive that’s a worthwhile read.
AI is generated by computer programs that are owned and controlled by people, he emphasizes, not malevolent, uncontrollable software running killer robots that will end society as we know it. Such fears are held by irrational people who aren’t basing their opinions on scientific facts, he contends. Or else, they’re held by folks who stand to benefit by making others fearful of AI.
Andreessen envisions a world where every child will have an infinitely patient AI tutor, every person will have an AI assistant, mentor, trainer, advisor, or therapist. And every scientist, artist, businessperson, doctor, etc. will have an AI assistant that will expand the scope of their research or work and achievement. Scientific breakthroughs, new technologies, and new medicines will expand dramatically, as will productivity.
We shouldn’t allow the thought police to suppress AI, he warns. “AI is highly likely to be the control layer for everything in the world. How it is allowed to operate is going to matter, perhaps more than anything else has ever mattered.”
AI won’t take our jobs. Like technologies that came before it, AI will increase the number of jobs as well as wages. AI “may cause the most dramatic and sustained economic boom of all time.” AI ultimately will expand until it’s in the hands of everyone on the planet. Already generative AI is available for free in the form of Microsoft’s Big and Google’s Bard.
Andreessen acknowledges that bad people will attempt to commit crimes using AI. But there are laws that make those crimes illegal. The “good guys” have access to AI too, so they can create systems that prevent bad things from happening. For example, people worried about AI-generated fakes should build systems where people can verify themselves using cryptographic signatures (see our June 1 Morning Briefing for more on such authentication methods).
Andreessen is far more concerned about AI in the hands of the Chinese Communist Party, which is already using AI to control citizens in China and those in countries that have received Chinese Belt and Road funding or watch consumer apps like TikTok. “The single greatest risk of AI is that China wins global AI dominance and we—the United States and the West—do not.”
We “should drive AI into our economy and society as fast and hard as we possibly can in order to maximize its gains for economic productivity and human potential,” he writes. Let companies, both big and small, build AI as fast as possible and compete in a free market. Opensource AI should be available to all, including students—enabling them also to compete with large and small companies.
“To prevent the risk of China achieving global AI dominance, we should use the full power of our private sector, our scientific establishment, and our governments in concert to drive American and Western AI to absolute global dominance, including ultimately inside China itself. We win, they lose. And that is how we use AI to save the world.”
(2) AI needs new tech equipment. Nvidia’s CEO Jensen Huang had been steering his company to build GPU chips, hardware, and software that enables accelerated computing. Accelerated computing replaces traditional, linear computer processing, where tasks are performed one at a time using CPU chips. By allowing a computer to process multiple tasks at the same time, accelerated computing saves time, money, and energy.
As Nvidia was developing accelerated computing, ChatGPT was unveiled, and AI captured the world’s attention. AI, with the complex computer processing it requires, is the killer app for accelerated computing. Data centers will need to replace their “dumb” traditional systems with systems that have smart networking equipment, smart software, and GPUs to enable accelerated computing.
“[W]e’re seeing incredible orders to retool the world’s data centers,” said Huang in the company’s May 24 earnings conference call. “[Y]ou’re seeing the beginning of call it a 10-year transition to basically recycle or reclaim the world’s data centers and build it out as accelerated computing.” Since that earnings conference call, Nvidia’s shares have rallied 26.0% versus a 3.3% gain in the S&P 500 and a 5.7% gain in the Nasdaq.
(3) AI throughout the corporation. C3.ai CEO Tom Siebel didn’t hold back when gushing over the AI opportunity during the company’s May 31 earnings conference call: “I [do] not believe that it’s an overstatement to say there is no technology leader, no business leader and no government leader who is not thinking about AI daily. … Business inquiries are increasing, the opportunity pipeline is growing, demand is increasing. … The interest in applying AI to business processes is substantially greater than we have ever seen.”
C3’s AI systems tap into a company’s data to answer questions. The AI will admit not knowing the answer to an inquiry instead of making up an answer (“hallucinating”), as ChatGPT has been known to do. Its programs also provide traceability, so you can see what data was used to arrive at the answer.
“In terms of applying AI to enterprise, we’re in the first half of the first inning. … [I]t’s clear we will be applying AI to all business processes, production optimization, demand forecasting … stochastic optimization, the supply chain, CRM. I think there is no aspect of business operations … that will not be accelerated by the use of AI. … It is a rocket ship.”
The company, which sells AI software applications to corporations and governments, counts the US Air Force as a client. To win the Air Force contract, C3 had promised its predictive maintenance software would help increase aircraft availability by 25% and decrease the cost of maintenance and readiness by about $6 billion. Now the Air Force uses C3’s predictive maintenance program on all its assets, not just its planes.
Health Care: Looking for a Cure. The S&P 500 Health Care sector’s stock price index has been a serious laggard ytd. The S&P 500 rally has returned, and investors are no longer looking to the Health Care sector as a safe haven, as they were in the second half of 2022. But investors deserting health care stocks in general, and biotech and pharma stocks specifically, are ignoring some of the great advancements that have occurred in drug development. If interest rates have topped out, as we suspect they have, the S&P 500 Biotechnology industry’s stocks could benefit as new drugs come to market and the S&P 500 Pharmaceutical industry’s stocks could benefit as older drug companies acquire young ones to fill their pipelines.
The Health Care sector’s stock price index has fallen 4.8% ytd through Tuesday’s close, compared to the 11.6% gain in the S&P 500 and the 34.9% gain in the top-performing Information Technology sector. The S&P 500 Biotechnology industry has had an even rougher start to the year, falling 10.6% through Tuesday’s close (Fig. 1). Moderna, the Covid-vaccine developer, is among the stocks in the biotech index, as is Regeneron, which developed a Covid treatment. Both companies have faced tough comparisons now that the pandemic has passed. Even the iShares Biotechnology ETF (IBB), with its smaller constituents, has had a tough 2023, falling 1.7% ytd through Tuesday’s close.
Are the auspices right for a rebound in biotech stocks? Let’s take a look:
(1) Filling pipelines. There has been lots of uplifting news about new drug treatments for ailments that range from cancer to Alzheimer’s. Some of the following trials were highlighted at this week’s American Society of Clinical Oncology meeting in Chicago.
AstraZeneca’s Tagrisso, a treatment for lung cancer, halved the death rate for early-stage cancer patients who had undergone surgery, a June 5 CNBC article reported. The drug is approved in the US and more than 100 countries, but this study may make physicians more inclined to prescribe it and insurers more willing to pay for it. It was given to people with stage 1, 2, and 3 non-small cell lung cancer who also had a mutation in a receptor called “EGFR.” The mutation can make cells divide and multiply excessively, which may cause cancer. The pill functions as an “off” switch for that receptor, the article reported.
There was also good news for breast cancer patients. Ribociclib—owned by Novartis and marketed under the brand name “Kisqali”—was shown to slash the chances of breast cancer returning by 25% when used with standard hormone therapy compared to using hormone therapy alone. The small molecule inhibitor targets cancer-cell proteins that affect cell growth. The drug had already been approved by US regulators to treat cancer that had metastasized, but now it has been shown to help patients with early-stage breast cancer as well, a June 2 article in The Guardian reported. Its efficacy was slightly less than a drug by Eli Lilly, but it had a more favorable side-effects profile.
Skin cancer patients learned that a mRNA-based vaccine from Moderna and Merck reduces the risk that melanoma would spread by 65% versus another treatment in a mid-stage trial. “The findings add to a growing body of evidence suggesting that mRNA technology … can be used to assemble personalized vaccines that train the immune system to attack the specific type of cancer cells in a patient’s tumors,” a June 5 Reuters article reported.
In January, the Food & Drug Administration gave early approval to Leqembi, an Alzheimer’s drug from Eisai and Biogen that may slow the disease’s progression in its early stages. Eisai has said that it would sell the drug, which is not covered by Medicare, for $26,500 a year.
(2) Fighting with the feds. The Inflation Reduction Act has cast a pall over some drug stocks because it allows the federal government to negotiate drug prices on behalf of Medicare, and it was expected to save $25 billion annually by 2031. Merck sued the US government on Tuesday, seeking an injunction of the drug price negotiation program, contending that it violates the Fifth and First Amendments to the US Constitution, a June 6 Reuters article reported.
The Fifth Amendment “requires the government to pay just compensation for private property taken for public use.” The First Amendment is breached when the government forces companies to sign agreements saying the drug prices are fair. The program’s negotiations are slated to begin in September on the 10 drugs identified by the Centers for Medicare & Medicaid Services as most costly.
The Federal Trade Commission (FTC) also shocked health care investors when it filed a lawsuit in federal court seeking to block Amgen’s $27.8 billion acquisition of Horizon Therapeutics. The agency contends that the acquisition “would allow Amgen to ‘entrench the monopoly positions’ of Horizon’s eye and gout drugs,” which don’t currently face any competition, a May 16 WSJ article reported. The FTC said Amgen could offer higher rebates on the two drugs to companies that manage drug benefits in exchange for the drugs receiving a “preferred position on lists of covered medicines.” Amgen said that it has told the FTC it would do no such thing.
(3) Tough Covid comps. Moderna represents one of the best examples of Covid’s impact on companies’ income statements. The maker of the mRNA vaccine that now protects us against Covid saw its fortunes soar during the pandemic. The company’s earnings jumped to $20.10 a share in 2022, and its shares rocketed from $20.51 on January 1, 2020, to a peak of $484.47 on August 9, 2021. Now that the pandemic has passed, analysts forecast a loss of $2.14 a share in 2023 and a loss of $4.10 in 2024, and Moderna shares have fallen to $126.90 as of Tuesday’s close.
Likewise, earnings for the S&P 500 Biotechnology industry rose 12.1% in 2020 and 39.5% in 2021, only to fall by 2.5% last year. Industry analysts’ consensus forecasts imply another 22.0% drop in earnings this year and a return to growth next year, when earnings are expected to inch higher by 3.1% (Fig. 2). The swing isn’t as large as that of the S&P 500 Pharmaceutical industry, which reported a 15.7% jump in earnings last year but is expected to experience a 15.5% decline in earnings this year with a recovery of 9.5% earnings growth forecast in 2024 (Fig. 3).
Forward P/E multiples in both industries have held up, but they are far below the S&P 500’s multiple, which has expanded. The S&P 500 Biotechnology industry’s forward P/E is 14.8, and the S&P 500 Pharmaceutical industry’s forward P/E is 14.7, compared to the S&P 500’s forward P/E of 18.1 (Fig. 4 and Fig. 5).
(4) IPO market shut tight. The biotech industry gets much of its public funding from the IPO market, and the IPO window has been slammed shut this year. The amount of funding raised by US IPOs has fallen by 33% ytd, according to Dealogic data in the WSJ. The impact on the health care sector has been even more dramatic, with only $1.1 billion raised in US health care IPOs, down from the $2.0 billion raised during the same period in 2022. However, continued innovation and falling private-market valuations have helped venture capitalists raise $6.8 billion during Q1; annualized, that represents a faster pace than the $21.8 billion raised during 2022 and isn’t far from the $28.3 billion raised during the record-high year of 2021.
Investors are optimistic about the future impacts of AI on the industry. “[S]tartups [are applying] machine-learning to ever-larger biological and medical data sets to create insights that will lead to new treatments and better patient care,” a May 25 WSJ article noted. “Companies we’re funding today are not just a chemist and a biologist, there’s a computer scientist in the mix and there’s a heavy computational component,” said Stuart Peterson, managing partner of Artis Ventures, a venture firm that seeks opportunities at the intersection of biology, health, and technologies, such as AI.
View From The Pits
June 07 (Wednesday)
Check out the accompanying pdf and chart collection.
Executive Summary: Commodities markets have been on a wild ride in recent years, buffeted by pandemic impacts specific to each. The present time finds oil prices weakened by a global supply/demand imbalance, raw industrials prices depressed by China’s weak recovery and US recession fears, lumber prices down owing to soft single-family home construction, and both natural gas and most agricultural prices far from their peaks. … The ripple effects of this commodities scenario include downward inflation pressure and upward dollar pressure. … Also: Joe shares his takeaways from S&P 500 Q1 earnings now that most companies have reported and most analysts have tweaked their forecasts.
Commodities I: Oil Market Is Fluid. Over the past weekend, at the OPEC+ meeting in Vienna, Saudi Energy Minister Prince Abdulaziz bin Salman announced a surprising one-month reduction in Saudi crude oil output of 1.0 million barrels per day (mbd) during July. That comes after several OPEC+ producers announced a combined 1.66 mbd of production declines until the end of this year. At the latest Vienna meeting, the oil cartel’s members agreed to extend their cuts through the end of 2024. As we noted yesterday, both the April cuts and the latest Saudi cut aren’t boosting prices. Instead, they may be slowing the descent of oil prices (Fig. 1).
Yesterday, Bloomberg reported: “Some Asian refiners are considering buying more crude from Russia and Africa after Saudi Arabia surprised the market by raising prices for its oil following an unexpected pledge to reduce output. At least three Asian refiners are considering asking for less contracted crude from Saudi Arabia in July, and may tap the spot market for cheaper cargoes, according to people familiar with the companies’ trading strategies.”
The fundamental supply-side problem in the oil market is that the Russians need to sell oil to raise revenues no matter the price, to fund their war with Ukraine. The Saudis need a higher price to boost their revenues to fund their ambitious projects at home. On the demand side, China’s latest moves to boost its economy didn’t do much to lift oil prices yesterday when Chinese authorities asked the nation’s biggest banks to lower their deposit rates for at least the second time in less than a year. The oil market yawned.
Commodities II: Raw Industrials Prices Flagging. The CRB raw industrials spot price index, which does not include petroleum or wood products, peaked at a record high on April 4, 2022 (Fig. 2). The index is down 20% since then through June 5.
The metals component of the index peaked at a record high also on April 4, 2022 (Fig. 3). It plunged 36% through October 31 and jumped 26% through January 26 on expectations that China’s economy would rebound strongly once the country’s Covid lockdown was lifted in early December. But since then, the index is down 13% through June 5 on disappointment over China’s weak recovery. Also weighing on commodity prices has been concern that the US banking crisis that began in March might cause a recession.
Commodities III: Knock on Wood. The pandemic was a shock, and it has been followed by aftershocks. It certainly had a wild impact on the nearby futures price of lumber (Fig. 4). It soared following the end of the US lockdowns through the first half of 2021. The pandemic boosted the demand for single-family homes away from urban centers, with backyards and space for home offices and remote learning.
By mid-2021, lumber prices tumbled only to soar again in early 2022. Since then, prices have tumbled again, down to pre-pandemic levels, as soaring mortgage rates depressed single-family housing starts.
Commodities IV: Out of Gas. Another similar wild rollercoaster ride since the pandemic started was in the natural gas market. In the US, its price increased almost five-fold from mid-2020 through the end of 2022 (Fig. 5). Since then, it has plunged back down to its pre-pandemic readings.
Since 1977, the US has switched from being a net importer of natural gas to a significant net exporter of gas (Fig. 6). US exports were boosted by demand from Europe last summer when Europeans had to scramble to replace Russian oil sources.
Commodities V: Where’s the Beef? Agricultural prices also mostly peaked late last year and have continued to moderate so far this year, though grain prices remain elevated at levels coinciding with the start of Russia’s invasion of Ukraine (Fig. 7).
On the other hand, live cattle futures have been soaring since mid-2020 (Fig. 8). The May 28 WSJ explained: “Rising costs for feed and other expenses are leading ranchers to sell their calves into feedlots at a faster pace, according to federal data, leaving fewer cattle available for slaughter later this year and in 2023. Persistent drought conditions in the Western U.S. have parched grazing pastures, requiring cattlemen to spend more on supplemental feed, ranchers and beef industry officials said.”
Commodities VI: Inflation & The Dollar. The brief review of commodity prices above supports our view that inflationary pressures are moderating in the commodity pits (except for live cattle).
There tends to be an inverse correlation between the trade-weighted dollar and the S&P GSCI commodity price index (Fig. 9). The dollar tends to do well when weak global economic activity is weighing on commodity prices. That seems to describe the current situation and explains why the dollar has firmed up in recent weeks.
Strategy: Q1 Earnings Results. With just a handful of companies left to report Q1 results, Joe reports that S&P and I/B/E/S have compiled their near-final data for S&P 500 companies’ Q1 earnings per share. We’re still awaiting S&P’s final figures for revenues and the profit margins, which we’ll analyze after they’re released in the next few days.
While we track both S&P’s and I/B/E/S’ quarterly operating earnings numbers, we generally focus on the I/B/E/S data, especially because we use their data services’ measure of forward earnings. In our opinion, the stock market discounts the consensus, or “majority-rule,” operating earnings over the coming 12 months rather than S&P’s own definition of operating earnings.
For now, let’s focus on the bottom-line numbers for Q1:
(1) S&P 500 Q1 earnings. S&P 500 operating earnings per share was $53.26 during Q1 according to I/B/E/S, down 3.0% y/y and 8.1% below its record EPS from Q2-2022. The y/y earnings growth rate slowed for a seventh straight quarter and was negative for a second straight quarter, after having edged down 1.7% y/y during Q4-2022 (Fig. 10). According to S&P, operating earnings per share was $52.80 during Q1, up 7.0% y/y and positive for the first time in four quarters. However, S&P’s EPS remains 6.9% below its record high of $56.73 during Q4-2021. The peak-to-trough declines in operating EPS thus far have been modest relative to those of past downturns.
(2) Earnings according to S&P and I/B/E/S. By the way, S&P and I/B/E/S each has their own polling services and derives their estimates and actuals on a different basis. S&P adheres to a stricter in-house definition of operating earnings, while I/B/E/S follows a consensus “majority rule” for presenting companies’ earnings forecasts. The industry analysts polled by I/B/E/S typically follow companies on an adjusted earnings basis (i.e., EBBS, or “earnings excluding bad stuff,” a.k.a. write-offs), which makes for a higher earnings series than S&P’s. Since Q1-1993, the two series have diverged an average of 5.1%.
During Q1, I/B/E/S’ operating EPS actual figure of $53.26 was just 0.9% higher than S&P’s $52.80. That was the smallest divergence between the two actuals since Q3-2010. It has declined each quarter since Q2-2022, when it peaked at a nine-quarter high of 23.6%, owing mainly to their treatment of the mark-to-market accounting for Berkshire Hathaway’s actual then.
(3) S&P 500 sectors’ Q1 growth. Four of the 11 S&P 500 sectors recorded positive y/y earnings growth in Q1, unchanged from Q4-2022’s count. Among the gainers, Consumer Staples rose y/y for an 11th straight quarter, and Industrials was up for an eighth quarter. Energy rose y/y for a ninth quarter in a row but posted its slowest growth since Q4-2020. Information Technology was down for an unusually lengthy fourth straight quarter as the sector’s fortunes continued to wind down from the Covid-19 spending boom (Fig. 11).
Here’s how the sectors’ y/y earnings growth rates stacked up in Q1-2023: Consumer Discretionary (41.1%), Industrials (29.1), Energy (17.6), Consumer Staples (1.3), S&P 500 (-3.0), Financials (-5.0), Information Technology (-9.3), Real Estate (-13.8), Communication Services (-15.1), Health Care (-15.1), Materials (-19.0), and Utilities (-21.1).
(4) Q2-2023 estimate revisions. With a month to go before companies close their books on Q2, the recent estimate revisions trend has been encouraging. Analysts’ collective Q2 earnings forecast for the S&P 500 companies is down just 1.8% since the beginning of the quarter, markedly less than the 6.2% decline seen in the Q1-2023 estimate over a similar time period. That’s also well above the average 4.0% decline seen in all the quarters since 1994.
Among the 11 S&P 500 sectors, five have fared much better than the historical average: Two—Communication Services and Information Technology—have seen their Q2 EPS estimates actually rise since the start of the quarter. And three—Consumer Discretionary, Financials, and Industrials—have had estimate cuts of less than 1%. Such light-handed estimate changing during the quarter sets the table for another strong earnings surprise in Q2.
(5) Q2 growth forecasts. Analysts currently expect six of the 11 S&P 500 sectors to record positive y/y growth in Q2-2023, but S&P 500 earnings are expected to fall 8.1% on a frozen-actual basis in what is likely to be the worst of the y/y comparisons for this cycle.
Here are the analysts’ latest proforma y/y Q2-2023 earnings growth rate estimates for the 11 sectors of the S&P 500 versus their final growth rates for Q1-2023 as of the week of June 2: Consumer Discretionary (24.8% in Q2-2023 versus 56.0% in Q1-2023), Financials (10.6, 7.8), Communication Services (9.4, -9.0), Industrials (6.1, 27.0), Consumer Staples (2.2, 0.2), Utilities (0.3, -21.8), S&P 500 ex-Energy (0.0, -1.7), Information Technology (-3.6, -8.5), Real Estate (-4.9, -7.7), S&P 500 (-5.4, -0.01), Health Care (-15.6, -14.8), Materials (-27.2, -22.2), and Energy (-43.4, 20.9).
Slippery Slopes
June 06 (Tuesday)
Check out the accompanying pdf and chart collection.
Executive Summary: Oil prices are slipping notwithstanding Saudi Arabia’s production cuts, which aren’t as effective at halting such slides as they used to be. Too much global oil production capacity in the world relative to too little demand is the problem. … If oil prices are on a slippery slope, so is inflation; indeed, the latest inflation indicators suggest it is continuing to moderate. … As for the latest economic indicators, the NM-PMI and LEI are misleading. Their weakness doesn’t point to a broad-based recession. The forecast still looks like a rolling recession to us.
Slippery Slope I: Crude Oil. The Saudis are kicking the barrel down the road. Saudi Energy Minister Prince Abdulaziz bin Salman announced an extra 1 million barrel-a-day (mbd) supply cut in July following a tense OPEC+ meeting in Vienna over the weekend. “Others in the group pledged to maintain existing cuts until the end of 2024,” Bloomberg reported, “though Russia made no commitment to curb output further and the United Arab Emirates secured a higher production quota for next year.”
The price of a barrel of West Texas Intermediate (WTI) crude oil tumbled 11% last month as concerns about demand, especially from China, weighed on the market. Bloomberg reported that the Saudi oil minister pledged at the meeting to do “whatever is necessary to bring stability to this market.” In the days prior, he had warned bears in the futures markets to “watch out.” The markets are likely to call his bluff.
The Saudis’ problem isn’t bears in the futures market but rather too much world oil production and not enough world oil demand. Reducing their output by 1.0 mbd for one month isn’t likely to fix the imbalance. The problem is that the Russians are selling whatever they can at a discount to China and India. The US and Canada are pumping more oil. And global demand for oil has been weak, especially in China.
Consider the following:
(1) Saudis vs contango. Production cuts began in October, when OPEC+ reduced supply by 2.0 mbd. Then in February, Russia announced that it would reduce production by 0.5 mbd in March; when March arrived, Russia extended the cuts through the end of June.
But the oil market shrugged off both production cuts because economic growth and demand for oil were expected to slow. Central bankers around the world were busy raising interest rates to fight inflation when the US banking crisis arrived in March, sparking fears of a global recession. Despite the oil production cuts, the price of a barrel of Brent crude oil futures fell from a November 4 high of $98.57 to a low of $72.97 on March 17 (Fig. 1).
It took a third production cut on Sunday, April 2 to grab investors’ attention. Saudi Arabia and other OPEC+ members announced plans to cut production by another 1.2 mbd from May through year-end. Together, the three cuts take roughly 3.7% of the world’s oil off the market. And the oil market responded: The price of Brent crude oil futures jumped to $84.94 as of the April 4 close, up $5.17 from before Sunday’s cut and up $11.97 from its low on March 17.
But on Friday, June 2, the price of a barrel of Brent was back down to $76.13. The Brent futures market was in contango: nearby ($76.13), 6-month ($74.61), 1-year ($72.89), and 2-year ($70.41) (Fig. 2).
(2) Russian roulette. On May 30, Bloomberg reported: “Russian crude oil flows to international markets are edging lower, but still show no substantive sign of the output cuts that the Kremlin insists the country is making. Four-week average seaborne shipments, which smooth out some of the volatility in weekly numbers, fell for the first time in six weeks in the period to May 28, slipping to 3.64 million barrels a day. But crude flows to international markets remain elevated and are still more than 1.4 million barrels a day higher than they were at the end of last year and 270,000 barrels a day up on February, the baseline month for the pledged cut.”
(3) WTI & US oil field production. The price of a barrel of WTI has been as weak as the Brent price, dropping from a high this year of $ $83.26 on April 12 to $71.74 on Friday (Fig. 3). Yet US crude oil field production has increased since early September 2021 from 10.0 mbd to 12.2 mbd at the end of May (Fig. 4).
(4) Total US production, demand, & net exports. The US is the world’s largest producer of petroleum, producing a near-record 20.4 mbd during April. That includes crude oil field production (12.3 mbd), natural gas liquids (5.9 mbd), and biofuels plus processing gains (2.2 mbd) (Fig. 5).
April’s US production is higher (at 21.9 mbd) if it is imputed as products supplied (20.0 mbd) minus net imports (-1.9 mbd) (Fig. 6). In any event, data reported by the US Department of Energy (DOE) show that the US has been a consistent (though slight) net exporter of petroleum since early 2022.
(5) Global crude oil production. The DOE also compiles data on global crude oil production, though the latest available data are only through February. They show a V-shaped post-lockdown recovery from a low of 70.3 mbd during June 2020 to 82.3 mbd during February, back near the pre-pandemic pace of production (Fig. 7).
Saudi Arabia and Russia each were producing about 11.0 mbd of crude oil in the months prior to the pandemic (Fig. 8). The US and Canada combined produced more than 17.0 mbd prior to the pandemic and are probably producing as much now. Saudi Arabia and Russia are both struggling to achieve their pre-pandemic highs.
(6) China syndrome. What does Professor Copper, the base metal with a PhD in economics, have to say about the price of oil? The price of copper and the price of Brent are highly correlated (Fig. 9). That’s because both reflect the pace of global economic activity, falling (rising) when it is weak (strong).
Both copper and oil prices are especially sensitive to developments in China. They diverged earlier this year when the price of copper rallied on expectations that the end of China’s Covid lockdowns would boost China’s economic activity significantly. Professor Crude disagreed with Professor Copper’s bullishness and seems to have been correct in her assessment, as the price of copper has been falling since January 26 on disappointing economic news from China. China’s M-PMI was especially weak during May, when the index and its major components were all below 50.0 (Fig. 10).
(7) Bottom line. The price of WTI closed at $71.74 on Friday. It jumped to $74.20 on Sunday at 6:10 p.m. It was back down to $71.91 at the end of Monday.
Slippery Slope II: Inflation. If the price of oil is on a slippery slope, then inflation probably also is on a slippery slope. We believe that inflation will continue to moderate. Here are some relevant recent developments:
(1) Yesterday, we were encouraged to see the prices-paid index in the ISM’s NM-PMI fell from 59.6 in April to 56.2 in May (Fig. 11). That’s because it is a great three-month leading indicator of the CPI inflation rate on a y/y basis. It suggests that the latter could fall below 3.0% later this summer!
(2) That’s confirmed by the NFIB’s small business survey, which found that the percent of small business owners planning to raise their average selling price fell to 21.0% in May, down from a peak of 54.0% during November 2021 (Fig. 12). This series tends to be a very good five-month leading indicator of the CPI inflation rate. So it is predicting a sub-3.0% inflation rate this fall.
(3) The prices-paid index of the M-PMI is a good three-month leading indicator of the y/y inflation rate in the CPI goods index (Fig. 13). The latter was 2.1% in April. It should be slightly negative later this coming summer.
Slippery Slope III: Recession Forecasts. Yesterday’s NM-PMI release was weaker than widely expected. After all, consumers are deemed to have pivoted away from buying goods to purchasing services instead. Yet the overall NM-PMI fell from 51.9 in April to 50.3 in May (Fig. 14). It is down from a peak of 67.6 during November 2021.
While this index is often called the “Services PMI,” it is actually for the nonmanufacturing sector including construction, which has been a relatively weak industry, especially for single-family homes.
Yes, but how about the M-PMI? It has been below 50.0 since November and edged down from 47.1 in April to 46.9 in May (Fig. 15). It is also highly correlated with the Index of Leading Economic Indicators (LEI) on a y/y percentage basis.
That’s true, but the weakness in the M-PMI is consistent with our rolling recession forecast, as it is rolling through the goods sector of the economy, while the services sector remains stronger than misleadingly suggested by the latest NM-PMI report. Also misleading is the LEI, which seems to be biased to reflect what is happening in the goods sector much more than the services sector.
Recession forecasters should take note of the misleading signals sent by the NM-PMI and the LEI. The forecast still looks to us like a rolling recession, not a broad-based recession of the economy as a whole.
MAMU & MAMA
June 05 (Monday)
Check out the accompanying pdf and chart collection.
Executive Summary: Is all the AI euphoria leading the stock market into another “MAMU”—“Mother of All Meltups”? If so, our 4600 target for the S&P 500 by year-end might prove conservative, not controversial. This bull market began differently than most, with higher P/Es at the outset, and this MAMU’s timing would be different, early in the bull market versus late. … Lifting the economy has been “MAMA”—“Make America Manufacture Again.” Manufacturing capacity—flat since 2011—is about to expand given all the factory building implied by the 150% two-year surge in nonresidential construction of factories. Also: The job market refuses to land, but wage inflation is coasting lower. … Dr. Ed reviews “After Waco” (+ + +).
YRI Weekly Webcast. Join Dr. Ed’s live webcast with Q&A on Mondays at 11 a.m. EST. You will receive an email with the link one hour before showtime. Replays of the weekly webcasts are available here.
Strategy: Remembering MAMU. You might recall that Joe and I coined the acronym “MAMU” in the May 16, 2013 Morning Briefing. We wrote: “After the widely dreaded ‘fiscal cliff’ scare turned out to be a non-event at the start of 2013, [stock investors] were tired of being anxious that the bull would get tripped by a bear.” We opined: “Perhaps now that investors are no longer fearful that the end is near, all the liquidity pumped into the financial markets by the major central banks over the past four years to avert the Endgame scenario is about to cause the Mother of All Melt-Ups (MAMU).”
The ensuing MAMU ended on February 9, 2020 as the pandemic hit. The next MAMU started soon after on March 23, 2020, when the Fed announced QE4ever, and ended on January 3, 2022, when investors started to conclude that nothing is forever in the stock market. The recent bear market ended on October 12. Now that the latest fiscal cliff has been averted, is another MAMU starting, led by stocks that are AI frenzy plays? Maybe.
In any event, the S&P 500 rose to a new 2023 high on Friday, providing support to our call in late October that the index had bottomed on October 12 (Fig. 1). It is up 19.7% since then to its highest reading since August 18, 2022. The Nasdaq bottomed on December 28 of last year and is up 29.6% since then to the highest reading since April 20, 2022 (Fig. 2).
You also might recall that since the start of this year, Joe and I have been targeting 4600 on the S&P 500 by the end of this year. That was a contrary call. We sure hope this bull market doesn’t get there too far ahead of schedule. Past MAMUs have always occurred at the end of bull markets, not when they are just starting.
The latest bear market ended with much higher valuation multiples than most previous ones. The forward P/E of the S&P 500 was 15.1 on October 12. It was 18.3 on Friday (Fig. 3). The forward P/E of the MegaCap-8 was 29.6 on Friday. Excluding them, the forward P/E of the S&P 492 was 15.6. Most astonishing is that the MegaCap-8’s market cap has melted up by 58.1% from this year’s low of $6.8 trillion on January 5 to $10.7 trillion through Friday’s close. Together, these eight stocks (i.e., Alphabet, Amazon, Apple, Meta, Microsoft, Netflix, Nvidia, and Tesla) now account for a record 26.6% of the market cap of the S&P 500 (Fig. 4).
US Economy I: Coming Home to MAMA. Now Jackie and I are coining another acronym: “MAMA.” It stands for “Making America Manufacture Again.” In our May 4 Morning Briefing, we wrote: “Manufacturers, large and small, domestic and foreign, are tapping into the trillions of dollars of incentives available in the CHIPS and Science Act, the Inflation Reduction Act (IRA), and the Infrastructure Investment and Jobs Act to build factories in the US. They plan to make semiconductors, batteries, solar equipment, electric vehicles (EVs), and green hydrogen, among other things. So many manufacturers have locked down locations for new plants that it’s now hard to find shovel-ready ‘megasites,’ an April 13 Reuters article reported.
“If the US manages to skirt a recession, it will be due in good part to the massive capital spending and building related to these plants. As we’ve noted before, capital spending in real GDP rose to a record high of $3 trillion (saar) during Q1-2023, and manufacturing construction put in place jumped 62.3% y/y through March to its latest record high of $147.4 billion. Many of the proposed factories have yet to break ground and are not reflected in these numbers. Assuming that the projects go forward, building and then operating these facilities should provide an economic tailwind.”
Notwithstanding the recession rolling through the single-family housing industry, construction spending rose to yet another record high in April (Fig. 5). Leading the way has been nonresidential construction, particularly of manufacturing facilities (Fig. 6). The latter rose to yet another record high of $189.0 billion (saar) during April, up a whopping 152.2% over the past 24 months (Fig. 7).
No wonder payroll employment in construction rose to yet another record high during May, of 7.9 million (Fig. 8). Payroll employment in heavy and civil engineering construction also rose to a record high last month, of 1.1 million (Fig. 9).
MAMA mia!
By the way, keep in mind that manufacturing capacity in the US has been flat since China joined the World Trade Organization on December 11, 2011 (Fig. 10). Now it should start expanding again.
US Economy II: Job Market Refuses To Land, But … Payroll employment rose 0.2% m/m to yet another new record high during May. However, average weekly hours fell 0.3%. As a result, our Earned Income Proxy (EIP) for private-sector wages and salaries in personal income rose just 0.2%, as average hourly earnings rose 0.3% m/m (Fig. 11). This suggests that May’s retail sales will show a slight increase at best.
The jobs report also showed that aggregate weekly hours in manufacturing was flat in May, suggesting that industrial production was too (Fig. 12). So the Index of Coincident Economic Indicators (CEI) was probably flat in May given that the strong employment gain was likely offset by the weakish real personal income and real business sales components of the CEI. A positive May CEI reading would force hard-landers to push their recession forecasts further out into the future, as they have been doing since early last year. A flat or negative CEI would probably incite them to claim that a recession has started.
We remain in the soft-landing camp. Debbie and I track all the payroll employment data for the major industries. We are impressed by how many of the cyclical ones rose to new record highs in May. They include construction, financial activities, professional & business services, transportation & warehousing, and wholesale trade (Fig. 13, Fig. 14, Fig. 15, and Fig. 16).
US Economy III: Wage Inflation Still Moderating? During his May 3 press conference, Fed Chair Jerome Powell discussed the relationship between wage inflation and price inflation a few times. He observed that the two move together, but he stated: “I’ve never said … that wages are really the principal driver, because I don’t think that’s really right.” In any event, he proceeded to explain why he would like to see wage inflation fall to 3.0%. He believes that would be consistent with 2.0% price inflation, assuming, as he does, that productivity growth is 1.0%.
Powell also said that he is focusing on four measures of wage inflation. I detailed them in my book Predicting The Markets (2018), in Appendix 4.1. Here are their latest readings:
(1) Average hourly earnings (AHE). AHE for all workers was 4.3% y/y through May, down from a March 2022 peak of 5.9% (Fig. 17).
(2) Atlanta Fed’s Wage Growth Tracker (WGT). The unsmoothed WGT rose 5.1% y/y through April (Fig. 18). That’s down from a June 2022 peak of 7.4%.
(3) Employment Cost Index (ECI). The ECI rose 4.8% y/y through Q1-2023, with wages up 5.1% and benefits up 4.3% (Fig. 19). The wage component peaked at 5.7% last year during Q2.
(4) Hourly compensation (HC). HC is the most comprehensive and volatile of the four measures of wages. It was up 3.0% y/y through Q1 (Fig. 20). It’s down sharply from its 2020 peak of 10.3% during Q2.
So which one should we pick? All the above, according to Powell. They all are still moderating from their peaks. Our personal favorite is hourly compensation, currently at Powell’s ideal 3.0% reading, but it is volatile. He will probably wait to see whether the other wage inflation measures continue to head toward 3.0% before concluding that wage inflation has moderated sufficiently.
Traders’ Corner. We asked Joe Feshbach to update his views on the stock market: “The 10 day put/call ratio is low. The cumulative advance/decline lines along with individual net new highs are nowhere near to confirming the latest rally. Yet the market continues to ignore all these warning signs, which have worked so well over the past 20 months. The speculative fever seems to be back in the Nasdaq, led by exuberance over AI as the next New, New Thing. This suggests to me that the market may be in a euphoric blowoff phase. How high is impossible to tell, but I’d much rather be risk averse at this point and stay on the sidelines.”
Movie. “After Waco” (+ + +) (link) is an excellent docudrama series about how Waco led to the Oklahoma City bombing in 1995. The series, a chilling reminder about the threat of homegrown terrorism, is a sequel to “Waco,” which recounted the tragedy and the events that led up to it.
Tech, AI & Irises
June 01 (Thursday)
Check out the accompanying pdf and chart collection.
Executive Summary: The stock price indexes of the S&P 500 Information Technology sector and its top-performing industry ytd, Semiconductors, have left their peers in the dust. Not only has the transformative potential of AI whetted investors’ appetite for tech; so have semiconductor companies’ rosier earnings outlooks now that they’re out from under their inventory glut. Does this tech rally have legs? We think so over the longer term, since earnings prospects are bound to rise as AI spending and the semiconductor cycle head north. … Also: Irises have caught our eye, specifically their potential for “authenticating humanity.” OpenAI CEO Sam Altman envisions that potential changing the world.
Technology: More Than AI. Two powerful forces are driving the amazing rally in all-things-tech. First there’s the excitement about artificial intelligence (AI) and how it will change the world. The arrival of the next new thing is expected to boost demand for advanced semiconductors and devour space in cloud servers. Less appreciated is the fact that the AI boom comes just as the pandemic-related semiconductor inventory glut has been worked off and investors were beginning to anticipate better times in the second half of this year.
While Nvidia rightfully has captured headlines because its chips are leading the AI race, many other semiconductor names are having a banner year as well. Looking at the 20 best-performing stocks in the S&P 500 ytd through Tuesday’s close, eight are either semiconductor companies or provide services or products to semiconductor companies: Nvidia (174.5%), Advanced Micro Devices (93.4), Lam Research (49.9), Cadence Design Systems (46.1), Monolithic Power Systems (45.6), Synopsys (45.6), Broadcom (43.7), and Micron Technology (43.4).
Even industry laggard Intel came out with news yesterday that sent its shares up almost 5%. Intel CFO David Zinsner said the company was on track to generate $12.0-$12.5 billion of revenue in Q2, at the high end of Intel’s April outlook of $11.5-$12.5 billion, according to a May 31 Reuters article. He also said the company’s foundries could make wafers for customers who make AI products.
The S&P 500 Semiconductors stock price index is up 67.3% ytd and is only 0.4% away from taking out its all-time high (Fig. 1). Semiconductors is the best performing industry within the S&P 500 Information Technology sector.
This double-dose of positivity helped most tech-related industries and sectors vastly outperform the rest of the stock market. Here’s how industries in the S&P 500 Information Technology sector have performed ytd through Tuesday’s close: Semiconductors (67.3%), Systems Software (37.3), Technology Hardware, Storage & Peripherals (35.5), Information Technology sector (34.8), Application Software (29.1), Internet Services & Infrastructure (9.4), Electronic Manufacturing Services (7.2), IT Consulting & Other Services (3.9), Electronic Components (-0.3), Technology Distributors (-2.2), and Electronic Equipment & Instruments (-2.6) (Fig. 2).
And of course, the S&P 500 Information Technology sector is the best performer of the 11 S&P 500 sectors ytd through Tuesday’s close: Information Technology (34.8%), Communication Services (32.3), Consumer Discretionary (19.2), S&P 500 (9.5), Industrials (-0.4), Materials (-2.7), Consumer Staples (-2.9), Real Estate (-3.5), Financials (-6.5), Health Care (-7.0), Utilities (-9.4), and Energy (-11.2) (Fig. 3).
The tough question is just how far can this tech rally run? The good news is that many earnings estimates for this year and next have risen. The bad news is that earnings multiples have risen as well—and some by a greater amount. Here’s a look at the collective earnings prospects of companies in the S&P 500 Information Technology sector and the collective P/Es of their stocks:
(1) Earnings provide some support. Earnings growth in the S&P 500 Information Technology sector is expected to rebound in 2024, rising 15.4%, a marked improvement from the 3.2% decline forecast for this year. As a result, the sector’s earnings growth is expected to fly from among the worst in the S&P 500 this year to among the best next year.
Here are the 2023 and 2024 earnings growth estimates for the S&P 500 and its 11 sectors: Consumer Discretionary (24.1% in 2023 and 18.6% in 2024), Communications Services (16.7, 17.7), Information Technology (-3.2, 15.4), Industrials (14.6, 13.4), S&P 500 (0.3, 11.4), Real Estate (-17.2, 10.0), Consumer Staples (2.1, 9.1), Health Care (-9.2, 9.1), Financials (11.4, 9.0), Utilities (6.4, 8.3), Materials (-16.9, 4.8), and Energy (-24.6, 0.9) (Fig. 4).
Among industries within the S&P 500 Information Technology sector, the Semiconductor industry is expected to enjoy the strongest earnings improvement from 2023 to 2024. The S&P 500 Semiconductor industry’s earnings are forecast to climb 34.3% in 2024, a vast improvement from the 19.0% decline anticipated this year (Fig. 5). Analysts’ consensus estimates for the industry’s 2023 earnings had been declining for roughly a year until February, when they started heading higher, while y/y growth remained in negative territory. Meanwhile, most 2024 earnings estimates have been heading higher since late 2022 and have dipped only slightly from very high levels in recent weeks.
Here is how S&P 500 Technology industries’ earnings are expected to perform in 2023 and 2024: Semiconductors (-19.0%, 34.3%), Application Software (19.4, 16.1), Electronic Components (-4.5, 15.9), Information Technology sector (-3.2, 15.4), Electronic Manufacturing Services (-11.1, 15.2), Systems Software (6.1, 13.5), Internet Services & Infrastructure (8.2, 12.5), Technology Hardware, Storage & Peripherals (-7.7, 10.7), Technology Distributors (-3.0, 9.7), Electronic Equipment & Instruments (1.3, 9.1), IT Consulting & Other Services (3.8, 8.4), Communications Equipment (14.2, 7.2), and Semiconductor Materials & Equipment (2.9, -7.7) (Fig. 6 and Fig. 7).
(2) P/Es growing as well. The improvement in earnings growth prospects hasn’t gone unnoticed. Forward P/Es both for the S&P 500 broadly and for many of its sectors and industries have risen from year-ago levels. The S&P 500’s forward P/E has climbed to 18.0 from 16.9 a year ago, and the Information Technology sector’s forward P/E has jumped by 4.5ppts y/y, the most of any S&P 500 sector, to 24.5. (FYI: “Forward P/Es” are P/Es based on “forward earnings,” or the time-weighted average of analysts’ consensus operating earnings-per-share estimates for this year and next.)
Here are the forward P/Es of the S&P 500 and its sectors as of May 25 and where they stood one year ago: Real Estate (32.3, 40.1), Information Technology (24.5, 20.0), Consumer Discretionary (23.9, 21.8), Consumer Staples (19.6, 20.4), S&P 500 (18.0, 16.9), Industrials (17.3, 16.8), Utilities (17.0, 20.7), Health Care (16.8, 16.0), Communications Services (16.7, 14.9), Materials (16.0, 14.0), Financials (12.6, 12.2), and Energy (10.3, 10.4) (Table 1).
As you’d expect, the Tech sector industries with some of the fastest earnings growth have some of the highest forward P/Es. Industries with forward P/Es that have risen from a year ago include: Systems Software (28.3, up from 24.2 a year ago), Technology Hardware, Storage & Peripherals (26.0 up from 20.2), and Semiconductors (23.8 up from 15.1). But there are Tech sector industries that haven’t seen their forward P/Es increase from year-ago levels, including Application Software (27.1 down from 29.3) and Internet Services & Infrastructure (21.2 almost even with 21.1).
More surprising are the lofty forward P/Es of some defensive, non-tech industries in the S&P 500. For example, the Personal Care Products industry sports the highest forward P/E among S&P 500 industries, of 36.3, followed by Diversified Support Services (32.1), and Water Utilities (29.1).
Last night, earnings from C3.AI and Salesforce showed the risk that the recent investor enthusiasm for tech shares poses. Both companies’ shares have had a banner year, with C3 shares rising an astounding 292.8% and Salesforce shares climbing 65.1% ytd through Tuesday’s close. While both companies reported earnings that largely met Wall Street analysts’ expectations, their shares both sold off in aftermarket trading.
While Technology sector stock prices may be due for a short-term breather after their impressive performance this year, we’d continue to expect the sector’s forward earnings to be revised higher over the longer term as widespread AI spending ramps up and as the semiconductor cycle heads up. We’d expect share prices to follow suit.
Disruptive Technologies: Proof of Humanity. The AI that drives OpenAI’s ChatGPT has spurred deep discussions about what makes a human human. So it isn’t surprising that OpenAI CEO Sam Altman has a side hustle that aims to authenticate humanity.
Altman has co-founded Tools for Humanity, which is building a global identifier of humans called “Worldcoin,” a crypto currency also called “Worldcoin,” and a payment app called “World App.” Worldcoin representatives have been taking pictures of humans’ irises using The Orb, a five-pound shiny, round object. The pictures are translated into a code that reflects the uniqueness of each human’s iris. In exchange for sharing their iris info, the individuals receive a wallet tied to their iris code and the ability to create a World ID since their humanity has been verified.
“It may be easiest to think of [a] World ID as a global digital passport that grants individuals a privacy-preserving way to authenticate as a human online in a world where intelligence is no longer a discriminator between people and AI,” a May 29 Worldcoin blog post explained.
The wallet, World App, can be used to authenticate humanness with the World ID, to hold Worldcoin tokens, and to send digital money anywhere. “Over time, it will evolve into a toolkit to empower individuals in the Age of AI, enabling the usage of proof of personhood, the equitable global distribution of digital currencies, and ultimately a path to AI-funded UBI,” the organization’s website states (“UBI” stands for “universal basic income.”)
Given the rapid development of AI, we can envision a time sometime in the near future when we may want our online consumption to involve verification that it is generated by a human rather than by a nefariously programmed or a hallucinating AI bot posing as a human.
Let’s take a deeper dive into Worldcoin’s efforts to identify every human on Earth:
(1) Irises trump fingerprints. We are far from experts on biometrics, but articles indicate that iris scans are easier to take and more accurate to use than fingerprints when it comes to identifying people. This is particularly true in poor countries, where manual labor may have worn away the fingerprints of citizens. Iris scans don’t require physically touching the subject and need to be repeated less often to get a good picture. Fingerprints may need to be repeated to get a good print if the subject is sweating or young.
“Iris scored far higher than fingerprints in terms of ease of use, speed, and overall preference,” according to a study cited in an August 1, 2016 blog post by the Center for Global Development.
(2) Critics abound. In some ways, Altman has had lofty reasons for developing Worldcoin. According to press reports, he has implied that he was exploring how Worldcoin might be used if UBI and global wealth distribution become a reality. Worldcoin also could give populations that are underserved by financial systems access to them.
Less altruistically, confirming that a Worldcoin user is human could reduce the risk of “Sybil attacks,” which occurs when one entity creates multiple fake accounts that can breach the privacy of a blockchain or can steal funds held on the blockchain. It could also solve the problem that Altman has created with AI: differentiating between human-created “real” online content and AI-created content.
Some watchers are concerned that Worldcoin won’t be able to keep iris data secure. Others speculate that the company may be gathering this data from people who don’t understand the importance of the data they’re sharing. Worldcoin representatives aren’t in the US or China, presumably due to concerns about the legality of cryptocurrencies. But Worldcoin reps have gathered iris pictures from almost 1.8 million people located in at least 24 countries.
The authors of an April 6, 2022 MIT Technology Review article went to Indonesia and watched Worldcoin representatives taking iris scans of villagers in exchange for cash, Worldcoin tokens, and sometimes even AirPods. “We found that the company’s representatives used deceptive marketing practices, collected more personal data than it acknowledged, and failed to obtain meaningful informed consent,” the authors conclude. “Our interview helped us see that, for Worldcoin, these legions of test users were not, for the most part, its intended end users. Rather, their eyes, bodies, and very patterns of life were simply grist for Worldcoin’s neural networks. [Those taking the iris scans] were paid pennies to feed the algorithm, often grappling privately with their own moral qualms. The massive effort to teach Worldcoin’s AI to recognize who or what was human was, ironically, dehumanizing to those involved.”
(3) Black market pops up. A black market for World App identifications has emerged on Chinese social media and e-commerce sites, according to a May 24 CoinDesk article. As noted above, World App is not available in China because of the country’s tight controls limiting cryptocurrencies. Worldcoin confirmed in the article that it is aware of individuals who were “incentivized to sign up for a verified World ID that was then delivered to a third party’s World App rather than their own.” Such fraud would seem to undermine the entire reason for establishing the system.
(4) Investors dive in anyway. Worldcoin launched with a $1 billion valuation and raised $25 million in funding from lead investor Andreessen Horowitz, along with Coinbase, Reid Hoffman, Day One Ventures, Multicoin, FTX’s Sam Bankman-Fried, and Variant’s Jesse Walden, according to an October 21, 2021 TechCrunch article. Worldcoin raised another $100 million in March 2022 at a $3 billion valuation. And most recently, the venture raised $115 million in a Series C round of fundraising. Led by Blockchain Capital, other investors included 16Z, Bain Capital Crypto, and Distributed Global, a May 25 TechCrunch article reported.
Another Hated Bull Market
May 31 (Wednesday)
Check out the accompanying pdf and chart collection.
Executive Summary: The S&P 500 has been in a bull market since October. So how come there are so many bears refusing to believe that? Today, we recount the reasons that they write off the stock market’s legitimately broad-based advance since fall as just a rally within a bear market. We also correct a few of their misperceptions and outline the bulls’ stronger case. … And for a trader’s perspective on this divisive market, a few words from Joe Feshbach.
Weekly Webcast. If you missed Tuesday’s live webcast, you can view a replay here.
Strategy I: The Bears’ Litany. The latest bull market started on October 12 when the previous bear market ended (Fig. 1). It may be on course to be among the most hated bull markets in history. Here’s why:
(1) Valuation stretched. The naysayers hate that the bull market started with historically high P/Es (Fig. 2). In the past, valuations usually offered much more compelling opportunities at the end of bear markets. Not so this time. The S&P 500 forward P/E bottomed at 15.1 on October 12. On Friday, May 26 it was back up to 18.3. The historical average P/E is 15.0. So the P/E didn’t fall below this “fair value” during the bear market and now is well above it again.
(2) Recession coming. Most despicable is that the bull has the audacity to charge ahead when almost everyone agrees that a recession is coming any day now. The bull is a contrarian, bucking the consensus. The consensus crowd hates that and continues to claim that the rally since October 12 isn’t the start of a new bull market at all but just a rally in a bear market.
The S&P 500 is one of the 10 components of the Index of Leading Economic Indicators (LEI). The LEI peaked during December 2021 and is now down to the lowest reading since September 2020 (Fig. 3). It has peaked before each of the previous eight recessions, by an average of 12 months prior to the peak in the business cycle that marked the start of the recession.
The S&P 500 peaked during January 2022. The naysayers correctly observe that it has never bottomed before a recession has even started (Fig. 4). The bull market in stocks begs to differ with the hard-landers. So do we.
(3) Banking in crisis. Bears were taking a victory lap when the banking crisis started in mid-March. So far, it hasn’t morphed into an economy-wide credit crunch; but it soon will, they claim, triggering their long-awaited recession. They correctly observe that the Fed’s Senior Loan Officer Opinion Survey showed that credit lending standards started to tighten significantly during Q4-2022 and continued to do so during Q1-2023, especially for commercial real estate loans (Fig. 5 and Fig. 6).
The stock market generally doesn’t perform well when the S&P 500 Financials sector is weak. While the S&P 500 is up 17.6% since October 12, the S&P 500 Financials sector has underperformed with a gain of 5.9% (Table 1). Since March 8, the S&P 500 is up 5.3%, while the Financials sector is down 8.1% (Table 2).
By the way, the LEI includes a Leading Credit Index (Fig. 7). During economic expansions, it tends to be under zero, fluctuating around -1.0. It has been ranging between 0.0 and 1.0 since early 2022. It is highly correlated with the yield spread between the high-yield corporate bond index and the 10-year Treasury yield, which has remained surprisingly narrow (Fig. 8).
(4) Fed not done. Now that the banking crisis seems to have stabilized, the bears are saying that the Fed isn’t done raising interest rates because inflation isn’t coming down fast enough. The markets have been discounting another prospective 25bps rate hike at the June or July meeting of the FOMC to a range of 5.25%-5.50%. The 2-year Treasury note yield bottomed at 3.81% on May 4. It was back up to 4.46% yesterday. Here are federal funds rate futures yields as of Friday: nearby (5.16%), 3-month (5.25%), 6-month (5.28%), and 12-month 4.67%) (Fig. 9).
(5) Bad breadth. Especially disconcerting to the haters is that the S&P 500 has continued to rally since March 8, when the banking crisis started. They observe that the ratio of the equal-weighted to market-cap-weighted S&P 500 has plunged since then (Fig. 10). Such bad breadth, they point out, is not the hallmark of young bull markets. That’s true. However, we see no reason why breadth might not improve over the rest of the year, led by a rebound in Financials if the banking crisis continues to abate, as we expect.
(6) MegaCap-8 again. The breadth problem is attributable to the remarkable outperformance in recent months of the MegaCap-8 stocks (i.e., Alphabet, Amazon, Apple, Meta, Microsoft, Netflix, Nvidia, and Tesla). The banking crisis caused investors to favor them again since they have very strong balance sheets, generate lots of cash flow, and they don’t have to borrow money from the banks or in the capital markets. They’ve also been buoyed (inflated) by all the excitement about artificial intelligence (AI), since they are the most obvious ways to play this new investment theme.
The collective market capitalization of the MegaCap-8 stocks bottomed this year at $6.8 trillion and rose 54.3% to $10.5 trillion by Friday, only 15.0% below their 2021 record high of $12.3 trillion (Fig. 11). A.k.a. the “Magnificent-8,” these stocks now account for 26.4% of the S&P 500’s market cap, matching the previous record high during 2021 (Fig. 12). They now account for 47.5% of the market cap of the S&P 500 Growth index.
The bears say that the MegaCap-8 stocks are in an AI bubble that will burst. The collective forward P/E of these stocks has soared from a low of 21.1 at the start of this year to 29.4 on Friday (Fig. 13). Without them, the forward P/E of the S&P 500 is 16.0.
The bears often have observed that without the MegaCap-8, the S&P 500 would be down. Here are the percent changes in the S&P 500 with and without the MegaCap-8 since October 12 (17.6%, 11.4%), ytd (9.5%, -1.4%), and since March 8 (5.3%, -1.6%) (Fig. 14).
The implication often seems to be that only the MegaCap-8 stocks are up since the start of the bull market. We ran a performance derby on the S&P 500 and its 11 sectors and 100+ industries since October 12 (Table 1 again). There are plenty of industries with double-digit gains that don’t include any of the MegaCap-8, for example: Homebuilding (47.7%), Casinos & Gaming (42.6), Health Care Supplies (39.6), Construction & Engineering (37.7), Industrial Conglomerates (29.0), and Industrial Gases (27.9).
Strategy II: The Bulls’ List. All of the bears’ points recounted above are legitimate concerns. But in the stock market, there are always two sides to every story. We’ve already countered some of the bearish narratives above with our own bullish spin. Let’s consider a few more debating points from the bulls’ perspective:
(1) Rolling recession & disinflation. In yesterday’s Morning Briefing, Debbie and I discussed the economy’s various shock absorbers that have absorbed the shock and after-shocks of the pandemic. We observed that there is lots of “helicopter money” left over from the pandemic relief checks sent to consumers and businesses during the pandemic. In addition, the government is spending lots of money on incentivizing onshoring, especially building semiconductor plants, as well on infrastructure.
Many of the most cyclical and interest-rate sensitive industries are still expanding their payrolls, some to new record highs. Many of these industries are benefitting from the resilience of consumer spending, which is partly attributable to retiring Baby Boomers, who have plenty of wealth and retirement income to spend on travel, eating out, and healthcare.
(2) The Fed is (almost) done. Fed officials, including Fed Chair Jerome Powell, have said that their goal is to raise the federal funds rate up to a “restrictive” level and to keep it there until inflation falls closer to their 2.0% target. In both their December and March Summary of Economic Projections (SEP), they projected that a 5.1% federal funds rate would be the terminal rate.
They could change their minds. The latest batch of economic and inflation indicators was stronger and hotter than widely expected. Nevertheless, the banking crisis and tightening lending standards certainly confirm that the federal funds rate is restrictive enough. Furthermore, we expect that May’s employment and CPI reports (before the next FOMC meeting) will show slower economic growth and cooling inflation.
(3) Good breadth. Finally, have a look at the breadth of earnings forecasts. The percent of S&P 500 companies with positive three-month percent changes in forward earnings rose to 73.9% during the May 26 week (Fig. 15).
(4) AI bubble. Related to the bear’s MegaCap-8 spin is that those eight stocks have been inflated by hype about AI. We don’t agree. Their initial ascent from their collective bottom on January 5 (based on their aggregate market cap) was attributable to their success in rapidly cutting their bloated costs during H2-2022.
Leading the way in cost-cutting was Meta with 11,000 jobs cut in fall 2022. In March 2023, the company unveiled plans to lay off another 10,000 workers in a further bid to cut costs. Meta’s stock price bottomed on November 3. Microsoft, Amazon, and Google also pared their payrolls. AI is just icing on the cake, in our opinion.
Strategy III: Trader’s Corner. Last, but not least: On Monday, we asked Joe Feshbach for an update of his call on the market from a trader’s perspective: “The debt ceiling has finally been raised, and AI stocks are taking over the world (maybe literally). The good news is all out. The put/call ratio has been low for five out of the past six days, and breadth continues to be narrow. The market should be close to a sharp setback to the middle of its wide trading range.”
Shock Absorbers
May 30 (Tuesday)
Check out the accompanying pdf and chart collection.
Executive Summary: Why is economic growth seemingly defying gravity, or at least the gravitational pull of the Fed’s tightening measures over the past year and change? It’s not that the rules of business-cycle physics are defunct. Rather, the pandemic has added new forces to the equation, with distortive effects. Eight unusual forces are acting as shock absorbers to keep the economy from sinking into the widely expected recession. Today, we examine each, including the amount of liquidity in the economy, the uncommonly strong labor market, productivity-enhancing technological advancements ushering in the “Roaring 2020s,” and well-heeled Baby Boomers consuming like there’s no tomorrow.
YRI Weekly Webcast. Join Dr. Ed’s live Q&A webinar today at 11 a.m. EST. You will receive an email with the link to the webinar one hour before showtime. Replays of the weekly webinars are available here.
US Economy: Reprising Its Surprising Resilience. Many economists have been spending a lot of time predicting an imminent recession since early last year. Debbie, Jackie, Melissa, and I have been spending our time explaining why they’ve been so wrong so far.
Today, let’s review a list of the reasons for the economy’s surprising resilience. We aren’t arguing that the business cycle is dead. Rather, we think that the pandemic has significantly distorted the boom-bust cycle in the economy. So macroeconomic models that don’t take the distortions into account have been missing an important new and unique development.
After all, global pandemics don’t occur very often. The last one was the global Spanish flu beginning in 1918 and ending in 1920. It was followed by a remarkable decade of prosperity in the US, i.e., the Roaring 1920s. The latest pandemic was a shock to the global economy. It has mostly ended, but the shockwaves continue. The impact of the initial shock and the subsequent shockwaves on the economy seem to have been offset by significant shock absorbers, as follow:
(1) Monetary & fiscal stimulus & liquidity. The hard-landers’ main reason for expecting a recession invariably has been the tightening of monetary policy since early last year.
The federal funds rate had been trading mostly around zero from late 2008 through March 2022 (Fig. 1). Once Fed officials realized that they had fallen well behind the inflation curve in 2022, they scrambled to raise the federal funds rate, bringing it up by 500 basis points from March 16, 2022 through May 3, 2023. In addition, the Fed reduced the size of its balance sheet and continues to do so. The Fed’s holdings of securities peaked at a record $8.5 trillion on May 18, 2022 (Fig. 2). It was down to $7.8 trillion by May 24, 2023, and is scheduled to fall by $95 billion per month for the foreseeable future.
These two tightening measures together represent the most significant round of monetary tightening since the one engineered by former Fed Chair Paul Volcker during the late 1970s and early 1980s. That (predictably and intentionally) caused a recession. So why hasn’t this one?
The economy is still awash in the liquidity that was provided by monetary and fiscal policies during the pandemic. On a 12-month basis, the federal deficit swelled from $1.1 trillion through January 2020 (just before the pandemic) to a record $4.1 trillion through March 2021 (Fig. 3). Federal outlays (also on a 12-month basis) jumped from $4.6 trillion through January 2020 to a record $7.6 trillion through March 2021 (Fig. 4). Most of that increase was attributable to direct cash payments to households and businesses to provide pandemic relief.
All this deficit-financed fiscal spending was accommodated by the Fed. The federal funds rate was lowered from 1.50%-1.75% at the start of 2020 to 0.00%-0.25% on March 15 of that year. In addition, the Fed increased its holdings of securities by $4.5 trillion from mid-March through the summer of 2022.
The impact of all this “helicopter money” was to boost M2 by $6.3 trillion from January 2020 through July 2022, when it peaked at a record high (Fig. 5). Over this same period, demand deposits in M2 rose by a whopping $3.4 trillion. Demand deposits accounted for 24.1% of M2 during April of this year, up from 10.3% just before the pandemic and the highest reading since spring 1972 (Fig. 6).
Our conclusion is that liquidity as measured by M2 hasn’t been this liquid for quite some time. All this liquidity has been a significant shock absorber, offsetting much of the Fed’s tightening shock.
(2) Strong labor market. The epicenter of the economy’s resilience has been the labor market. The Fed’s monetary tightening cycle since early last year has been aimed at boosting the unemployment rate to slow wage inflation (by creating some slack in the labor market) and to cool price inflation (by weakening the demand for goods and services). Instead, the unemployment rate has declined from 4.0% during January 2022 to 3.4% during April 2023 (Fig. 7). At 3.2%, the adult jobless rate matches its lowest rate since January 1970, while the teenage unemployment rate, at 9.2%, is the lowest since November 1953. Payroll employment has increased by 4.2 million from March 2022 (when the Fed started to tighten) through April 2023, or 327,000 per month on average (Fig. 8).
The most cyclical and interest-rate sensitive segments of the labor market are showing remarkable resilience. In April, payroll employment in durable goods manufacturing rose to the highest since November 2008 (Fig. 9). Construction employment remained at a record high during April (Fig. 10). The same can be said about transportation & warehousing employment (Fig. 11). Wholesale and retail trade employment were quite cyclical in the past, but the former is at a record high, while the latter has recovered to its pre-pandemic level (Fig. 12). Payroll employment in professional & business services, also cyclical in the past, rose to a record high in April (Fig. 13).
(3) Baby Boomers spending & wealth. Melissa and I have observed that as more and more of the aging Baby Boomers retire, they are spending more on travel (including airfare and accommodations), eating out, and health care. Employment is expanding in all these areas of the labor market. The retired Baby Boomers may no longer be getting paychecks, but they are receiving Social Security and pension benefits. They also are required by law to draw down their 401(k) plans. Many of them have accumulated lots of wealth that throws off lots of dividend and interest income.
At the end of last year, the Baby Boomers had a net worth of 73.1 trillion (Fig. 14). That amounted to 52.3% of the total net worth of all households. During April, consumers had record or near-record amounts of proprietor’s income ($1.9 trillion), interest income ($1.8 trillion), dividend income ($1.7 trillion), and rental income ($0.9 trillion) (Fig. 15).
(4) Onshoring & infrastructure spending. Jackie and I have been monitoring the onshoring trend for a while. In the May 4 Morning Briefing, we wrote: “Manufacturers, large and small, domestic and foreign, are tapping into the trillions of dollars of incentives available in the CHIPS and Science Act, the Inflation Reduction Act (IRA), and the Infrastructure Investment and Jobs Act to build factories in the US. They plan to make semiconductors, batteries, solar equipment, electric vehicles (EVs), and green hydrogen, among other things. So many manufacturers have locked down locations for new plants that it’s now hard to find shovel-ready ‘megasites,’ an April 13 Reuters article reported. If the US manages to skirt a recession, it will be due in good part to the massive capital spending and building related to these plants.”
As we’ve noted before, capital spending in real GDP rose to a record high of $3 trillion (saar) during Q1-2023, and manufacturing construction put in place jumped 62.3% y/y through March to its latest record high of $147.4 billion (Fig. 16). Many of the proposed factories have yet to break ground and are not reflected in these numbers. If the projects go forward, building and then operating these facilities should provide an economic tailwind.
Also receiving a big boost from federal spending is infrastructure construction. We can see that in the record (or near-record) highs in construction put-in-place of highways and streets, sewage & waste disposal, water supply, and health care facilities (Fig. 17).
(5) Real wage gains, productivity & technology. Real wages stagnated during 2022 when higher wage inflation was offset by higher price inflation. Average hourly earnings for production & nonsupervisory workers rose 5.4% y/y through December 2022, while the PCED rose 5.3% over the same period (Fig. 18). Real wages have been rising along their long-term trendline of 1.2% since the start of this year. This upward trend can only be sustainable if productivity growth is making a comeback. Productivity was slammed by the impact of the pandemic on the labor market causing record highs in quits and job openings.
Debbie and I believe that the pandemic was a temporary setback to the productivity growth boom that started in late 2015 (Fig. 19). We also think that the pandemic might have accelerated the pace at which technological innovations (including state-of-the-art onshoring) are used to boost productivity growth and to offset labor shortages.
(6) The Roaring 2020s. During 2020, Jackie and I often wrote that the pandemic might be followed by the Roaring 2020s. Needless to say, the naysayers thought that was delusional and probably still think so. After all, the world economy was hard hit by the pandemic. Although it recovered quickly and strongly as lockdowns and social distancing restrictions were lifted, inflation soared, forcing central banks to slam on the monetary brakes during 2021 and 2022.
We countered that the Roaring 1920s were preceded by a global pandemic and a US depression in 1920. But the decade’s technological innovations boosted productivity and standards of living significantly. Today, productivity growth has been derailed by the remarkable turnover in the labor market that has been largely attributable to the pandemic. But we think it soon will be back on track.
We are sticking with what we wrote in the November 24, 2020 Morning Briefing:
“Today’s ‘Great Disruption,’ as Jackie and I like to call it, is increasingly about technology doing what the brain can do, but faster and with greater focus. Given that so many of the new technologies supplement or replace the brain, they lend themselves to many more applications than did the technologies of the past, which were mostly about replacing brawn. Today’s innovations produced by the IT industry are revolutionizing lots of other ones, including manufacturing, energy, transportation, healthcare, and education. My friends at BCA Research dubbed it the ‘BRAIN Revolution,’ led by innovations in biotechnology, robotics, artificial intelligence, and nanotechnology. That’s clever, and it makes sense.
“The current pandemic seems to be speeding up the pace at which these and other technologies are proliferating. Debbie and I believe that productivity growth has been heading toward a secular rebound during the post-pandemic Roaring 2020s. Even before the Great Virus Crisis (GVC), companies had been moving to incorporate into their businesses a host of state-of-the-art technologies in the areas of computing, telecommunications, robotics, artificial intelligence, 3-D manufacturing, the Internet of Things, among others. The GVC is accelerating that trend as companies rethink how to do business ever more efficiently in the post-pandemic era.”
Two years and a week later, on November 30, 2022, ChatGPT was launched, triggering just the kind of excitement about the potential impact of AI that we had envisioned. Myriad companies now have plans to leverage ChatGPT and other AI software to boost productivity and ameliorate their labor shortage problems.
(7) Excess saving. Above, we observe that M2 was boosted by the helicopter money resulting from the pandemic. The surge in M2 was reflected in a similar surge in excess saving (Fig. 20). M2 currently exceeds its pre-pandemic trendline by roughly $0.5 trillion. Hard-landers continue to predict that once this windfall is spent, consumers will be forced to retrench, resulting in a recession. We doubt that because we expect that employment and real wages will continue to fuel the growth in real disposable income and consumer spending (Fig. 21).
(8) Banks pass a stress test. Finally, we would like to give credit to the yield curve. It has been inverted since last summer, reflecting bond investors’ anticipation that something in the financial system will break as the Fed continues to tighten, triggering an economy-wide credit crunch that causes a recession. Sure enough, in early March, a banking crisis unfolded because of deposit runs at three banks.
However, there’s no sign of a credit crunch and recession so far. We continue to expect that the banking system will pass this unofficial real-world stress test. We will continue to monitor the Fed’s weekly H.8 release titled “Assets and Liabilities of Commercial Banks in the U.S.” We are capturing the relevant data in our Commercial Bank Book and Commercial Bank Loans.
The latest updates show that total bank deposits are continuing to fall, but they remain above their pre-pandemic uptrend through the May 17 week (Fig. 22). The deposit outflows have been offset by decreases in securities held by the banks, presumably as they mature and are not rolled over. Borrowings seem to have peaked over the past few weeks. Bank loans are looking toppy.
Through the May 17 week, consumer and residential real estate loans rose to record highs (Fig. 23). Commercial and industrial loans are looking toppy, but that could be attributable to less unintended inventory accumulation in the goods sector of the economy. Also looking toppy are commercial real estate loans, suggesting that the rolling recession is starting to roll through the commercial real estate industry.
Covid Again? Upbeat NERI.
May 25 (Thursday)
Check out the accompanying pdf and chart collection.
Executive Summary: China bracing for another Covid wave but will rely on vaccines rather than lockdowns. … Latest earnings was better than expected, but S&P 500 earnings was still down 3.0% y/y, which is better than the -7.0% consensus expectation. Q2 should be down again modestly before comps turn positive again. … Joe reviews the latest NERI readings, which seem to be turning more optimistic.
Covid: Another Wave in China. Yesterday, we observed that China’s economy isn’t performing as well as the government would like to see. China’s imports have been flat since the second half of 2021. PPI prices are falling as is the price of copper, which is a very sensitive indicator of China’s economic activity. So, the Peoples Bank of China lowered its bank reserve requirement three times since 2022. Bank loans soared by a record $3.4 trillion over the past 12 months.
What’s the matter with China? Here are a few simple explanations: China’s rapidly aging demographic profile is inherently deflationary. The country's property bubble has burst. The government's aggressive moves to regulate and supervise business activity is killing the country's entrepreneurial spirit. The Chinese regime’s instigation of a Cold War with the West (as well as with its Asian neighbors) and massive military spending may be weighing on its economy.
And now, China is bracing for another wave of Covid. On May 22, Bloomberg reported: “China is likely to see its Covid-19 wave peaking at about 65 million infections a week toward the end of June, according to a senior health adviser, while authorities rush to bolster their vaccine arsenal to target the latest omicron variants.” Apparently, immunity among the country’s 1.4 billion residents is already waning just six months after Beijing ended its lockdowns in early December. The government is preparing to roll out XBB vaccines, but China’s Covid vaccines have tended to be less effective than mRNA versions available overseas. The government has favored homegrown vaccines.
Strategy I: Waiting for S&P Data on Q1 Earnings. The Q1 earnings season is over. Joe and I are waiting for Standard & Poor’s to compile the final tally. Joe has been tracking the Q1 earnings reports of the S&P 500. He observes that with 471 results through Monday’s close, revenues are ahead of the consensus forecast by 2.3%, and earnings have exceeded estimates by 7.1%.
Of the 471 Q1 reporters, 74% have reported a positive revenues surprise, while 77% have reported an earnings beat. Those are big improvements from their Q4-2022 readings of 68% for both revenues and earnings.
The collective revenue gain for the 471 reporters is 4.2% y/y, and earnings are down 3.0% y/y following a 1.9% y/y decline in Q4-2022. Another modest decline is likely in Q2 before the comparisons turn positive during H2.
Strategy II: Analysts Asking, ‘So Where’s This Recession?’ Yesterday, Refinitiv released its May snapshot of industry analysts’ consensus estimate revision activity over the past month. While the firm provides the raw data for all its polled measures, we focus primarily on the revenues and earnings forecasts. We use these data to get a handle on whether analysts generally have been growing more pessimistic, optimistic, or neither about the prospects for the companies they follow.
In our Stock Market Indicators: Net Revenue & Earnings Revisions By Sectors report, we index the analysts’ revisions activity by taking the number of forward earnings estimates that were revised up less the number revised down, expressed as a percentage of the total number of forward earnings estimate revisions. We look at this activity over the past three months so that it better represents what’s happened over an entire quarterly reporting cycle. This makes the series less volatile (and less misleading) than a weekly or monthly series, and the trends become more apparent.
May’s reading comes at the tail end of the quarterly earnings reporting cycle, when analysts typically adjust their forecasts the most. It shows a clear break in the long period of mostly downward revisions. Perhaps analysts as a group are beginning to realize that there will not be a deep recession or a recession at all. Perhaps like us, they now expect just a mid-cycle slowdown, with negative y/y quarterly growth comparisons due simply to the strong year-earlier results, reflecting robust pricing power.
Below, we highlight some notable takeaways from these data series:
(1) S&P 500 NERI back to neutral. The S&P 500’s Net Earnings Revisions Index (NERI), which measures the revisions activity for earnings forecasts, improved considerably m/m in May (Fig. 1). It rose to 0.0% (indicating equal numbers of raised and lowered estimates over the past three months) from -6.7% in April. May’s release was: 1) the first non-negative reading since last June, 2) up from a 30-month low of -15.6% in December, 3) the biggest jump in 24 months, and 4) above the average reading of -2.2% seen since March 1985 when we first calculated the series.
(2) S&P 500 NRRI shows revenues revisions still positive and rising. The S&P 500’s Net Earnings Revenues Revisions Index (NRRI), which measures the revisions activity in analysts’ revenue forecasts, was positive for a fifth straight month, rising to a 12-month high of 5.0% from 1.4% in April (Fig. 2). That’s above the average reading of -0.3% since the first calculation of that data in March 2004.
(3) Nearly half of the S&P 500’s sectors now have positive NERI. Five sectors had positive NERI in May, up from zero during March and April (Fig. 3). All 11 sectors improved m/m. That was the broadest improvement among the sectors since July through September 2020, when analysts were scrambling to raise forecasts as the US economy reopened.
Seven of the 11 sectors hit their highest NERI readings in at least 10 months. Among them, Health Care and Consumer Discretionary turned positive for the first time in 14 months. Communication Services improved but remained negative for a 19th month. Energy and Financials both remain challenged.
Here’s how NERI ranked for the 11 sectors in May: Industrials (9.3%, a 19-month high), Consumer Staples (4.5, 19-month high), Consumer Discretionary (4.3, 15-month high), Health Care (3.1, 16-month high), Information Technology (0.7, 11-month high), S&P 500 (0.0, 11-month high), Communication Services (-1.9, 17-month high), Materials (-2.8, 10-month high), Utilities (-3.7, 7-month high), Real Estate (-4.3, 8-month high), Financials (-10.1, 7-month high), and Energy (-17.2, 2-month high).
(4) NRRI positive for six sectors now. NRRI’s m/m performance was a tad weaker than NERI’s by one measure: Nine sectors had NRRI readings improve m/m, versus all 11 with improving NERI (Fig. 4).
However, six sectors still hit their highest NRRI readings in at least 11 months. NRRI weakened for only two sectors m/m, Consumer Staples and Materials.
Here’s how their NRRI ranked in May: Utilities (22.4%, a record high!), Consumer Staples (13.5, 5-month low), Consumer Discretionary (13.1, 19-month high), Health Care (12.7, 19-month high), Industrials (11.4, 19-month high), Real Estate (7.5, 7-month high), S&P 500 (5.0, 12-month high), Information Technology (-1.3, 11-month high), Financials (-2.0, 2-month high), Materials (-5.1, 2-month low), Communication Services (-10.9, 13-month high), and Energy (-21.3, 3-month high).
Around The World
May 24 (Wednesday)
Check out the accompanying pdf and chart collection.
Executive Summary: Global economic growth has been lackluster this spring, neither a boom nor a bust. Rebounding global trade and the easing of supply-chain disruptions should moderate global inflationary pressures without a global recession. The Fed and the ECB are committed to raising rates to restrictive levels and keeping them there to bring inflation down. The Fed’s rate is probably where it should be, while the ECB may have a couple more rate hikes to go. The BOJ’s ultra-easy policy continues. The PBOC is massively stimulating, suggesting all is not well in China. Today, we survey the major indicators of global economic growth for insight into how vulnerable the global economy is at this juncture.
Global Economy: No Boom, No Bust. In 1897, an English journalist from the New York Journal contacted satirist Mark Twain to inquire whether the rumors that he was gravely ill or already dead were indeed true. Twain wrote a response, part of which made it into the article that ran in the Journal on June 2, 1897:
“Mark Twain was undecided whether to be more amused or annoyed when a Journal representative informed him today of the report in New York that he was dying in poverty in London ... The great humorist, while not perhaps very robust, is in the best of health. He said: ‘I can understand perfectly how the report of my illness got about, I have even heard on good authority that I was dead. James Ross Clemens, a cousin of mine, was seriously ill two or three weeks ago in London, but is well now. The report of my illness grew out of his illness. The report of my death was an exaggeration.’” (Twain didn’t actually quip, “Reports of my death are greatly exaggerated,” as often attributed to him.)
The US economy continues to grow despite widespread expectations that its growth would be halted by the Fed’s aggressive monetary tightening since March 2022, expectations that fed into forecasts of an imminent recession. Other recent, widely held expectations of economic downturns have proved likewise to be greatly exaggerated: Europe’s natural gas shortages, a result of Russia’s war on Ukraine, were expected to leave Europeans freezing in the dark last winter as the regional economy shut down. Didn’t happen. China’s extreme pandemic lockdowns late last year were expected to drive the nails into the coffin of global economic growth. Didn’t happen.
Last summer, doomsters were warning “winter is coming!” Now they’re acknowledging (like the Chauncey Gardener character in the movie “Being There”) that there is “growth in the spring.”
But it’s been lackluster growth so far, with neither a boom nor a bust. Global supply-chain disruptions have eased. Global trade has rebounded. These developments are likely to moderate global inflationary pressures. Nevertheless, central banks still could choke off global economic growth if they believe that their monetary policies aren’t restrictive enough yet to bring inflation down to their holy-grail target of 2.0%. They’ve expressed a desire to do so ideally without causing a recession, but they’ve also stated that bringing inflation down is their top priority.
Let’s take a quick tour around the world to assess the outlook for the global economy:
(1) Commodity prices. The timeliest indicators of global economic activity, of course, are commodity prices. Debbie and I are big fans of the CRB raw industrials spot price index (Fig. 1). We like it because it does not include food, energy, or wood products, which have their own unique supply and demand characteristics independent of the global economy. The index is available weekly from 1951 to 1981, then daily. It includes copper scrap, lead scrap, steel scrap, tin, zinc, burlap, cotton, print cloth, wool tops, hides, rosin, rubber, and tallow. Most of these commodities are not traded in futures markets, thus removing speculative noise from their price movements.
The index staged a V-shaped recovery following the end of the US pandemic lockdowns. It jumped 69% from April 21, 2020 to a record high on April 4, 2022. It has been falling since then and was down by 20% as of May 22. One of the components of the index is the cash price of copper (Fig. 2). It is especially sensitive to developments in China. Last year, it bottomed at $3.21 per pound on July 14 before the Chinese government lifted its pandemic lockdown restrictions during December. It peaked at $4.27 on January 26 of this year, suggesting that China’s recovery might be weaker than widely expected.
The price of zinc followed the same pattern as the price of copper last year and early this year (Fig. 3). However, it has been much weaker in recent days. The price of steel also rebounded following the end of China’s lockdowns and has held its gains so far this year. It must be getting an additional boost from onshoring and infrastructure spending in the US.
We obviously also follow the price of a barrel of crude oil. It’s not only a sensitive indicator of global economic activity but also can significantly alter global economic activity when geopolitical events dominate its price swings. Spikes in oil prices have often been followed by recessions in the US (Fig. 4).
Last year, the nearby futures price of a barrel of Brent soared from $78.98 per barrel at the start of the year to peak at $127.98 on March 8, 2022 (Fig. 5). That spike was clearly attributable to the impact of the Russian invasion of Ukraine on the global oil market. So far this year, the Brent price has been relatively weak notwithstanding the surprise announcement on April 2 by OPEC+ to cut production. In addition, the futures prices are in backwardation, with the nearby price at $75.99 and the 2-year price at $70.25 on Monday.
(2) Inflation. April’s headline CPI inflation rates are down from their recent peaks in the US (4.9%), the Eurozone (7.0%), and Japan (3.5%) (Fig. 6). They all remain well above the official 2.0% targets of their central banks. The core CPI inflation rates also remain persistently high in the US (5.5%), Eurozone (5.6%), and Japan (2.5%) (Fig. 7).
(3) Monetary policies. The major central bankers found themselves falling behind the inflation curve early last year and scrambled to make up for their tardiness by raising their official policy rates aggressively and by reducing the size of their balance sheets. The Fed has raised the federal funds rate by 500bps starting last March (Fig. 8). The European Central Bank (ECB) has raised its official deposit rate by just over 325bps since last July. On the other hand, the Bank of Japan (BOJ) has kept its official rate unchanged at -0.10% since late September 2016. The total assets of the Fed, ECB, and BOJ (in dollars) peaked at $25.0 trillion during the last three weeks of February 2022. They were down to $22.2 trillion last week.
On Friday, Fed Chair Jerome Powell said that monetary policy is “restrictive.” So Fed policy will be data-dependent and particularly dependent on inflation indicators. For those of us in the “Fed-should-pause” camp, he seemed to suggest that a pause in tightening is possible. He acknowledged that the banking crisis is bound to tighten credit conditions, reducing the need for the Fed to get more restrictive in its policy stance. Nevertheless, he and other Fed officials have said that they intend to keep monetary policy restrictive until they achieve their inflation target.
Also on Friday in an interview with Spanish state-run channel TVE, ECB President Christine Lagarde said, “Now is a moment which is also quite critical because inflation is beginning to go down.” Like Fed officials, she said ECB’s monetary policy will remain restrictive for a while: “We are beginning to see efficiency of measures, but we still need to have high and sustainably high interest rates.”
The BOJ is on another planet. Expectations for the BOJ to tweak its ultra-loose policy have been receding, as Governor Kazuo Ueda repeatedly has said that the central bank will continue monetary easing until inflation sustainably hits its 2% target. He said so on Friday after the release of data showing Japan’s core consumer inflation rose 3.4% in April, still well above the BOJ’s 2.0% target, on rising food and services prices.
(4) Purchasing managers. S&P Global released its May flash PMIs on Tuesday (Fig. 9). For both the US and Eurozone, they show a rebound in their nonmanufacturing indexes from readings slightly under 50.0 at the end of last year to 55.1 and 55.9. The M-PMIs weakened for both, to 48.5 in the US and 44.6 in the Eurozone. Japan’s flash M-PMI rose during May to 50.8.
In the US, we now have three of the May business surveys conducted by five of the Federal Reserve’s district banks in hand. The ones for New York and Richmond showed deterioration, while the Philly survey showed some improvement (Fig. 10). On balance, they were weak.
(5) Forward revenues & earnings. Yesterday, we reviewed the latest data on S&P 500 forward revenues and earnings. Now let’s analyze these metrics for various MSCI indexes around the world to get some insights on the global economy. The forward revenues of the US MSCI continued to hit record highs through the May 18 week (Fig. 11). The same metric for the All Country World ex-US MSCI (ACWXUS, in local currency) has stalled in record-high territory in recent weeks. The forward revenues of the EMU MSCI rose to a record high during the May 18 week, with Japan’s moving closer to its 2008 record high (Fig. 12). Inflation has been boosting revenues growth around the world. But so has real economic activity.
Forward earnings of the ACWXUS (in local currency) has closely tracked the one for the US (Fig. 13). Forward earnings for the EMU, on the other hand, is rising in record territory notwithstanding widespread pessimism about Europe’s economic outlook over the past year.
(6) China. The People’s Bank of China (PBOC) stands out among the major central banks. It is the only one that has been continuing to provide additional monetary policy stimulus. This suggests that China’s economy isn’t performing as well as the government would like to see. The PBOC’s required reserve ratio for commercial banks has been lowered three times since the start of 2022 (Fig. 14). Over the past 12 months through April, bank loans have increased by a record $3.4 trillion (Fig. 15)!
Another red flag is China’s inflation rate. The CPI was up just 0.1% y/y in April despite the flood of bank loans (Fig. 16). The PPI for total industrial products was -3.6% over the same period. The country’s imports (in yuan) have been flat since the second half of 2021 through April (Fig. 17).
Here is one simple explanation: China’s rapidly aging demographic profile is inherently deflationary. The government’s instigation of a Cold War with the West (as well as with its Asian neighbors) and massive military spending may be weighing on its economy.
Looking Forward To Better Earnings
May 23 (Tuesday)
Check out the accompanying pdf and chart collection.
Executive Summary: Our analysis of forward earnings—a good indicator for actual earnings over the next four quarters—suggests an April bottom. That jibes with our mid-cycle-slowdown thesis. … Many who expect a recession instead have been misled by the LEI’s recession signaling. The LEI overrepresents the weak goods side of the economy and underrepresents the strong services side that’s been keeping the economy afloat. … We think the forward profit margin, like forward earnings, has bottomed; margins have been improving for all but three S&P 500 sectors. … And: Still no credit crunch from the banking crisis. … Also: An update on bond market indicators.
Weekly Webcast. If you missed Monday’s live webcast, you can view a replay here.
Strategy I: Discounting the Future. The stock market discounts earnings over the next 52 weeks. How do we know this? Most industry analysts provide earnings estimates for the current year and the coming year. They might provide earnings estimates or earnings growth forecasts beyond that period, but investors aren’t likely to have as much confidence in earnings forecasts beyond the next 52 weeks.
Of course, industry analysts don’t forecast earnings on a 52-week-ahead basis. They forecast quarterly and total-year earnings for the current year and the coming year. However, forward earnings, which is the 52-week time-weighted average of the analysts’ consensus estimates for the current and coming year (updated weekly), is actually a very good leading indicator of actual earnings over the coming four quarters (Fig. 1 and Fig. 2).
Joe and I have the data for forward earnings monthly from September 1978 and the weekly data from March 1994. The monthly series divided by the CPI is a good leading indicator of the business cycle during economic expansions. Real forward earnings is a good coincident indicator of the business cycle during recessions (Fig. 3). It is highly correlated with both the Index of Leading Economic Indicators (especially during good times) and the Index of Coincident Economic Indicators (especially during bad times) (Fig. 4 and Fig. 5).
Industry analysts tend to be optimistic about their companies during economic expansions. Collectively, they don’t see recessions coming. When their companies confirm that a recession is underway, the analysts scramble to cut their earnings estimates.
Real forward earnings peaked at a record high during May 2022, falling 8.0% through April, which was the first month the series rose since the peak. It is still 17.5% above its pre-pandemic record high. Might April have been the bottom for real forward earnings? Joe and I think so because the weekly series for nominal forward earnings bottomed during the February 9 week and is up 1.8% since then through the May 18 week (Fig. 6). The weekly series for forward earnings (currently at $229.94 per share) is converging toward the analysts’ consensus earnings estimate for 2024 (currently $245.73), as always happens as a year progresses. Analysts’ consensus estimate for 2024 has been falling, but it remains well above their consensus for 2023 ($220.07). (We expect to be updating our earnings forecast in the next few days after the Q1-2023 results are compiled by Standard & Poor’s for the S&P 500.)
Real S&P 500 forward earnings was down 7.5% y/y through April (Fig. 7). We acknowledge that this sort of reading is consistent with early recession readings in the past. Nevertheless, if nominal and real forward earnings are bottoming now, that would be more consistent with our forecast of a mid-cycle slowdown, like the ones that occurred during the mid-1980s, mid-1990s, and from 2014-16.
In yesterday’s Morning Briefing, we observed that the Index of Leading Economic Indicators (LEI), which has been falling since February 2023, is biased toward the performance of the goods side of the economy. The 10 components don’t reflect the increasing importance of services. They tend to focus on the most cyclical sectors of the economy, particularly manufacturing and housing. Services in real GDP have tended to be less cyclical than goods in the past—with the notable exception of during the pandemic, of course.
Similarly, although S&P 500 forward earnings certainly gives plenty of weight to services, services providing companies in the index tend to be less cyclical than goods-producing ones. The usual relative stability of services earnings explains why the y/y growth rate of forward earnings closely tracks the goods-focused ISM manufacturing purchasing managers index (Fig. 8).
The same can be said about the S&P 500 forward earnings’ close relationships with the growth rates of business sales and industrial production (Fig. 9 and Fig. 10).
The goods side of the economy has been depressed since mid-2022 because consumers have pivoted from buying goods to purchasing services. So on balance, the economy has continued to grow, supported by services and defying the recession heralders.
Strategy II: Is the Profit Margin Recession Over Yet? S&P 500 forward revenues per share remained near a record high during the May 11 week (Fig. 11). S&P 500 forward earnings per share peaked at a record high during the June 16, 2022 week and might have bottomed during the February 23 week of this year, down 5.9% from the peak. As noted above, it has been slowly rising since then. The forward profit margin of the S&P 500—which we calculate from S&P 500 forward revenues and forward earnings—peaked at 13.4% during the June 9, 2022 week. It fell to a low of 12.3% during the March 30 week of this year and edged up to 12.4% by the May 11 week.
Long story short, the recent earnings recession has been entirely attributable to a recession in the profit margin. Soaring commodity and labor costs squeezed margins. Both industrial commodity and petroleum prices have been falling since late last year (Fig. 12). Labor cost inflation seems to have peaked a few months ago (Fig. 13).
An analysis of the forward profit margins for the 11 sectors of the S&P 500 shows recent improving trends in Communication Services, Consumer Discretionary, Consumer Staples, Financials, Industrials, Information Technology, Materials and Real Estate (Fig. 14). Still falling are the forward margins of the Energy, Health Care, and Utilities sectors.
We think that the profit margin recession is over. If so, then the earnings recession should be over. The stock market may have started to discount this recent development in October of last year.
Credit I: Banking Crisis Update. So far, the banking crisis that started on March 8 with the deposit run on Silicon Valley Bank hasn’t turned into an economy-wide credit crunch. Yes, we all know that the Fed’s Senior Loan Officers Opinion Survey (SLOOS) shows that the banks have tightened their lending standards during the last two quarters.
However, the weekly bank loan series remains on an uptrend (Fig. 15). The series might have topped out at its recent record high of $12.2 trillion on March 15. It is down $49.2 billion through the May 10 week. Consumer and residential bank loans rose to record highs during the May 10 week (Fig. 16). Commercial and industrial loans and commercial real estate loans are starting to look toppy.
Credit II: Bond Drivers Review. Two of our favorite technical indicators for the 10-year Treasury bond yield are currently bullish. The yield tends to be highly correlated with the ratio of the nearby futures prices of copper to gold (Fig. 17). The ratio suggests that the yield, which is currently 3.70%, should be much closer to 2.00%. We view the ratio as a risk-on versus a risk-off indicator.
The Citigroup Economic Surprise Index (CESI) is highly correlated with the 13-week change in the10-year yield (Fig. 18). The CESI fell from a recent peak of 61.3 on March 28 to 5.5 on May 19.
Notwithstanding these bond yield relationships, the yield has risen from a recent low of 3.30% on April 5 and 6 to 3.72% on Monday. Over this same period, the 2-year Treasury yield has risen from 3.79% to 4.29%. That’s mostly attributable to better-than-expected March and April employment reports. In addition, a few Fed officials have opined that the Fed should continue to raise the federal funds rate or follow any pause in the rate-hiking with further hikes if necessary.
On the other hand, on Friday, Fed Chair Jerome Powell said that monetary policy is “restrictive.” So Fed policy will be data-dependent and particularly dependent on inflation indicators. For those of us in the “Fed-should-pause” camp, he seemed to suggest that a pause in tightening is possible. He acknowledged that the banking crisis is bound to tighten credit conditions, reducing the need for the Fed to get more restrictive in its policy stance. That continues to be our position.
Leading The Wrong Way?
May 22 (Monday)
Check out the accompanying pdf and chart collection.
Executive Summary: So where’s this recession signaled by the LEI and widely expected to come anytime now? Why haven’t high inflation and monetary tightening ground economic activity to a halt yet? Because a recession isn’t coming anytime soon. We never bought that it was inevitable anyway. We’re raising our subjective odds of a soft landing, instead of a recessionary hard one, to 70% from 60%. The burden of proof is now on the pessimists. … So what’s been keeping the economy from a textbook recession? Unusual forces are in play, acting as economic shock absorbers. … Also: Our Roaring 2020s boom-times thesis remains intact. … And: Dr. Ed reviews “Air” (+ +).
YRI Weekly Webcast. Join Dr. Ed’s live webcast with Q&A on Mondays at 11 a.m. EST. You will receive an email with the link one hour before showtime. Replays of the weekly webcasts are available here.
US Economy I: Lowering Odds of a Recession. Debbie and I are getting tired of waiting for a recession. Or rather, we’re getting tired of waiting for everyone else to stop waiting for a recession. Like playwright Samuel Beckett’s Godot, the most notorious no-show of all time, the most widely anticipated recession of all times continues not to arrive. We never bought the recession story anyway: We’ve been in the soft-landing camp rather than the hard-landing one since early last year, when recession fears mounted as the Fed started to raise interest rates and Russia’s invasion of Ukraine boosted inflation.
Nevertheless, we’ve acknowledged that the risk of a recession was not insignificant. So we assigned subjective probabilities of 60% for a soft landing and 40% for a hard landing. Today, we are changing our 60/40 mix to 70/30. We think that the burden of proof increasingly has been shifting from the optimists on the economic outlook to the pessimists, where it now rests.
The financial press seems to have come around to the same conclusion in recent weeks:
(1) The financial press explains it all. Nick Timiraos wrote about this issue in a March 6 WSJ article titled “Why the Recession Is Always Six Months Away.” He observed: “The next economic downturn has become the most anticipated recession in recent U.S. history. It also keeps getting postponed. Recent strong hiring and consumer spending are the latest evidence that the pandemic and the unprecedented policy measures that followed are interfering with the Federal Reserve’s campaign to tame inflation.” We agree with most of Timiraos’ article, but we don’t think that a recession is necessary to bring inflation down. It has been moderating quite well without the help of Godot.
In a similar vein, Agha Bhattarai wrote in an April 27 WP article: “The recession warnings began in early 2022, when inflation was surging, the economy was shrinking and consumers were feeling glum. But more than a year in, the long-feared economic downturn still hasn’t materialized. The economy has continued to grow. Inflation is slowing and the unemployment rate is near 50-year lows.”
Bloomberg posted an article on May 17 titled “Recession Calls Keep Getting Pushed Back, Giving Soft Landing Believers Hope.” Of the 27 forecasters surveyed by Bloomberg in early May, only five said they didn’t expect the US economy to slip into a recession sometime over the next year.
(2) Why the naysayers have been wrong. All three articles briefly reviewed why so many economists and other commentators have been so wrong for so long about a recession. Timiraos noted, “The government’s stimulus measures left household and business finances in unusually strong shape. Shortages of materials and workers mean companies are still struggling to satisfy demand for rate-sensitive goods, such as homes and autos. And Americans are splurging on labor-intensive activities they avoided in recent years, including dining out, travel and live entertainment.”
Bhattarai came up with a similar list of four explanations. She observed that the labor market has been remarkably robust as “the strong hiring has outpaced layoffs that have marred the tech, media and finance industries.” She also noted that government stimulus spending boosted personal income and bolstered excess saving. Third on her list: “Even as Americans have stopped buying things, they’ve been happy to splurge on experiences, like restaurants, flights, concerts and ballgames. That has helped keep the economy humming even as manufacturing slumps to a three-year low.” Lastly, the global economy has performed better than feared: “A mild winter in Europe helped keep higher energy costs at bay, while China’s economy has rebounded remarkably quickly in the months since it relaxed its zero-covid policies.”
Before we have a closer look at these reasons that the recession has been a no-show so far, let’s review the latest Composite Economic Indicators.
US Economy II: Misleading Leading Indicators. Once again, the Composite Economic Indicators, compiled by the Conference Board, are pointing in different directions. While the Index of Leading Economic Indicators (LEI) continues to predict a recession, the US economy continues to expand, with the Index of Coincident Economic Indicators (CEI) reaching yet another record high in April. Consider the following:
(1) LEI. The Index of Leading Economic Indicators (LEI) as well as its yield-curve spread component both have excellent track records of calling recessions, and they are doing so again now. The LEI fell in April for the 13th straight month, sinking 0.6% m/m and 8.6% over the period to the lowest level since September 2020 (Fig. 1).
The LEI, which peaked at a record high during December 2021, has led recessions by 12 months on average, with lead times ranging from two months to 18 months. It peaked before each of the past eight recessions, including even the pandemic recession. It could be right again, or perhaps it is overdue to be wrong for once.
(2) CEI. The CEI has only posted one decline in the past 10 months, climbing 0.3% in April and 1.7% y/y. It exceeds its previous record high, just before the pandemic, by 2.7%. It has tended to peak and trough during the same months that the business cycle has done so (Fig. 2). All four components of the CEI rose once again in April (Fig. 3).
(3) Growth rates. The y/y growth rate of the CEI closely tracks the y/y growth rate of real GDP (Fig. 4). The former was up 1.7% through April, while the latter was up 1.6% through Q1. Neither one is in recession territory.
The growth rate of the LEI is much more volatile than the growth rate of real GDP (Fig. 5). We've previously observed that the LEI tends to give heavier weight to the manufacturing side of the economy without recognizing the increasing importance of services. Its y/y growth rate closely tracks the manufacturing purchasing managers index (Fig. 6). Sure enough, the growth rate of the LEI tracks the comparable growth rate of goods in real GDP (Fig. 7). The goods side of the economy has been weak since mid-2022, when consumers pivoted from buying goods to spending more on services. Yet the economy continues to defy the hard landers.
US Economy III: Shock Absorbers. The pandemic was a shock to all our lives. It is over, but the aftershocks continue. Nevertheless, the economy hasn’t been rattled as much as feared. The severe two-month lockdown recession was followed by a V-shaped recovery during 2020. The recovery remained strong in 2021, but growth slowed in 2022 as rebounding inflation reduced consumers’ purchasing power and the Fed was forced to tighten monetary policy aggressively. Yet the economy didn’t fall into a recession last year, as was widely feared, nor has it this year so far.
Here is a list of some of the shock absorbers that absorbed the shocks unleashed by the pandemic:
(1) Demography. The number of senior citizens not in the labor force rose to a record 46.7 million during April (Fig. 8). Many of them have retired and have plenty of savings as well as income from pensions and Social Security. They also have lots of time to eat out, to travel, and to use healthcare services. So they are spending more on labor-intensive services, thus boosting the demand for workers (Fig. 9).
(2) Consumers. At 3.4% during April, the unemployment rate is tied for the lowest readings since 1969. There are lots of job openings (Fig. 10). Employers are scrambling to provide incentives for their workers so that they don’t quit and so that they can attract more workers. When possible, employers are allowing their employees to work from home (WFH), which allows workers to spend less money on commuting. In recent months, wages have been rising faster than prices, especially for lower-wage workers (Fig. 11). Flexible work schedules also allow people to take long weekends for traveling. There’s also more time to shop and dine locally on WFH days.
(3) Construction. Single-family housing activity has been in a recession since early last year. But multi-family construction has remained strong. Construction employment was at a new record high in April, increasingly led by rising payrolls for nonresidential and public construction projects thanks to onshoring and fiscal spending (Fig. 12, Fig. 13, and Fig. 14).
(4) Fiscal stimulus. The federal government is spending lots of money to build infrastructure and to provide incentives for onshoring, especially of semiconductor factories. Money is also going for green new deals. State and local governments have plenty of rainy-day funds provided by the federal government during the pandemic and are under pressure to spend more.
US Economy IV: The Roaring Twenties. During 2020, Jackie and I often wrote that the pandemic might be followed by the Roaring 2020s. Needless to say, the naysayers thought that was delusional and probably still think so. After all, the world economy was hard hit by the pandemic. Although it recovered quickly and strongly as lockdowns and social distancing restrictions were lifted, inflation soared, forcing central banks to slam on the monetary brakes during 2021 and 2022.
We countered that the Roaring 1920s were preceded by a global pandemic and a US depression in 1920. But the decade’s technological innovations boosted productivity and standards of living significantly. Today, productivity growth has been derailed by the remarkable turnover in the labor market that has been largely attributable to the pandemic. But we think it soon will be back on track.
We are sticking with what we wrote in the November 24, 2020 Morning Briefing:
“Today’s ‘Great Disruption,’ as Jackie and I like to call it, is increasingly about technology doing what the brain can do, but faster and with greater focus. Given that so many of the new technologies supplement or replace the brain, they lend themselves to many more applications than did the technologies of the past, which were mostly about replacing brawn. Today’s innovations produced by the IT industry are revolutionizing lots of other ones, including manufacturing, energy, transportation, healthcare, and education. My friends at BCA Research dubbed it the ‘BRAIN Revolution,’ led by innovations in biotechnology, robotics, artificial intelligence, and nanotechnology. That’s clever, and it makes sense.
“The current pandemic seems to be speeding up the pace at which these and other technologies are proliferating. Debbie and I believe that productivity growth has been heading toward a secular rebound during the post-pandemic Roaring 2020s. Even before the Great Virus Crisis (GVC), companies had been moving to incorporate into their businesses a host of state-of-the-art technologies in the areas of computing, telecommunications, robotics, artificial intelligence, 3-D manufacturing, the Internet of Things, among others. The GVC is accelerating that trend as companies rethink how to do business ever more efficiently in the post-pandemic era.”
Two years and a week later, on November 30, 2022, ChatGPT was launched, triggering just the kind of excitement about the potential impact of AI that we had envisioned. Myriad companies now have plans to leverage ChatGPT and other AI software to boost productivity and ameliorate their labor shortage problems.
Movie. “Air” (+ +) (link) is about Nike’s incredible success in pursuing a partnership with then-basketball-rookie Michael Jordan, among the greatest competitors in any sport of all time. Nike designed sneakers especially for Jordan and named them after the high-flying athlete. The marketing campaign worked brilliantly, enriching all concerned. The movie is focused on Sonny Vaccaro, who closed the deal with Jordan’s mother; she negotiated an amazingly lucrative contract on her son’s behalf, which ended up revolutionizing the world of sports.
Retail, Earnings & Fintech
May 18 (Thursday)
Check out the accompanying pdf and chart collection.
Executive Summary: Three major retailers recently reported Q1 results that provide a glimpse into consumers’ shifting spending trends. Notably, consumers seem to be putting off discretionary purchases. … Also: Perusing YRI’s forward earnings growth charts for S&P 500 industries is an eye-opening exercise: For four unrelated industries, analysts have set extremely high sights. Jackie explores. … And our Disruptive Technologies focus: Walmart’s self-reinvention as a financial services provider to the masses.
Consumer Discretionary: A Win, a Loss & a Tie. Three major retailers reported Q1 earnings this week, each with different outcomes. Home Depot’s sales declined 4.2% y/y, Target’s sales rose a flattish 0.6%, while TJX’s top line increased 3.3%. Considering that consumer price inflation rose 0.8% from February through April, none of these results were heroic.
Let’s take a look at the consumer’s health and what some of the retailers had to say about it this quarter:
(1) Extra SNAP benefits expire, but gas prices fall. In addition to inflation, some consumers faced the reduction of government benefits doled out during the pandemic. In March, the extra SNAP (food stamp) benefits first granted in March 2020 ended. They had amounted to an extra $90 a month per beneficiary, the Center on Budget and Policy Priorities estimates.
The sting was somewhat offset by the 12.5% cost-of-living increase in SNAP benefits in October. For a single person, the maximum benefit rose to $281 per month from $250. Personal income excluding government social benefits and adjusted for inflation is up 2.0% y/y in March and up 0.3% q/q (Fig. 1).
Conversely, consumers have benefitted over the past year from the drop in the price of gasoline. Its current average price nationwide is $3.65 per gallon, down from $5.11 at its peak in mid-June 2022 (Fig. 2). The lower price has notably reduced what households have had to spend on the fuel over the past year (Fig. 3).
(2) Target talk. Target’s management emphasized the pressure on discretionary purchases from inflation and rising interest rates. Apparel, home, and hard lines all experienced y/y declines in sales growth from the mid-single digits to low double digits as guests continued to pull back on discretionary purchases, said Chief Growth Officer Christina Hennington on the company’s earnings conference call Wednesday. She noted that shoppers are waiting until the last minute to buy discretionary items like new decor or clothes, often in response to upcoming holidays or events.
Conversely, sales of consumer staples fared better. Target’s beauty category enjoyed y/y comparable-store sales growth in the mid-teens, with the category benefiting from Ulta Beauty stores within Target stores. Food and beverage sales grew at rates in the high single digits, while household essentials delivered low-single-digit growth, with notable strength in the health and pet care categories.
Of some concern is Hennington’s observation that total sales were strongest in February, began decelerating in March, and softened further near the end of April. Target could pick up market share this summer as college students shop to fill their dorm rooms because that had been a strong niche for the now-bankrupt Bed Bath & Beyond.
Target seems to have resolved its inventory problem from earlier this year. Inventory ended Q1 16% below year-ago levels. The drop was even more dramatic in consumer discretionary inventories, which fell more than 25% y/y.
Lastly, management noted that theft at stores could shrink the company’s bottom line by $500 million this year compared to 2022. It’s a growing problem for every player in the industry.
(3) More warnings about discretionary spending. Home Depot executives also warned that consumers continue to pull back on discretionary purchases. “After a couple of years of unprecedented demand in the home improvement market, we continue to see softness in big-ticket discretionary categories like patios, grills, and appliances,” said Billy Bastek, Home Depot’s executive vice president of merchandising, on Tuesday’s earnings conference call.
Bastek also noted softness in Home Depot’s flooring, kitchen, and bath divisions and attributed it to consumers moving away from larger projects. As we noted in last Thursday’s Morning Briefing, Home Depot might also be facing increasing competition from Floor & Décor, a growing big-box retailer with a vast offering of flooring, decorative tiles, and other home improvement products. The competitor wasn’t mentioned on Home Depot’s call.
Officials did note that they saw strength in purchases of items that were part of smaller-ticket outdoor projects. The company has also been affected by lower commodity prices, including lower lumber prices. Framing lumber averaged about $420 per 1,000 board feet during the quarter compared to $1,170 in Q1-2022, a 64% decrease.
Home Depot’s comp-store sales growth followed a different pattern than Target’s, falling 2.8% y/y in February, declining 7.5% y/y in March, and improving to a 3.7% y/y drop in April. The company now expects 2023 sales to decline 2%-5% and earnings per share to drop 7%-13%.
CEO Ted Decker said that while consumers are still relatively strong, as evidenced by continued increases in personal consumption, Home Depot’s average customer is even stronger, tending to have “good jobs, increasing wages, and [they] own their homes.” But the company grew at a faster-than-average clip during the pandemic, and now its growth trend is normalizing.
(4) TJX pounces on deals. The strongest results were turned in by TJX, a retailer that has built its reputation on buying up inventories when other retailers are looking to sell. Over the past quarter or two, retailers have been reducing bloated inventories, creating an opportune environment for the off-price retailer. Same-store sales at the company’s retailing operation, Marmaxx, grew 5% y/y as customer traffic in the stores increased at a rate in the mid-single digits.
“Our [corporate] buyers took advantage of amazing deals in the marketplace, and the organization flowed product to the right stores at the right time and did a great job of merchandising the product, delivering on customer satisfaction and marketing. We are happy with our good start to the second quarter and are in a great position to take advantage of the phenomenal buying environment and ship fresh selections to our stores and online,” said CEO Ernie Herrman on the earnings conference call. “Going forward, we are excited about the opportunities we see to gain market share in the U.S. and internationally and continue to improve the profitability of TJX.”
The retailer wasn’t invincible. Its HomeGoods Q1 same-store sales decreased 7% y/y. Like Home Depot, HomeGoods saw unusually large sales increases during the pandemic, and sales are now normalizing. In Q1-2022, its same-store sales rose 40% y/y.
That said, results should improve going forward, and the retailer seems to be targeting the Bed Bath & Beyond market share that’s up for grabs: “We continue to see a terrific opportunity to capture additional share of the U.S. home market. In the first quarter, we opened our 900th HomeGoods store and continue to see excellent opportunities to grow both our HomeGoods and Home Sense banners,” said CFO John Klinger.
Strategy: Charts Heading to the Moon. They say a picture is worth a thousand words. We like to think so, with hundreds of charts on the Yardeni Research website. One of our favorite chart collections depicts the S&P 500 industries’ forward earnings estimates indexed to zero as of March 5, 2009, the start of the post-2008 financial crisis bull market. With just a quick glance, it’s clear which industries are expected to have brisk earnings growth and which aren’t so lucky.
Four charts that show eye-popping forward earnings growth come from four very different industries in four very different S&P 500 sectors: Managed Health Care (Health Care sector); Construction Machinery & Heavy Trucks (Industrials); Hotels, Resorts & Cruise Lines (Consumer Discretionary); and Electric Utilities (Utilities). (FYI: “Forward” earnings is the time-weighted average of analysts’ consensus operating earnings-per-share estimates for this year and the following year.)
Let’s give these exceptional charts a second look:
(1) One healthy chart. Since 2010, the S&P 500 Managed Health Care Industry’s forward earnings has been on an upward trajectory (Fig. 4). Analysts have forecast double-digit earnings growth for the industry’s companies collectively every year since 2015, including this year and next: Earnings are expected to climb 12.6% in 2023 and 11.8% in 2024 (Fig. 5).
After rising along with earnings for many years, the industry’s stock price index has plateaued for much of the past two years, and it’s down 9.9% ytd through Tuesday’s close (Fig. 6). As a result, the industry’s forward P/E has fallen to 16.6 down from a recent high of 21.4 in April 2022 (Fig. 7).
(2) Trucking upwards. Higher interest rates have failed to curtail construction, particularly when it comes to building factories for companies that are reshoring their manufacturing operations back to US shores. The industrial construction boom has helped bolster demand for construction machinery and heavy transportation equipment. The S&P 500 Construction Machinery & Heavy Transportation Equipment industry’s earnings forecasts have been on a sharp upward trajectory since early 2020, but that ends soon (Fig. 8).
At year-end 2020, analysts had expected the industry’s earnings to grow by 43.1% in 2021 and by 29.4% in 2022. This year, they expect 28.1% earnings growth. But that’s where the positive trend ends: In 2024, analysts are forecasting that earnings will drop by 3.0% (Fig. 9).
Investors clearly worry that this industry’s cycle is about to turn as well, because its stock price index has fallen 9.1% ytd through Tuesday’s close, and its forward P/E has fallen to 11.6, down from its 2021 high of 21.9 (Fig. 10).
(3) Cruising higher. The Covid pandemic brought travel to a halt, and the earnings growth that hotels and cruise lines enjoyed in 2019 quickly turned into double-digit losses by 2020. Since the start of 2021, the industry’s expected losses over the next 12 months have gotten incrementally smaller, and by the end of that year the industry once again was expected to generate forward earnings growth (Fig. 11).
Analysts are optimistic about next year, collectively projecting that earnings will grow 31.9% in 2024, and net earnings revisions just turned positive in March for the first time in eight months (Fig. 12). Investors have been feeling optimistic as well, sending the industry’s shares up 23.9% ytd through Tuesday’s close.
(4) Utilities: Not so boring. The S&P 500 Electric Utilities forward earnings chart is electrifying. Except for a few short-lived downward blips, the industry’s forward earnings has been on an upward trajectory since 2014 (Fig. 13). Earnings growth has accelerated from low-to-mid-single-digit to high-single-digit percentages. Analysts’ consensus estimates collectively imply earnings growth for the industry of 9.0% this year and 9.2% in 2024 (Fig. 14).
Despite the positive earnings projections, the industry’s stock price index has fallen 5.9% ytd through Tuesday’s close, and it has moved sideways for much of the past two years (Fig. 15). As a result, the industry’s forward P/E has fallen to 18.1, down from 21.9 last year (Fig. 16). Higher interest rates may have hurt the debt-laden industry, which pays dividends that compete with interest-paying bonds. But if the Federal Reserve is close to ending its hiking cycle, utilities stocks once again could electrify investors’ portfolios.
Disruptive Technologies: Walmart Grows Banking. The retail banking business isn’t easy. Just ask Goldman Sachs, which has been peddling back its attempt to break into the area.
Walmart, however, has continued making inroads into retail banking. It started by offering its customers financial services provided by other companies, like Capital One Financial and Affirm. Then in 2021, Walmart launched a fintech company in which it owns a controlling stake. Last year, that company acquired two other fintech companies that offer banking services directly to customers. Now Walmart’s fintech company reportedly plans to offer banking services to the retailer’s clients, likely displacing some of Walmart’s current corporate partners to do so.
Here’s a look at how the retail giant is laying the groundwork to become a financial giant as well:
(1) Growth through acquisitions. In January 2021, Walmart launched a fintech startup together with Ribbit Capital, one of the firms backing Robinhood. Two months later, Walmart hired Omer Ismail from Goldman Sachs, where he had headed Marcus, the investment bank’s online consumer banking business. Our March 11, 2021 Morning Briefing discussed possible implications of his arrival.
Our May 19, 2022 Morning Briefing noted that the Walmart majority-owned fintech purchased Even Responsible Finance and ONE Finance. Even allows companies to offer employees their paychecks early, and ONE’s offerings include debit cards and savings accounts through its relationship with Coastal Community Bank. Since the acquisition, the companies have adopted the ONE brand.
“The strategy is to build a financial services super app, a single place for consumers to manage their money,” Ismail told the WSJ in a January 26, 2022 article.
(2) Credit card crisis. Walmart offers a number of banking products through other companies. It offers credit cards through Capital One Financial, buy-now-pay-later loans through Affirm, and savings accounts and debit cards through Green Dot Bank. But recent moves seem to indicate that Walmart is moving toward replacing those vendors with the ONE fintech.
Walmart is suing Capital One, seeking to exit their credit card partnership. The lawsuit claims that the credit card company didn’t provide Walmart customers with the customer service it was obligated to offer, an April 7 WSJ article reported. Capital One reportedly failed to replace lost cards promptly and didn’t promptly post some transactions and payments to clients’ accounts.
A Capital One spokesman told the WSJ: “These immaterial servicing issues were cured by Capital One pursuant to the terms of the agreement, without harm to customers, the program, or Walmart.” They speculated that the suit was an attempt to renegotiate the terms of the contract or end it before its 2026 termination date. More recently, Capital One has claimed that Walmart “failed to meet its marketing obligations because it was unhappy with the economic terms of the partnership. In a new court filing, Capital One also accuses Walmart of trying to abandon a long-term deal … because the retail chain wants to move its credit card business” to ONE, a May 9 American Banker article reported.
Walmart presumably would benefit more from offering a credit card through its fintech joint venture to customers instead of issuing cards through Capital One.
(3) More banking services on the way? ONE reportedly is launching a buy-now-pay-later service that will be offered to Walmart customers online and in the stores, according to a December 8 article in The Information. ONE is also expected to offer checking accounts to Walmart employees and select customers in a beta test, according to a September 14 Reuters article.
The new ONE services could potentially replace similar ones Walmart currently offers (buy-now-pay-later via Affirm and MoneyCard savings accounts, debit cards, direct deposits, and online banking via Green Dot Bank).
Earnings & The Economy
May 17 (Wednesday)
Check out the accompanying pdf and chart collection.
Executive Summary: While the stock market’s technical measures of breadth have been disappointing, two fundamental measures have been staging impressive V-shaped rebounds typical of early bull markets: the breadth of analysts’ consensus expectations for S&P 500 companies’ revenues and operating earnings. … Their message is confirmed by recent strength in S&P 500 forward revenues, earnings, and profit margins. … Joe provides a deeper look into what forward profit margins have been doing in recent weeks on S&P 500 sector and industry levels. … All these developments jibe with our soft-landing economic forecast. … So do the latest economic indicator releases.
Strategy I: Bad & Good Breadth. Joe and I have recently observed that the S&P 500 has a breadth problem. This is a widely recognized problem by most technicians who track the stock market. The good news is that a more fundamental measure of earnings breadth is performing well. Consider the following:
(1) If we are in a bull market that started on October 12, 2022 as we still believe, our thesis isn’t getting much support from the ratio of the equal-weighted to the market-cap-weighted S&P 500 indexes (Fig. 1). This measure of breadth was rebounding nicely since the October 12 low, but it then dropped sharply after Silicon Valley Bank hit the fan in early March.
During the start of bull markets, this ratio tends to rise, indicating that more and more stocks are participating in the bull run. The same breadth issue can be seen in the New York Stock Exchange advance/decline line (Fig. 2).
(2) Joe and I also monitor the percent of S&P 500 companies trading above their 200-day moving averages (Fig. 3). It did rebound from 15.6% on October 14 to a recent high of 72.7% on February 3. But it’s been hovering around 50.0% in recent days. We would have liked to see a more V-shaped rebound in this breadth measure.
Also disappointing is the percent of S&P 500 companies with positive y/y price changes (Fig. 4). It has remained below 50.0% since the start of the bull market and was 45.2% on May 12.
(3) The good news is that the breadth of analysts’ consensus expectations for the S&P 500’s revenues and for its operating earnings continue to rebound in V-shaped formations (Fig. 5 and Fig. 6). The percent of S&P 500 companies with positive three-month percent changes in forward revenues rebounded from a recent low of 50.6% during the week of December 30, 2022 to an 11-month high of 75.1% during the May 12 week. The same pattern can be seen in the comparable measure for forward earnings; it rebounded from 44.4% during the December 30, 2022 week to 69.9% during the May 12 week, also an 11-month high. (FYI: “Forward” revenues and earnings are the time-weighted averages of analysts’ consensus estimates for the current and next years.)
The solid rebounds in these breadth measures of revenues and earnings are typical of the early stage of bull markets.
(4) The obvious explanation for the divergence of the technical and fundamental measures of breadth since the banking crisis started in early March is that the MegaCap-8 stocks (i.e., Alphabet, Amazon, Apple, Meta, Microsoft, Netflix, Nvidia, and Tesla) were boosted by the crisis, while the S&P 500 Financials got whacked by it. However, industry analysts didn’t see the banking crisis as reason enough to lower their earnings estimates for the Financials sector’s companies, as the crisis seems to have been contained so far. Once investors conclude that the crisis is over, the technical measures of breadth should recover.
The market capitalization of the MegaCap-8 has increased 36.4% ytd (Fig. 7). The S&P 500 Financials sector is down 6.3% ytd through Friday’s close (Fig. 8).
Strategy II: Bottoming Earnings. Confirming the improving outlook for earnings are S&P 500 forward revenues and earnings (Fig. 9). The former rose to a new record high during the May 4 week, while the latter seems to have been bottoming in recent weeks, implying that the forward profit margin is doing the same. All of these developments are consistent with our soft-landing scenario for the economy.
Here are some more details on earnings:
(1) Annual. S&P 500 forward earnings most recently bottomed during the February 9 week (Fig. 10). It rose 1.6% through the May 11 week, when industry analysts’ consensus earnings estimates for 2023 and 2024 were $220.09 and $245.83. Forward earnings is converging toward the 2024 estimate. (We will update our estimates once the Q1 earnings reporting season is completed within the next few days.)
(2) Quarterly. S&P 500 earnings for Q1 are turning out to be better than expected, showing the typical “earnings hook” in the data series as actual results are reported. Five weeks ago, the blended estimate combining estimated and reported results showed a 7.9% y/y decline (Fig. 11). During the May 11 week, it was pared to -3.3%.
Here are the y/y growth estimates for the remaining quarters of this year: Q2 (-8.2%), Q3 (0.0%), and Q4 (8.7%). In other words, y/y earnings comparisons should bottom during the current quarter (i.e., Q2). In any event, the stock market increasingly gives more weight to next year’s expected results as the current year goes on.
(3) Sectors. The bottoming of forward earnings is clearly visible in 10 of the 11 sectors of the S&P 500 (Fig. 12). The one exception is S&P 500 Energy, where forward earnings has been falling since last summer. This bottoming breadth among sectors is consistent with the earnings breadth measure that we discussed above.
Strategy III: Forward Profit Margin Rising Following Q1 Results. As of mid-day Tuesday, the S&P 500 companies’ Q1 earnings season is nearly 92% complete. Those with quarters ending in April are just starting to release results. This year’s Q1 reporting season is notable for its unexpectedly large upside earnings surprise. As a result of the earnings strength, most of the S&P 500’s 11 sectors have seen their collective forward profit margin rise. (FYI: We calculate forward profit margins from the forward earnings and forward revenues data derived from analysts’ consensus estimates.)
While we await S&P’s release of its preliminary revenues and earnings for Q1, let’s take a look at our S&P 500 Sectors & Industries Forward Profit Margins report to see how the analysts polled by Refinitiv have reacted so far to the results; we highlight the notable changes below:
(1) S&P 500 margin forecast finding a bottom? The S&P 500’s forward profit margin rose 0.1ppt w/w during the May 4 week to 12.4% from a 24-month low of 12.3% during the April 27 week (Fig. 13). That was the first uptick in the forward profit margin since it peaked 10 months ago at a record high of 13.4% during the June 9, 2022 week.
The improvement in the forward profit margin is a welcome sign after nearly a year of steady declines. However, we don’t expect a rapid V-shaped margin expansion like the one following the recovery from the Great Virus Crisis’ lockdowns. Back then, all 11 S&P 500 sectors’ forward margins rebounded sharply. Instead, we envision a rolling margin recovery like the one following the Great Financial Crisis, with the overall S&P 500 forward margin bouncing along until earnings growth returns.
The forward profit margin tends to move slowly. While some sectors’ forward margins are benefitting from accelerated cost cutting, their further margin expansion will require stronger revenue growth as well. Other sectors’ and industries’ margins will continue to languish near their lows or fall further as they continue to lose pricing power amid flattish or falling revenues.
(2) Majority of sectors improving. Many of the 11 S&P 500 sectors delivered noticeable earnings beats during Q1, and most saw their forward profit margin tick higher. But only one sector had a big forward margin bounce: Communication Services. From the start of the earnings reporting season during the April 6 week through the May 4 week, its forward profit margin jumped to 15.3% from 14.5%.
Six others saw more modest advances in forward profit margin over those weeks: Consumer Discretionary (up to 7.5% from 7.3%), Industrials (10.5, 10.3), Materials (11.2, 11.0), Information Technology (23.6, 23.3), Real Estate (16.8, 16.6), Consumer Staples (6.8, 6.7). The remaining four sectors’ margins either fell or held steady: Energy (11.4, 11.7), Financials (18.2, 18.4), Utilities (13.0, 13.2), and Health Care (9.6, 9.6).
(3) Best & worst industries. Over the last four weeks through the May 4 week, more than half of the 100-plus S&P 500 industries have seen their forward profit margin rise (Table 1). There isn’t any clear secular trend among the industry winners and losers of this margin derby. That fact highlights that picking the right industry with improving secular trends tends to trump getting the overall economic outlook correct.
These are the industries with the biggest forward profit margin gains from the April 6 week to the May 4 week: Casinos & Gaming (down to 5.4% from 4.1%), Interactive Media & Services (21.6, 20.1), Construction Machinery & Heavy Transportation Equipment (12.3, 11.4), Homebuilding (11.5, 10.4), and Gold (15.7, 14.7). Here are the industries with the biggest margin declines: Personal Care Products (7.4, 8.6), Regional Banks (24.1, 26.4), Oil & Gas Refining & Marketing (5.2, 5.5), Consumer Finance (14.5, 15.4), and Paper & Plastic Packaging Products & Materials (6.2, 6.5).
US Economy: No Hard Feelings. All of the above earnings developments are consistent with our soft-landing scenario, as were Tuesday’s economic releases for April’s retail sales and industrial production. There’s no hard landing indicated in these indicators:
(1) Retail sales. As we noted following the release of April’s employment report, our Earned Income Proxy for private-sector wages and salaries in personal income rose 0.7% m/m during the month (Fig. 14). That augured well for April’s retail sales, which, however, rose less than expected by 0.4% m/m. But retail sales excluding motor vehicles & parts, service station sales, and building materials & garden equipment showed an increase of 0.7% m/m. A better measure of auto sales is provided by Autodata, which showed a 7.7% m/m increase (Fig. 15). The weakness in service station retail sales (down 0.8%) reflected lower gasoline prices. Building materials sales are included in residential investment in real GDP rather than in consumer spending.
(2) Industrial production. April’s 0.5% increase in industrial production was led by a 13.7% jump in motor vehicle assemblies (Fig. 16). Output of high-tech equipment rose 1.5% m/m, led by a 1.5% jump in computer & peripheral equipment to a new record high (Fig. 17).
(3) GDPNow. There’s no hard landing evident in these latest economic releases. Indeed, the Atlanta Fed’s GDPNow tracking model showed a 2.6% increase in real GDP during Q2, a downtick from 2.7% following the latest economic stats. The estimate for real consumer spending was lowered from 1.8% to 1.6%, while spending on capital equipment was raised from 1.1% to 1.5%.
(4) Coincident indicators. On Thursday, the Conference Board will release April’s indexes of Coincident Economic Indicators (CEI) and Leading Economic Indicators (LEI). The LEI has been anticipating a recession since early last year. The latest economic indicators, however, suggest that the CEI rose to yet another record high during April.
Economic & Financial Stress & Stability
May 16 (Tuesday)
Check out the accompanying pdf and chart collection.
Executive Summary: Two different recent surveys taking the pulse of businesses—one measuring sentiment among small business owners nationwide and the other manufacturing activity in New York State—showed depressed readings. The problem isn’t demand but the ability to supply given the tight labor market. … Two recent Federal Reserve reports—measuring the household debt and credit of US consumers and the financial stability of the economy generally—showed that neither the consumer nor the banking sector nor the financial system generally is especially stressed.
Weekly Webcast. If you missed Monday’s live webcast, you can view a replay here.
US Economy I: Small Business Owners Are Depressed. April’s survey of small business owners was released on Tuesday, May 9. It is conducted by the National Federation of Independent Business (NFIB). The Small Business Optimism Index decreased by 1.1 points in April to 89.0, the lowest reading since January 2013 (Fig. 1). Labor quality was the top business problem, at 24%, with inflation in second place at 23%. “Optimism is not improving on Main Street as more owners struggle with finding qualified workers for their open positions,” said NFIB Chief Economist Bill Dunkelberg. “Inflation remains a top concern for small businesses but is showing signs of easing.” Here are some more details from the NFIB report:
(1) Job openings. The percentage of all owners reporting job openings they could not fill in the current period rose 2 points to 45% in April (Fig. 2). The percentage with openings for skilled workers was 37%, up 3 points, and the percentage with openings for unskilled labor was 19% (unchanged). The difficulty in filling open positions is particularly acute in construction, transportation, and manufacturing industries. Openings are lowest in finance.
(2) Capital spending. Fifty-six percent of small business owners reported making capital outlays in the last six months, down 1 point from March. Nineteen percent plan capital outlays in the next few months, down 1 point from March and the weakest reading since April 2020 (Fig. 3).
(3) Inflation. The net percentage of owners raising average selling prices decreased 4 points from March to 33%, the lowest since March 2021. A net 21% plan price hikes, down 5 points from the March level (Fig. 4). That’s the lowest reading since November 2020.
(4) Credit. Only 4% reported that financing was their top business problem (up 1 point). A net 6% reported that their last loan was harder to get than previous loans (down 3 points) (Fig. 5). A net 26% of owners reported paying a higher rate on their most recent loan, unchanged from March. The average rate paid on short maturity loans was 8.5%, 0.7ppt above the March level and the highest since October 2007. Thirty-one percent of all owners reported borrowing on a regular basis (up 1 point) (Fig. 6).
(5) Bottom line. Small business owners are still hiring but can’t find enough workers to meet the demand for their goods and services.
US Economy II: Depressed in New York State Too. Business activity fell sharply in New York State, according to firms responding to the May 2023 Empire State Manufacturing Survey conducted by the Federal Reserve Bank of New York. The headline general business conditions index dropped forty-three points to -31.8. New orders and shipments plunged after rising significantly last month. Delivery times shortened somewhat, and inventories contracted. Both employment and hours worked edged lower for a fourth consecutive month. Prices increased at about the same pace as last month. Capital spending plans turned sluggish (Fig. 7). Looking ahead, businesses expect some improvement in conditions over the next six months.
This survey is the first of the regional business surveys conducted by five of the 12 Fed district banks. The New York survey provides among the most current insights into the latest month, in this case May. It’s not a pretty picture, as we just saw. However, compared to the other four surveys, its results have been more volatile from month to month and have been especially so over the past 17 months (Fig. 8).
US Consumer: Good Credit. The Federal Reserve Bank of New York issued its Q1 report on Household Debt and Credit yesterday. The report shows no signs of financial distress even though aggregate household debt balances increased by $148 billion during the quarter to a record $17.05 trillion (Fig. 9). They have increased by $2.9 trillion since the end of 2019, just before the pandemic recession. Here are some of the other details from the report:
(1) Balances. Mortgage balances shown on consumer credit reports increased by $121 billion during Q1 and stood at $12.04 trillion at the end of March, a modest increase. Balances on home equity lines of credit (HELOC) increased by $3 billion, the fourth consecutive quarterly increase following a nearly 13-year declining trend; the outstanding HELOC balance stands at $339 billion.
Credit card balances were flat, at $986 billion, bucking the typical trend of balance declines during first quarters. Auto loan balances increased by $10 billion in Q1, continuing the upward trajectory in place since 2011. Other balances, which include retail cards and other consumer loans, increased by $5 billion. Student loan balances stood at $1.60 trillion at the quarter’s end, up by $9 billion from the previous quarter’s end. In total, non-housing balances grew by $24 billion (Fig. 10).
Among individuals with a credit report, here are the Q1 per-capita balances for all debt ($60,300), mortgages ($42,600), home equity revolving credit ($1,200), auto loans ($5,500), credit card debt ($3,500), and student loans ($5,600), and other ($1,800) (Fig. 11 and Fig. 12).
(2) Originations. The median credit score for newly originated mortgages decreased slightly to 765. The median credit score on newly originated auto loans ticked up 10 points, to 721, suggesting some tightening (Fig. 13 and Fig. 14).
(3) Delinquencies. Aggregate delinquency rates were roughly flat in Q1 and remained low after declining sharply through the beginning of the pandemic. As of March, 2.6% of outstanding debt was in some stage of delinquency, 2.1ppts lower than in Q4-2019, just before the Covid-19 pandemic hit the US.
(4) Foreclosures. Although the CARES Act’s foreclosure moratorium has been lifted nationally, new foreclosures have stayed very low since the moratorium began. About 35,000 individuals had new foreclosure notations on their credit reports, roughly flat with Q4 (Fig. 15).
(5) Student loans. As mentioned above, outstanding student loan debt stood at $1.60 trillion at the quarter’s end. Less than 1% of aggregate student debt was 90+ days delinquent or in default, a small decline from the previous quarter. Delinquency rates fell substantially in the previous quarter due to the implementation of the Fresh Start program, which made previously defaulted loan balances current (Fig. 16).
(6) Bottom line. Keep walking: There’s nothing new to see or to worry about here, for now.
The Fed: A Remarkably Calm Report on Financial Stability. On Monday, May 8, the Fed released its semiannual Financial Stability Report. “Frequently cited topics in this survey included persistent inflation and tighter monetary policy, banking-sector stress, commercial and residential real estate and geopolitical tensions,” the report stated. It was remarkably relaxed about the recent banking crisis: “Overall, the banking sector remained resilient, with substantial loss-absorbing capacity.”
Furthermore: “Substantial withdrawals of uninsured deposits contributed to the failures of SVB, Signature Bank, and First Republic Bank and led to increased funding strains for some other banks, primarily those that relied heavily on uninsured deposits and had substantial interest rate risk exposure. Policy interventions by the Federal Reserve and other agencies helped mitigate these strains and limit the potential for further stress.”
What if the banking crisis flares up again? Here is the Fed’s answer: “The Federal Reserve is prepared to address any liquidity pressures that may arise and is committed to ensuring that the U.S. banking system continues to perform its vital roles of ensuring that depositors’ savings remain safe and providing access to credit to households and businesses in a manner that promotes strong and sustainable economic growth. These additional funding sources bolster the capacity of the banking system to safeguard deposits and ensure the ongoing provision of money and credit to the economy. The additional funding to eligible depository institutions will continue to serve as an important backstop against further bank stresses and support the flow of credit.”
In other words, keep walking: There’s nothing to worry about here, for now.
The Fed’s report did devote a couple of pages (pages 15-16) to financial institutions’ exposure to commercial real estate (CRE) debt. The analysis observed: “The shift toward telework in many industries has dramatically reduced demand for office space, which could lead to a correction in the values of office buildings and downtown retail properties that largely depend on office workers. Moreover, the rise in interest rates over the past year increases the risk that CRE mortgage borrowers will not be able to refinance their loans when the loans reach the end of their term.”
The report also noted that small banks as well as insurance companies are most exposed to the higher credit risks in CRE debt. The Fed “has increased monitoring of the performance of CRE loans and expanded examination procedures for banks with significant CRE concentration risk.”
Keep walking: The Fed is on the case.
Disintermediation, Disinflation & Dystopia
May 15 (Monday)
Check out the accompanying pdf and chart collection.
Executive Summary: The Fed sought to allay fears of bank runs when it provided backstop funds to banks. Consider the fears allayed—so far, at least. The disintermediation threat hasn’t descended; it hasn’t wrought a credit crunch, a recession, or widespread economic destruction. Now if fears aren’t stoked by further talk of bank runs, maybe, just maybe, the threat will go away. … Also: The high-inflation saga‘s loose ends all seem to be resolving now in a Hollywood-style happy ending. … And: The latest episode of the debt ceiling drama playing out in Washington is ably narrated by Capital Alpha’s Jim Lucier. … Lastly: Dr. Ed reviews “Beef” (+ + ).
YRI Weekly Webcast. Join Dr. Ed’s live webcast with Q&A on Mondays at 11 a.m. EST. You will receive an email with the link one hour before showtime. Replays of the weekly webcasts are available here.
Disintermediation: A Quiet Place. “A Quiet Place” is a 2018 science fiction horror film. The plot focuses on the Abbott family, which struggles to survive in a post-apocalyptic world inhabited by blind extraterrestrial creatures with an acute sense of hearing. The Abbotts must avoid making any noise or risk sure death. They communicate by sign language.
Fed officials are hoping that they’ve succeeded in quieting any noise about deposit runs in the banking system. To contain the banking crisis that erupted during the week of March 10, the Fed introduced the Bank Term Funding Program (BTFP) on March 12. It was designed to supplement the traditional discount window as a source of liquidity to the banking system through March 11, 2024:
“The BTFP offers loans of up to one year in length to banks, savings associations, credit unions, and other eligible depository institutions pledging any collateral eligible for purchase by the Federal Reserve Banks in open market operations, such as U.S. Treasuries, U.S. agency securities, and U.S. agency mortgage-backed securities. These assets will be valued at par. The BTFP will be an additional source of liquidity against high-quality securities, eliminating an institution’s need to quickly sell those securities in times of stress.”
The March 12 press release stated that the BTFP “will make available additional funding to eligible depository institutions to help assure banks have the ability to meet the needs of all their depositors.” The Fed can’t insure all deposits. That would require an act of Congress authorizing the FDIC to raise the current insured deposit limit of $250,000. So instead, the Fed has assured depositors that their banks are safe because they have access to plenty of liquidity.
So far, so good:
(1) The Fed’s total loans to the banking system jumped from only $15.1 billion on March 8 to peak at $357.9 billion on March 29. The figure was down slightly to $309.0 billion on May 10 (Fig. 1 and Fig. 2). Primary credit (a.k.a. discount window borrowing) plunged from a peak of $117.0 billion on March 22 to just $4.6 billion on May 10. Other credit extensions to support the FDIC’s efforts to restructure the three failed banks (so far) rose to $214.4 billion.
(2) Deposit outflows so far haven’t suggested a run as much as a walk. From March 8 through May 3, deposits are down $449.2 billion (Fig. 3). Some of that drop was offset by a $219.8 billion decline in securities held by the banks and a $508.2 billion increase in their borrowing. These figures undoubtedly were skewed by the three failed banks.
(3) The volume of loans being made is the key indicator of whether the banking crisis to date turns into an apocalyptic credit crunch. Again, so far, so good: From March 8 through May 3, loans are up $24.7 billion (Fig. 4). Both residential real estate and consumer loans rose to new record highs on May 3. Commercial & industrial loans and commercial real estate loans rose to record highs just before the banking crisis started. They’ve edged down since then but remain near their record highs.
(4) Bottom line: “Shhhh!” So let’s not have any more talk about deposit runs. Let’s keep very quiet about this matter so as not to provoke a killer credit crunch and a recession. We may signal but not verbalize “Shhhh!” by putting our index fingers in front of our lips.
Disinflation: It’s a Wonderful Life. Will the latest inflation story have a happy ending, as did “It’s A Wonderful Life,” the 1946 Christmas classic starring Jimmy Stewart and Donna Reed?
Financial markets anticipated an unhappy ending during the first 10 months of last year. Over that period, bond investors (like Fed officials) realized that they were behind the inflation curve. The 10-year Treasury yield rose from 1.63% at the start of 2022 to peak at 4.25% on October 24 (Fig. 5). That happened as the CPI inflation rate soared from a lockdown low of 0.1% y/y on May 2020 to peak at 9.1% on June 2022.
It has fallen every single month since then to 4.9% in April of this year. The bond yield has remained below its October 24 peak, falling to 3.46% at the end of last week. If disinflation continues at this pace, the CPI inflation rate could be down to 3.0%-4.0% in time for Christmas. That’s our wonderful life forecast.
Stock investors seem to be coming around to this happy outlook as well. The forward P/E of the S&P 500 plunged from 21.5 on January 3, 2022. It bottomed at 15.1 on October 12 last year. It was back up to 18.0 on Friday (Fig. 6).
Let’s review a few of the happy-ending inflation indicators:
(1) Disinflation correlations. Services account for 61.5% of the CPI. So it isn’t surprising that the CPI inflation rate on a y/y basis is highly correlated with the ISM Services prices paid index pushed ahead by three months (Fig. 7). The actual latter series fell from a peak of 84.5 during December 2021 to 59.6 during April 2023. That implies that the CPI inflation rate is on track to fall to 3.0% by July!
But it’s a little hard to believe that will happen since rent isn’t reflected in the ISM measure but is a major component of the CPI. Rent inflation seems to be peaking only now and might take a while to fall back down to its pre-pandemic pace. Christmas occurs in December, not July, but maybe it will start early this year for investors.
Christmas might come in September if we can rely on the correlation between the CPI inflation rate and the percent of small business owners planning to raise their average selling prices their average selling prices, pushed ahead by five months (Fig. 8). The actual latter series peaked at a record 54% during November 2021 and fell to 21% in April 2023. That suggests that the CPI inflation rate could fall to 3.0% by September. Ho! Ho! Ho!
(2) PPI and CPI for personal consumption. While the CPI was still up 4.9% through April, the PPI for personal consumption was up only 2.7% y/y through April, little changed from March’s 26-month low of 2.5%, and down dramatically from last year’s peak of 10.4% during March 2022 (Fig. 9). The PPI does not include rent either.
(3) Rent. The CPI measures of rent inflation remained elevated during April, with primary residence at 8.8% and owners’ equivalent rent at 8.1% (Fig. 10). However, the three-month annualized rates for both fell to 7.3% and 6.9%, suggesting that both have peaked.
(4) Food & energy. Clearly peaking is the CPI foods index (Fig. 11). The y/y rate was 7.7% through April, but the three-month annualized rate was down to 1.7%. The CPI energy index peaked at 41.6% y/y during June 2022. It was down to -5.1% in April.
(5) Core services inflation excluding housing. Fed officials are particularly concerned about the stickiness of the core services PCED ex-housing costs inflation rate (Fig. 12). It has been stuck around 4%-5% for the past 11 months through March. The comparable series for the CPI is for services excluding energy and shelter. It peaked at 6.7% during September 2022 and fell to 5.0% through April.
Dystopia: On the Beach. “On the Beach” is a 1959 post-apocalyptic science fiction drama film starring Gregory Peck, Ava Gardner, Fred Astaire, and Anthony Perkins. It is based on Nevil Shute's 1957 novel with the same name depicting the aftermath of a nuclear war. Today, our fearless political leaders in Washington may be on the brink of a disaster of their own making if they don’t come an agreement soon on raising the debt limit.
Our good friend Jim Lucier and his colleagues at Capital Alpha Partners do an outstanding and brave job of watching Washington for investors. The following is Jim’s May 11 take on the outlook for the debt ceiling negotiations:
(1) Bueller, Bueller … Investors seem surprisingly relaxed about the Treasury Department’s projected June 1 X-date. But members of Congress are focused on a different deadline: How to get out of town for Memorial Day. The Senate is set to leave on May 19, the House on May 25. Neither comes back until June 6. That means that if there is to be a short-term extension of the debt ceiling deadline, as we expect, both houses need to approve it before they leave. Only then will members be free to go on vacation.
It's the Senate’s turn to move first. One reason House Speaker Kevin McCarthy (R-CA) seems to say (for now) that the House won’t approve a short-term extension is that House members are still in a resting phase following their close vote to pass the House debt limit package on April 26. We think the House will be surprisingly ready to act once the Senate takes its turn. As we have noted previously (see May 3: When the Dust Settles), action, pause, and reaction is basically the way that Congress works.
The Big Four congressional leaders met with President Joe Biden on May 10. One House Republican reportedly called the meeting “a total waste of time.” We’re delighted because that was the optimal outcome. The meeting had to happen, but there was no particular need for anything to be accomplished by it. Things could have gone much worse. It might have devolved into a shouting match. Even worse, Biden could have taken the opportunity to lecture House Republicans, as President Obama did in 2011. It’s in the President’s interest not to hector the Republicans, causing them to dig in their heels against a deal, as we think House Republicans will allow a deal to pass the House with Democratic votes. But it needs to be the right deal.
Staff is meeting on Capitol Hill to begin negotiations. This is great, in our opinion. What they’re talking about, no one knows. It could be a spending agreement, as Democrats want; or a spending agreement linked to increasing the debt limit, as Republicans prefer. The key thing is that they are talking, and they are talking about a spending agreement. The genie is out of the bottle.
(2) Back to the future. The Big Four will meet again at the White House on Friday, May 12. If there’s a framework agreement by then, so much the better. It would be a skeletal agreement at best, with perhaps three elements: base year (fiscal 2022 or fiscal 2023), growth factor (perhaps 1%), and some additional bell or whistle. A framework agreement would make voting on an extension easier—as, indeed, an extension will be necessary because working out the additional details could take weeks or months. (Note: The May meeting 12 was postponed to this week amid constructive comments from both sides about “progress” being made. Jim is encouraged by this and thinks we could see a framework agreement that is more comprehensive than the bare-bones deal he outlines here.)
As we have written previously (see May 2: Take a Chill Pill), we could see an extension of 30, 60, or 90 days; but in our view, 30 or 60 days will not be enough, and 90 won’t work because the end of that period lands on Labor Day Weekend. So we think a longer 120-day extension to September 30 (or several short extensions to that date) is possible. But what matters more to us than the length of the extension is that once talking starts, the gangs break loose. This would be a literal gang on the Senate side and an organized caucus such as the Problem Solvers on the House side.
Senate Majority Leader Charles Schumer (D-NY) has been able to keep the Senate Democrats united in the position that no talks are needed; a clean debt limit increase is the only option. But once there is a deal in the making, it is going to be harder and harder for Schumer to keep his members out of it.
Collective Washington, us included, is shocked that McCarthy managed to get a debt limit package through the House. He got it through on a tight vote and with dubious expedients, but no one expected him to get it done at all, let alone in April, and to emerge with his political standing intact if not enhanced. The White House and Senate Democrats had not planned for this; they’re still processing the information and deciding what to do in response. The Hive Mind is buzzing for a while.
But there’s more information requiring processing, which may not yet be fully factored in on the Senate side. That information came to us as a second shock last week. After some initial doubt, even after the House passed the Limit, Save and Grow Act (H.R. 2811), we have concluded that McCarthy is secure in his position as speaker—at least more secure than we’d expected. We think that short of some extreme tail-risk event, McCarthy is likely to retain his position as speaker until the end of this Congress. We are hearing this from more and more Republican sources on the Hill.
This does not mean that McCarthy could accept just any bill from the Senate side, but we think that any bipartisan bill that gets 60 Senate votes (including nine Republicans) and the support of more than half the House Republican Conference is a bill that McCarthy could get through the House.
(3) We’ve seen this movie before. Since such a bill would need up to 51 Democratic votes on the Senate side, we don’t see House Democrats voting against it en masse. As a result, we think the debt limit drama this year will look more like a movie we’ve seen before. Last week (May 2), we wrote about “Ferris Bueller’s Day Off.” This week, we’re reminded of another 1980s teen classic, “Back to the Future.”
If those who see a quick deal coming are correct, then Hallelujah. A framework deal by this weekend or soon would be great too. We think 2023 ultimately will play out like 2011, except that the final product will be less ambitious, its construction ramshackle by comparison, and its effectiveness more doubtful. Though we see the debt ceiling lift happening by September 30, we think that appropriations could take until Christmas to work out, or longer, as they often do. Then we’d worry about a greater risk than usual of long-term continuing resolutions in place of one or several appropriations bills.
There’s still significant risk of failure, but that risk seems to be diminishing over time, as the financial markets may be telling us already.
Movie. “Beef” (+ +) (link) is a Netflix mini-series about the many potential adverse consequences of getting into a road-rage beef with another driver. In this case, the altercating male and female drivers have lots of homegrown frustrations that inflame their anger on the road. In other words, they have much in common. Needless to say, their hostile incident only worsens their personal woes. The moral of the story is: Deal with your rage at home. Don’t take it on the road. If you do, you run the risk of instigating a fight with someone as nuts as you are. This series is reminiscent of “Falling Down” (1993), another road-rage movie starring Michael Douglas.
Travel, Homes & Hydrogen
May 11 (Thursday)
Check out the accompanying pdf and chart collection.
Executive Summary: Maskless and Covid-free, Americans have been venturing further abroad this year, a trend that has saddled companies with domestic-travel-related businesses with tough y/y comparisons. Airbnb and Wynn are prime examples. … Also: Jackie examines the curious divergence between the share price performances this year of two housing-related S&P 500 industries, Homebuilding and Home Improvement Retail, which usually perform in lockstep. … And: Our Disruptive Technologies focus this week is on utilities’ use of hydrogen to produce electricity.
Consumer Discretionary I: Tougher US Travel Comps. The further the pandemic recedes into the past, the more adventurous travelers are growing and the tougher y/y comparisons for travel within the US are getting. Airbnb’s CEO Brian Chesky noted on his company’s Q1 earnings conference call that more guests are traveling overseas and returning to cities.
That’s great news for international airlines, for hotels and casinos with international exposure, and for cruise lines. But revenue growth at US operations has started decelerating albeit from very high levels as y/y comparisons get tougher and as travelers look to vacation overseas.
Domestic traffic on airlines registered in the US measured in revenue passenger kilometers rose 4.4% y/y in March, while international traffic for carriers registered in North American climbed 51.6% y/y in March, according to a May 4 International Air Transport Association press release. The fastest growth is occurring in Asia, where China’s Covid travel restrictions only expired in December. Domestic travel on Chinese carriers grew 195.2% y/y, and international travel on Asian Pacific carriers jumped 283.1%.
Let’s look at the Q1 results at Airbnb and Wynn Resorts to see how this trend is playing out:
(1) US growth is great but slowing. Airbnb has places to rent around the world, but its operations are primarily in North America and Europe. In Q1, its total revenue grew an impressive 20.4%, boosted by its international operations, which grew more quickly than those in North America. Here’s how Airbnb’s Q1 revenue grew y/y by its listings’ geographic location: North America (12.5%), Europe, Middle East, Africa (22.8), Latin America (32.0), and Asia Pacific (47.0).
Last year when the reopening was newer, Airbnb grew Q1 revenue more quickly, by 70.1% y/y. The company has changed its format for reporting international sales since last year. In Q1-2022, Airbnb broke out only US revenue, which grew 41.1% y/y, and international revenue, which grew 95.9%.
Airbnb shares dropped 10.9% on Wednesday to $113.19 in reaction to the Q1 results. Some press attributed the share price drop to the company’s Q2 revenue forecast of $2.35 billion to $2.45 billion, the midpoint of which is slightly below the Wall Street analysts’ consensus estimate of $2.42 billion. We’d bet that investors are more concerned that the days of easy US comps are in the rearview mirror.
(2) Wynn wins in Macau. Wynn Resorts’ Q1 revenue grew both in the US and abroad, but the largest percentage increase occurred at its Macau casinos, which benefitted from the lifting of Covid restrictions in China in late 2022.
Revenue at Wynn’s Macau operations jumped 70.8% y/y to $230.7 million in Q1, while revenue grew at its Las Vegas operations by 33.0% y/y to $586.8 million and at its Boston property by 13.4% y/y to $216.3 million. Altogether, Wynn’s Q1 revenues jumped 49.3% y/y to $1.4 billion, and the company reinstated its dividend.
“[T]he [Macau] market is coming back much more quickly than anybody would have thought of certainly six, nine months ago. It’s incredibly good to see,” said CEO Craig Billings on the company’s Q1 earnings conference call. And regarding Las Vegas, he added: “Despite the confluence of high inflation, high interest rates, bank failures and increasingly difficult year-over-year comps, Wynn Las Vegas delivered an all-time record in Q1 … supported by a consumer that continues to feel flush. … Looking ahead, we currently have a strong pipeline of forward group demand, continued rooms pricing power, healthy drop in handle and a robust programming calendar, particularly in the back half of the year.”
But then he noted: “I continue to watch the macro factors that I mentioned earlier, and I will note that, with Q2 2023, we will begin comping against some very strong prior year quarters.” Wynn shares were largely unchanged on Wednesday, falling 0.2% to $111.50.
Consumer Discretionary II: Homebuilding vs Home Retail. Not all home-related industries are having the same performance in 2023. The S&P 500 Homebuilding stock price index shot up 28.1% ytd through Tuesday’s close, while the S&P 500 Home Improvement Retail stock price index has languished, falling 4.7% ytd (Fig. 1 and Fig. 2).
The performance divergence is especially notable given that the two indexes had been moving in tandem for the past three years. While we were trapped at home during the pandemic, both industries’ stock price indexes rose as people either fixed up their abodes or moved out of small apartments and bought a home. From December 31, 2019 through December 31, 2021, the S&P 500 Home Improvement Retail industry gained 97.2%, and the Homebuilding industry wasn’t far behind with an 84.0% gain.
After the home boom came the home bust. When Covid cases declined, Americans gave up decorating and gardening and returned to restaurants and traveling. Rising interest rates further crimped large home renovations and home purchases by making financing exponentially more expensive. The 30-year fixed mortgage rate has risen from 2.83% at its low in 2020-21 to 6.99% on May 9, 2023 (Fig. 3). As a result, the S&P 500 Home Improvement Retail stock price index fell 23.5% in 2022, and the S&P 500 Homebuilding index lost 20.2%.
Let’s take a look at possible drivers of the divergent performances this year and whether the Home Improvement Retail index’s returns can play catch up:
(1) Earnings bounce a bit. Both the S&P 500 Homebuilding and the S&P 500 Home Improvement Retail industries saw the collective revenue and earnings of their component companies drop this year. But next year, the Home Improvement Retail industry’s earnings are expected to grow a touch faster than the Homebuilding industry’s earnings.
Revenue for the S&P 500 Homebuilding industry is expected to fall 8.2% this year and 0.7% in 2024, and revenue in the Home Improvement Retail industry is expected to drop this year by 3.5% and inch up 2.7% in 2024 (Fig. 4 and Fig. 5).
Meanwhile, earnings are forecast to fall 28.4% this year in the Homebuilding industry and drop 3.9% in the Home Improvement Retail Industry. Next year, the Homebuilding industry’s earnings are forecast to rise 2.2%, which is less than the 6.6% increase expected for the S&P 500 Home Improvement Retail industry’s earnings (Fig. 6 and Fig. 7).
One possible contributor to the two indexes’ ytd price performance divergence is that net earnings revisions for the S&P 500 Homebuilding was positive in April for the first time in 10 months, while net earnings revisions for the Home Improvement Retail industry has been decidedly negative for the last six months (Fig. 8 and Fig. 9).
(2) Different competitive trends. In the market for new homes, we could argue that the competition has decreased because there are fewer existing homes on the market. Existing homeowners are stuck in their homes if they want to hold onto their low-cost mortgages. However, demand to purchase homes remains strong because there is always a new batch of 30-somethings looking to buy their first homes.
In March, sales of newly built, single-family homes increased 9.6% m/m to 683,000 (saar) but fell 3.4% y/y. A lack of existing home inventory helped the market, while a lack of electrical transformer equipment and building material price volatility hurt it, according to an April 25 press release citing Alicia Huey, chairman of the National Association of Home Builders. Mortgage rates also fell slightly during the month, from near 6.7% at the beginning of March to 6.3% at month-end. Inventory in the new home market is elevated at 7.6 months’ supply, compared to the 2.6 months’ supply in the much larger existing home market.
The S&P Home Improvement Retail industry includes Home Depot and Lowe’s, big-box retailers that have dominated the industry for years. But more recently, they’ve faced increasing competition from Tractor Supply, Floor & Décor, and Amazon.
Floor & Décor shares are up 31.7% ytd through Tuesday’s close, and Tractor Supply shares have risen 7.4% over the same period, outperforming the 4.0% ytd gain in Lowe’s shares and the 8.0% ytd decline at Home Depot. Floor & Décor and Tractor Supply are still expanding their store base rapidly, with Floor & Décor opening 31 stores to bring its store count to 191 in 2022 and Tractor Supply opening 63 stores last year, bringing its store base to 2,066 stores. Meanwhile, Home Depot increased its store count in the US, Canada, and Mexico by five to 2,322 and Lowe’s increased its store count by one to 1,738.
A growing store base is no guarantee of increasing profits or a rising stock price, but it doesn’t hurt. And the lackluster ytd performance by the S&P 500 Home Improvement Retail industry is less likely a reflection of the broader economy and more likely a reflection of Lowe’s and Home Depot’s maturity. But enhancing the industry’s investment appeal at this point is a forward P/E that has fallen to 17.0 from a recent peak of 23.7 in December 2021 (Fig. 10).
Disruptive Technologies: Utilities Tapping into Hydrogen. Searching for a way to reduce their carbon footprint, utilities are experimenting with using hydrogen to generate electricity.
A case in point: Plug Power has entered a $747 million joint venture with Korea’s SK E&S to build a hydrogen “gigafactory” and research center in South Korea. The factory will produce hydrogen fuel cells for vehicles and water electrolysis platforms for power generation, a May 2 Energy News article reported. The joint venture also plans to build liquefied hydrogen stations across South Korea.
Here’s how Plug Power described its plans in its May 9 earnings press release: “Our largest market opportunity is in utility-scale grid support, and we are expanding our business with utilities interested in this solution. We have long-term plans to use stationary units as both prime power and peaker plants. The anticipated rapid growth of global green hydrogen production would allow for the quick integration of fuel cell stationary power into the global prime and peak power market. Through our partnership with SK Group, SK Plug Hyverse, we plan to deploy 200MW or more per year of stationary products in South Korea for this purpose.”
In last Thursday’s Morning Briefing, we noted that NextEra, the parent of Florida Power & Light, plans to replace almost all of the utility’s natural-gas-fired plants with electricity produced using green hydrogen. In February, the Los Angeles City Council unanimously voted to overhaul the city’s largest natural gas-powered electricity plant so it can use at least 30% green hydrogen as fuel, with a goal of ultimately using 100% hydrogen instead of natural gas. Utilities in Massachusetts are looking to replace 20% of the natural gas they use with green hydrogen. And in Minnesota, CenterPoint Energy has been blending green hydrogen into its natural gas pipeline system.
Utility-scale hydrogen use is definitely an emerging area to watch.
Inflation During & After The Pandemic
May 10 (Wednesday)
Check out the accompanying pdf and chart collection.
Executive Summary: The inflation problem of recent years has proven to be transitory for consumer goods but persistent for consumer services. Even so, overall inflation has been moderating this year. In our soft-landing economic scenario (60% odds), we see the PCED rate falling into the 3.0%-4.0% range over the remainder of 2023 and below 3.0% in 2024 and 2025. Consumers’ inflation expectations aren’t so sanguine. In advance of this week’s inflation reports, we review recent developments on the inflation front. … Also: Wage inflation has been moderating too, but it’s still higher than Fed Chair Powell would like to see.
US Inflation I: Here Is What Has Happened So Far. This is a big week for April’s inflation news. On Monday, the Federal Reserve Bank of New York released its survey of consumers’ inflationary expectations. On Wednesday, we will get the CPI, followed by the PPI on Thursday.
The bad news is that consumers are expecting inflation of 4.5% over the next 12 months (Fig. 1). However, that’s down from a peak of 6.8% during June 2022. More encouraging is that consumers expect that the annual inflation rate over the next three years will average 2.9%, down from a peak of 4.2% during 2021.
The latest reading for the three-years ahead series is in line with pre-pandemic readings. Prior to the pandemic, the one-year ahead and three-years ahead expectations tended to track each other closely. Fed officials should be pleased with the three-years expectations but undoubtedly would like to see the one-year expectation also around 2.5%-3.0%, which was the pre-pandemic range for both series.
Inflation has turned out to be both transitory for consumer goods and persistent for consumer services. About a year ago, in the April 19 Morning Briefing, Debbie and I wrote:
“History shows that the inflation genie is hard to stuff back in the bottle without a recession first slimming the scoundrel down. Fed officials hope to achieve a Goldilocks soft landing by raising interest rates to cool off the demand side of the economy just enough so that the supply side of the economy isn’t forced to cut back production and employment. They must also be counting on some improvements in the supply-chain problem.
“We think they might succeed. In our scenario, the PCED headline inflation rate peaks during H1-2022 between 6.0%-7.0%. Led by consumer durable goods prices, it moderates to 4.0%-5.0% during H2-2022. Next year, it falls to 3.0%-4.0% as persistently rising rent inflation offsets moderation in other consumer prices.”
It took a bit longer than we expected, but the PCED headline inflation rate fell into the 4.0%-5.0% range during the first three months of this year and is still on track to fall to the 3.0%-4.0% range over the remainder of this year (Fig. 2). We think that this inflation rate could fall below 3.0% in 2024 and 2025. And this should all happen with the economy executing a soft landing, which is our 60% probability scenario, rather than a hard one. In our 40% probability hard-landing scenario, inflation remains persistent, forcing the Fed to raise interest rates until they cause a credit crunch and a recession.
Let’s review some of the recent developments on the inflation front:
(1) Durable goods inflation. The jump in the inflation rates for durable goods on both a CPI and a PCED basis has turned out to be relatively transitory after all (Fig. 3). The CPI durable goods inflation rate jumped from -0.6% y/y during March 2020, the first month of the two-months-long lockdown, to peak at 18.7% during February 2022. In March of this year, it was back down to -1.0%.
During the lockdowns, we all suffered from cabin fever. As the lockdowns were lifted, Americans found that shopping for housing-related goods was one way to cure the fever. Since we were spending more time at home, we wanted to spend more on renovations, furniture, appliances, and decorations. The CPI prices of furniture and bedding soared 19.8% from March 2020 through March 2022. Over that same period, the CPI prices of major appliances jumped 28.7% (Fig. 4).
The pandemic disrupted global supply chains. The Federal Reserve Bank of New York compiles a monthly Global Supply Chain Pressure Index (Fig. 5). It rose rapidly from 0.10 standard deviations from average value during October 2020 to peak at 4.32 during December 2021. It fell just below zero during February of this year and was down to -1.32 during April.
Automakers faced shortages of parts because of the pandemic’s impact on the auto industry’s global supply chains. The shortage of inventories caused new car prices to increase 14.2% from March 2020 through March 2022. Over this same period, used car prices soared 48.0%. To avoid public transportation, many Americans scrambled to buy cars. In addition, many households that moved from urban to suburban and rural areas required a car to get around.
(2) Durable goods disinflation. Consumers’ post-lockdown buying binge was fueled by excess savings accumulated during the lockdowns and attributable to the helicopter money provided by the federal government through three rounds of pandemic relief checks. The binge was focused on purchasing goods since many services were still constrained by social distancing restrictions.
On an inflation-adjusted basis, real consumption of goods jumped 22.0% from March 2020 to peak at a record-high $5.8 trillion (saar) during March 2021 (Fig. 6). Over the same period, real consumption of services rose 6.1%. It didn’t make a new record high until January 2023. But it has continued to rise in record-high territory as demand for goods stalled. The buying binge for goods was mostly attributable to durable goods while it lasted (Fig. 7).
The buying binge for goods depleted the inventories of goods producers, importers, and providers during H1-2020 as Americans scrambled to hoard household products (Fig. 8). During H2-2020, there was modest inventory rebuilding. But during the first three quarters of 2021, demand outpaced production and imports of goods, resulting in lots of inventory liquidation.
In response to the buying binge and the shortage of inventories, goods industries ramped up their new orders to restock. The result was a big backlog of orders that couldn’t be filled fast enough or couldn’t be delivered on time because of the shortage of trucking capacity and logjammed West Coast ports. So inflation continued to soar in response to the apparent shortages of goods.
But just as the supply-chain problems abated, consumers pivoted to buying services rather than goods. Inventories rose dramatically from Q4-2021 through Q4-2022. Increasingly, these represented unintended accumulations that forced the goods industries, especially the durable goods industries, to cut their prices and to reduce their orders for more goods. As a result, inventory investment showed a slight liquidation during Q1-2023.
This set of inventory circumstances differs considerably from that of the previous two recessions (Fig. 9). During those two periods, inventory liquidation occurred, and did so for both manufacturers and distributors. This time, manufacturing inventories have declined since the lockdowns for the most part with the exception of a big jump at the end of last year. The big pile-up in inventories from late 2021 through 2022 occurred among wholesalers and retailers.
(3) Nondurable goods inflation and disinflation. The CPI nondurable goods inflation rate on a y/y basis peaked at 16.2% during June 2022 (Fig. 10). It fell to 2.8% during March. Leading the way up and down were food and energy prices, which were inflated during the first half of last year by Russia’s invasion of Ukraine. Food inflation has been more persistent than energy inflation, but the former is moderating rapidly now, with the three-month annualized rate down to 3.6% through March.
Helping to moderate food inflation is disinflation in the PPI for truck transportation (Fig. 11). It peaked at a record-high 25.9% y/y last March. It was down to -5.1% during March of this year. As we reviewed yesterday, employment in the trucking industry rose to a record high during April.
(4) Pesky and persistent services inflation. As we anticipated last April, the CPI services inflation rate has been much more persistently high than the inflation rates for durable and nondurable goods. That’s largely because of the way rent inflation is measured to reflect all currently outstanding rental rates. Rent inflation for new leases has been coming down quickly since early last year (Fig. 12). The Apartment List rent inflation rate on a y/y basis peaked at 18.1% during December 2021. It was down to 1.7% in April.
During the pandemic, many landlords faced state-mandated moratoriums on raising rents and even collecting them. As these restrictions were lifted, landlords increased rents dramatically in 2021. However, this shockwave from the pandemic has been dissipating.
The CPI rent inflation measures are starting to reflect the drop in new leases (Fig. 13). The three-month annualized CPI rent of primary residence fell to 8.0% during March, the lowest rate since June 2022.
Fed officials have acknowledged that the CPI rent inflation measure has some serious drawbacks. However, they’ve countered that inflation in core services excluding housing has also remained persistently high around 4.0%-5.0% for the past year based on the PCED measure of inflation (Fig. 14).
US Inflation II: Wage Inflation Remains an Issue. Fed officials are monitoring not only price inflation but also wage inflation. In his May 3 presser, Fed Chair Jerome Powell said, “Wage increases have been moving down, and that’s a good sign, down to a more sustainable level.” He opined that might continue while still “avoiding a recession.” Alternatively, “It’s possible that we will have what I hope would be a mild recession.”
Powell’s simple arithmetical model is that wage inflation should equal price inflation plus productivity growth. He explained that 3% wage increases would be consistent with 2% price inflation, assuming productivity is growing 1%. He said that wage inflation is currently around 5%, and he would like to see it come down to 3%, assuming as he does that the Fed will succeed in lowering price inflation to 2%.
Powell said that the Fed monitors several measures of wage inflation, particularly the Employment Cost Index (ECI), average hourly earnings, average hourly earnings (AHE), the Atlanta Fed’s Wage Growth Tracker (WGT), and hourly compensation (HC) in the quarterly productivity report. Where are they now? Consider the following:
(1) During April, AHE was up 5.0% y/y, while the WGT rose 6.4% in March (Fig. 15).
(2) The wages and salaries component of the ECI was up 5.1% y/y through Q1. Over the same period, HC was up 4.8% (Fig. 16).
Jobs Driving The Economy
May 09 (Tuesday)
Check out the accompanying pdf and chart collection.
Executive Summary: It’s tough to believe that a recession is imminent with the Coincident Economic Indicators index as strong as ever. The CEI’s payroll employment component hit a record high in April, suggesting that the other three (yet-to-be-reported) components did too. Admittedly, the Leading Economic Indicators hasn’t been strong; its weakness purportedly indicates a coming downturn in the CEI and real GDP. But look at its ten components: Services are noticeably absent. So the LEI is not as trusty a recession bellwether as the CEI, in our view. … Also: Joe Feshbach’s insights on the stock market from a trader’s perspective.
Weekly Webcast. If you missed Monday’s live webcast, you can view a replay here.
US Economy: The Key Coincident Indicator. The US labor market continues to provide stronger-than-expected gains in payroll employment, which rose by 253,000 during April to a new record high of 155.7 million. Payroll employment is one of the four components of the Index of Coincident Economic Indicators (CEI). The others are real personal income less transfer payments, real manufacturing and trade sales, and industrial production (Fig. 1). Debbie and I consider payroll employment to be the most important of the four. That’s because it is the first reported one and provides lots of clues about the other three. Consider the following:
(1) Payroll employment. Like the other three CEI components, payroll employment tends to peak when the business cycle peaks. But it shows no signs of doing so, as we discussed in yesterday’s Morning Briefing.
It’s hard for us to work up much concern about an impending recession while payroll employment is rising to new record highs. That’s because April’s record-high payroll employment strongly suggests that the other CEI components rose to record highs in April too, and the overall CEI is the best monthly coincident economic indicator of the business cycle there is. Its peaks and troughs occur at the same time as the peaks and troughs in the business cycle (Fig. 2). So an imminent recession is hardly a worry when the CEI is rising to new record highs!
(2) Real personal income less transfer payments. When the employment report is released, usually on the first Friday of each month, we multiply it by the average workweek to get total hours worked in billions; then we multiply the product of those two variables by average hourly earnings. The result is our Earned Income Proxy (EIP) for private wages and salaries in personal income, which is highly correlated with—and accounts for 78% of—private wages and salaries (Fig. 3). The difference between the two is attributable to salaries.
Actual private wages and salaries accounts for 54% of personal income less transfer payments (Fig. 4). In other words, our EIP provides a useful advance reading on personal income less transfer payments. The former rose to a record high in April, suggesting that the latter did the same.
Personal income is reported near the end of each month, about a week after the Conference Board releases its report on the CEI and the Index of Leading Economic Indicators (LEI). So the Conference Board uses an estimate of personal income, which undoubtedly is based on its calculation of the EIP and the other components of personal income less transfer payments, as well as on the PCED price measure used to deflate this CEI component.
(3) Real manufacturing and trade sales. The retail sales report is released a couple of days before the Conference Board calculates the CEI for the previous month. Released at the same time as retail sales is manufacturing and trade sales but with a lag of one month (Fig. 5 and Fig. 6). So this component of the CEI is also estimated by the Conference Board. Again, payroll employment and our EIP provide some insight into retail sales since wages and salaries is the main driver of personal income and consumers’ purchasing power (Fig. 7).
(4) Industrial production. Industrial production is usually released the same day as retail sales. Once again, we can get an advance estimate from the employment report’s aggregate weekly hours index for manufacturing (Fig. 8). The manufacturing hours index peaked during September and October 2022 and has been flat since then through April, when it edged up 0.1%.
(5) Bottom line. So far, there isn’t even a hint of a recession in the CEI. During March, it was up 1.8% y/y (Fig. 9). It tracks the comparable growth rate of real GDP, which was 1.6% during Q1-2023.
Yes, but what about the LEI? It peaked at a record high during December 2021, falling 8.0% through March (Fig. 10). On a y/y basis, it was down 7.8% through March (Fig. 11). Doesn’t that indicate that a sharp downturn in the CEI and real GDP is imminent?
The LEI includes 10 economic indicators. The three financial components are the leading credit index, the S&P 500, and the interest spread between the 10-year Treasury bond yield and the federal funds rate.
The seven nonfinancial components are initial unemployment claims, consumer expectations, house building permits, the ISM index of new manufacturing orders, average weekly hours in manufacturing, manufacturers’ nondefense capital goods orders (estimated), and manufacturers’ new orders for consumer goods & materials (estimated). The Conference Board also adds a “trend adjustment factor.”
Notice that four of the nonfinancial indicators are related to manufacturing. In the past, manufacturing was among the most cyclical economic sectors. The consumer is represented by three of the nonfinancial indicators. Like manufacturing, housing is also a very cyclical sector of the economy. Notably absent are any variables for services.
This explains why the LEI on a y/y basis is better correlated with the y/y growth rate in real GDP for goods rather than real GDP for goods and services (Fig. 12).
Strategy: Trader’s Corner. Here is Joe Feshbach’s latest thoughts on the market from a trading perspective:
“The market is still sending a bunch of mixed signals, which argues in favor of the continuation of the large trading range but with some unfinished business on the upside for the short term. As I mentioned last week, as I sit here staring at the Nasdaq Composite chart, it’s really hard to see how this index does not take out its prior intraday high of 12269.55. Typically, there’s some follow-through in the ballpark of around 2%.
“While the Put/Call Ratio most definitely improved on last week’s early setback and supports new current rally highs, there are too many warning signs for me to get too excited. Important rallies typically prefer broad participation, and this rally has been accompanied by way too much narrow breadth. Amazingly, the cumulative Advance/Decline Line for Nasdaq was just making new lows this past week. And by the way, AAPL and MSFT now account for 14% of the S&P 500 weighting.
“Furthermore, most of the known large-cap tech stocks have already rallied significantly and are now witnessing very good earnings news. As I mentioned last week, this is more of an 8th inning development rather than a 3rd inning occurrence. Therefore, as this current phase of the rally finishes off, I still expect the market to fall back into its larger trading range.”
Pandemic Of Pessimism
May 08 (Monday)
Check out the accompanying pdf and chart collection.
Executive Summary: The stock market has been climbing since mid-October even though pessimism has prevailed among economists and stock market strategists. Today, we examine this “pandemic of pessimism”—how widespread it is, our perspective on the bearish case, what the Fed’s staff thinks is ahead for the US economy, and a few of the voices of doom. … We counter that the stock market’s trend is driven mostly by the earnings trend; we doubt QT will send either southward. Earnings growth may be weak in our rolling recession forecast, but growth it will be nonetheless. The labor market’s remarkable resilience reflects the economy’s resilience.
YRI Weekly Webcast. Join Dr. Ed’s live webcast with Q&A on Mondays at 11 a.m. EST. You will receive an email with the link one hour before showtime. Replays of the weekly webcasts are available here.
Strategy: The Wall Street of Worry. Investopedia observes: “Climbing the wall of worry [WOW] is a reference to investor behavior during bull markets, at the end of major bear periods, or general periods of market gains. The phrase refers to the market’s ability to show resilience in the face of economic or corporate news that might otherwise spark a selloff, and instead keep pushing securities higher. The wall of worry is sometimes one event the market must keep climbing in spite of but is more often a confluence of events the market must look beyond.”
That describes the stock market’s rally since October 12, 2022. The S&P 500 is up 15.6% since then through Friday’s close. Consider the following developments during the latest “pandemic of pessimism” (“POP”), which we think better describes the current situation than “WOW”:
(1) Philly Fed survey. The Philly Fed’s Survey of Professional Forecasters, which started in Q4-1968, includes the “Anxious Index,” which is the probability of a decline in real GDP (Fig. 1). The survey asks panelists to estimate the probability that real GDP will decline in the quarter in which the survey is taken and in each of the following four quarters. The Anxious Index shows the probability of a decline in real GDP in the quarter after a survey is taken.
For example, the survey taken in Q4-2022 yielded an Anxious Index reading of 47.2%, which means that forecasters believed there was a 47.2% chance that real GDP would decline in Q1-2023. That reading is the highest since Q2-2009. The probability they saw of a recession over the next four quarters was 43.5%, the highest on record (Fig. 2).
In the Q1 survey (dated February 10, 2023), the 37 forecasters revised downward the chance of a contraction in real GDP in any of the next four quarters. For the current quarter, the forecasters predict a 42.4% chance of negative growth, down from 47.2% in the previous survey. The forecasters’ probability estimate for the following three quarters was also revised downward, to 31.8%.
(2) WSJ survey. The Wall Street Journal released its latest quarterly survey of economists on April 15. On average, the survey of 62 forecasters saw the same probability of a recession at some point over the next 12 months as they did in January, 61%. They saw the contraction as likely to begin during Q3, later than the Q2 consensus of January’s survey.
Among respondents, 76% said there would be no soft landing compared with 75% in January. Nevertheless, most of the business, academic, and financial economists who responded to the Journal’s survey didn’t see banking turmoil as contributing to the recession threat. Among them, 58% said a crisis had been largely averted, while 42% predicted more trouble ahead.
(3) Strategists. Bloomberg’s Lu Wang wrote a December 1, 2022 article titled “Wall Street Turns Bearish on Stocks After Bad Year.” She reported: “The average forecast of handicappers tracked by Bloomberg calls for a decline in the S&P 500 next year, the first time the aggregate prediction has been negative since at least 1999. Most of them turned progressively more dour as the worst year in the market since the financial crisis moved toward its end.”
Lu also observed: “In almost a century of historic data, two straight years of losses or more only occurred on four separate occasions, with the latest episode coming during the bursting of the dot-com bubble.” Furthermore, during those four episodes, the drop during the second consecutive down year was greater than the one during the first (Fig. 3).
A March survey of Wall Street strategists conducted by Bank of America found that collectively they were more bearish on stocks than at any point since the Great Financial Crisis in 2008 and 2009! The April survey found that recommended equity allocations by Wall Street strategists stood at just 52.7% in April, which represents the lowest level in six years.
(4) Fed’s staff. For the first time since officials began lifting rates a year ago, Fed staff in March forecasted that the banking-sector turmoil would cause a recession later this year, according to the minutes of the March 21-22 FOMC meeting: “For some time, the forecast for the U.S. economy prepared by the staff had featured subdued real GDP growth for this year and some softening in the labor market. Given their assessment of the potential economic effects of the recent banking-sector developments, the staff’s projection at the time of the March meeting included a mild recession starting later this year, with a recovery over the subsequent two years.”
(5) Two bearish charts. To support their pessimistic outlook, bearish prognosticators tend to focus on two charts. The first one shows the S&P 500 versus the securities held by the Fed, which account for most of the Fed’s balance sheet (Fig. 4). They contend that the bull market in stocks from 2009 through 2021 was driven by the Fed’s various quantitative easing programs. The S&P 500 peaked at a record high on January 3, 2022 as investors started to anticipate quantitative tightening (QT), which started during June of that year. The Fed remains on its QT course, which suggests to these bears that the rally since October 12, 2022 is a rally within a bear market.
We think that the stock market’s trend is driven mostly by the trend in earnings. We doubt that QT will cause either an economic or an earnings recession, let alone both. In our “rolling recession” scenario, earnings growth may be weak, but it should be positive.
Another current favorite chart of the permabears is the y/y growth of M2 (Fig. 5). M2 was down 4.1% y/y during March, the lowest growth rate on record, they point out. But that followed a record-high growth rate of 26.9% during February 2021. We estimate that M2 is still about $1 trillion to $2 trillion above its pre-pandemic trend line (Fig. 6). The same can be said about all deposits at commercial banks. We reckon that demand deposits is more than $3 trillion above its comparable trendline.
(6) Usual suspects. In an April 10 Fox Business interview, investment strategist Nouriel Roubini said: “I think the problems are with the regionals, but the regional banks are significant lenders to households for mortgages, for small businesses, for SMEs, for commercial real estate. And therefore, we’re going to have a credit crunch.”
Roubini added, “That credit crunch is going to make the likelihood of a recession, a hard landing, much greater than before. So we’re facing a serious credit crunch for a good chunk of the U.S. banking system.”
David Rosenberg was the opening keynote speaker at John Mauldin’s Strategic Investment Conference (SIC) on May 3. The odds of a “hard” recession are 99%, according to Rosenberg, and it will start in the second quarter. Indeed, he said, it may already have started. “There is a 1% probability of a soft landing,” he said. Repeating his prediction from last year, Rosenberg said the recession will cause earnings and multiple contractions that will drive equity prices down 30%. We are heading into a “meat grinder, volatile” market that will be sprinkled with bear-market rallies, he said. Rosenberg and I will be featured at an SIC bull-versus-bear debate on Monday.
On Thursday, Morgan Stanley’s Chief Investment Officer Mike Wilson pointed out that a recession is looming in the second half of the year. Wilson, who has been noted for his bearish outlook in recent years, went on to say, “Bottom line, stock selection and industry group selection becomes increasingly important late in the cycle. We continue to prefer traditional defensive sectors on a relative basis as well as single stocks with stable earnings profiles and high operational efficiency.”
US Labor Market: Recession Proof? The labor market won’t give the hard-landers a break. Friday’s employment report for April belies their recession forecast. It’s hard to have a recession with jobs continuing to expand at a solid pace and wages outpacing prices, resulting in real wage gains.
Debbie and I are Baby Boomers. So we have a unique insight (along with 75 million other Baby Boomers) into how we are fueling the demand for labor. We are going out to restaurants and traveling more often. So the restaurants, hotels, and airlines need more staff. We are using health care services more often. So the health care system needs more workers. We are ordering more online and using ridesharing services. So the demand for truck drivers and warehouse personnel is strong. Let’s see if the data support our hypothesis:
(1) Unemployment and participation. In his press conference on Wednesday, May 3, Fed Chair Jerome Powell observed: “It’s interesting [that] we’ve raised rates by 5 percentage points in 14 months, and the unemployment rate is 3½% pretty much where it was, even lower than where it was, when we started.” On Friday, we learned that the unemployment rate fell to 3.4%, matching its lowest rate since May 1969 (Fig. 7). The jobless rate for adults was 3.2%, and for teens the rate dropped to a record low of 9.2%. The short-term and long-term unemployment rates were just 2.7% and 0.7% in April (Fig. 8).
The labor force participation rate remained at 62.6% in April, below the pre-pandemic reading of 63.3% on February 2020 (Fig. 9). The labor force participation rate for 25- to 54-year-olds rose to 83.3% in April, the highest since March 2008 (Fig. 10).
(2) Employment. During the first four months of this year, payroll employment (which counts the number of jobs) rose 1.1 million to a record 155.7 million (Fig. 11). Over the same period, household employment (which counts the number of workers) rose 1.8 million to a record 161.0 million. The number of workers with full-time jobs rose sharply in recent months to a record high of 134.5 million (Fig. 12). That’s 3.7 million above the pre-pandemic level during February 2020.
(3) Earned Income Proxy. Our Earned Income Proxy (EIP) for private wages and salaries in personal income rose 0.7% m/m during April to a new record high (Fig. 13). Payroll employment rose 0.2%, the average workweek was unchanged, and average hourly earnings rose 0.5%. This augurs well for April’s retail sales and consumer spending reports.
(4) Industries. During April, nonfarm payrolls increased 253,000 m/m and 4.0 million y/y. Here are the m/m and y/y increases for selected industries in thousands sorted by the y/y increases: health care and social assistance (64.2, 862.1), accommodation and food services & drinking places (25.0, 741.8), professional and business services (43.0, 524.0), government (23.0, 469.0), manufacturing (11.0, 223.0), construction (15.0, 205.0), transportation & warehousing (10.6, 121.4), wholesale trade (-2.2, 100.4), finance (23.0, 88.0), and retail trade (7.7, 31.7).
As noted above, demand for certain services undoubtedly has been boosted by the needs of the aging Baby Boomers. The biggest question facing many of them during retirement is how much to splurge on themselves versus leaving for the kids.
We also note that there’s virtually no sign of a recession in the latest employment indicators. Notwithstanding the recession in the single-family housing market, construction employment rose to a record high in April (Fig. 14). Notwithstanding the recession in the goods producing and providing industries, truck transportation employment rose to a record high in April (Fig. 15). Retail trade employment has stalled during the past year around its pre-pandemic level, but wholesale trade employment is at a record high (Fig. 16 and Fig. 17).
(5) Real wages. Average hourly earnings (AHE) has mostly stagnated for the past 33 months through March (Fig. 18). However, over the past five months, AHE has been increasing at a faster pace than the PCED. That, along with solid employment gains, is boosting the purchasing power of consumers.
Semis, Onshoring Boom & Hydrogen
May 04 (Thursday)
Check out the accompanying pdf and chart collection.
Executive Summary: The semiconductor industry is breaking out into the light at the end of its tunnel. Its stocks are up, its CEOs are optimistic, and worldwide semiconductor sales are starting to improve. AMD’s CEO sees big opportunity in the rapid pace of AI adoption. … Also: Jackie highlights some of the many new ventures manufacturers are planning to capitalize on trillions of dollars in government incentives. Their projects may be enough to stave off a recession. … And our Disruptive Technologies segment looks at the government-incentivized green hydrogen opportunity.
Semiconductors: Anticipating Recovery. The S&P 500 Semiconductors industry stock price index is the second-best performer of all 126 S&P 500 industries measured ytd through Tuesday’s close, posting a 33.9% gain compared to the S&P 500’s 7.3% (Fig. 1). The industry has had a tough year or so, with semiconductor shipments and sales falling sharply. But corporate executives seem optimistic about H2-2023; and for the first time in nearly a year, shipments in March rose on a month-over-month basis.
Here’s a look at some industry data and the Q1 earnings report of one of the industry’s leading competitors, Advanced Micro Devices (AMD):
(1) Signs of life. While worldwide sales of semiconductors continued to fall on a y/y basis during March, they edged higher on a m/m basis for the first time in almost a year, by 0.3% (based on the three-month moving average), according to a May 1 Semiconductor Industry Association press release. Here’s how the m/m sales comparisons stacked up in each of the regions tracked: Europe (2.7%), Asia Pacific/all other (2.6), China (1.2), Japan (-1.1), and Americas (-3.5).
Worldwide sales fell 21.3% y/y during March, based on the three-month average. Semiconductor sales peaked at $51.7 billion in May 2022 and have fallen 23.0% since to $39.8 billion. Here’s how y/y sales fared by region: China (-34.1%), Asia Pacific/all other (-22.2), Americas (-16.4), Japan (-1.4), and Europe (-0.6) (Fig. 2).
Analysts have grown more optimistic about the industry’s earnings next year. Revenue is expected to fall 10.3% this year, and earnings are expected to plummet 24.2%. But a recovery in 2024 is expected to boost the industry’s revenue by 14.0% and its earnings by 35.5% (Fig. 3 and Fig. 4). The projected earnings growth rate for 2024 has been climbing sharply for the past six months; so has the industry’s forward P/E, which stands at 23.9, up from its low of 13.7 last year (Fig. 5).
(2) AMD looks to H2. Investors expected Q1 earnings to fall sharply, and they did. Revenue fell 9.1% to $5.4 billion, and adjusted earnings per share tumbled 46.9% to 60 cents. On the earnings conference call, CEO Lisa Su noted that AMD has been shipping fewer chips than are needed in order to reduce “downstream inventory” and may continue to do so in Q2. But by H2-2023, inventories should be in better shape and AMD’s shipments should be closer to consumption.
AMD shares fell 9.2% Wednesday after the company’s Q2 forecast disappointed investors. The company forecasted Q2 revenue of roughly $5.3 billion, but investors expected $5.5 billion of Q2 revenue, down from Q2-2022 sales of $6.6 billion, a May 3 Investor’s Business Daily article reported. Su noted that Q2 sales would be relatively flat q/q and warned that Q2 chip demand for servers could remain mixed.
Su didn’t provide full-year guidance but noted that data center demand could be up y/y by a double-digit percentage in 2023, which implies very strong growth in the back half of the year. The company is “well positioned to grow our cloud and enterprise footprint in the second half of the year” based upon customer response to some of the company’s new offerings. Su also expects improvement in enterprise and China 2H.
(3) AI is a hot topic. Su noted that customer interest had “increased significantly” in the company’s chips used for AI training and inference of large language models. AMD has brought together AI teams from across the company into a single unit to “accelerate” this part of its business.
“We are in the very early stages of the AI computing era, and the rate of adoption and growth is faster than any other technology in recent history. And as the recent interest in generative AI highlights, bringing the benefits of large language models and other AI capabilities to cloud, edge, and endpoints requires significant increases in computer performance,” said Su. “This is our No. 1 strategic priority.”
Industrials: The Carrot Worked. Manufacturers, large and small, domestic and foreign, are tapping into the trillions of dollars of incentives available in the CHIPS and Science Act, the Inflation Reduction Act (IRA), and the Infrastructure Investment and Jobs Act to build factories in the US. They plan to make semiconductors, batteries, solar equipment, electric vehicles (EVs), and green hydrogen, among other things. So many manufacturers have locked down locations for new plants that it’s now hard to find shovel-ready “megasites,” an April 13 Reuters article reported.
If the US manages to skirt a recession, it will be due in good part to the massive capital spending and building related to these plants. As we’ve noted before, capital spending in real GDP rose to a record high of $3 trillion (saar) during Q1-2023, and manufacturing construction put in place jumped 62.3% y/y through March to its latest record high of $147.4 billion. Many of the proposed factories have yet to break ground and are not reflected in these numbers. Assuming that the projects go forward, building and then operating these facilities should provide an economic tailwind.
Below, we highlight just some of the new capacity planned for producing batteries, semiconductors, and solar energy:
(1) Lots of batteries. For EVs to gain ubiquity, car manufacturers are going to need a lot of batteries. Batteries are also used in home solar systems to store extra electricity, and utilities are exploring how batteries can be used to solve the intermittency problem that comes with solar and wind power.
“Since the landmark Inflation Reduction Act passed in August, auto makers and battery companies have announced $11 billion in new investments into the North American EV battery supply chain,” a January 5 article in PV Magazine reported. Most of the plants are scheduled to begin production between 2025-30; collectively, they may increase North America’s EV battery manufacturing capacity 19-fold, to 1,000 GWh/year by 2030 from 55 in 2021.
Ford Motor plans to build a $3.5 billion EV battery factory in Michigan using technology licensed from Contemporary Amperex Technology Limited, a Chinese company. Ford is also building two battery plants in Kentucky and a third in Tennessee with SK On. “Ford had looked at building the factory in Canada and Mexico but chose a U.S. site after the Inflation Reduction Act was signed into law last year by President Biden. The act provided tax incentives to companies that build battery factories in the United States. Car buyers are also eligible for tax credits for EVs made in North America that include batteries and raw materials from the region or another U.S. trade ally,” a February 13 NYT article reported.
GM started battery production in September at an Ohio battery plant that it owns with LG Energy Solution, and the partners plan two more plants in Tennessee and Michigan. The companies qualified for a $2.5 billion loan from the Department of Energy to help pay for the three plants.
Meanwhile, Stellantis NV is building a $2.5 billion battery plant in Kokomo, Indiana with Samsung SDI. Initially, it will have an annual capacity of 23 GWh, but that could expand to 33 GWh.
Some battery companies are building their plants without partnering with a car manufacturer. LG Energy Solution plans to build a $5.5 billion factory in Phoenix, Arizona to make batteries for EVs and energy storage systems. The company said its decision was driven in part by the IRA. Energy Inc. plans to spend $760 million to build a facility in West Virginia that makes long-duration storage batteries to store renewable energy. Freyr Battery is building a $1.7 billion plant in Georgia. KORE Power is building a two-million-square-foot manufacturing plant to produce 12 GWh of lithium-ion battery cells annually in Buckeye, Arizona. Form Energy aims to build iron-air battery systems in a Weirton, West Virginia plant that’s expected to cost $760 million.
Suppliers are opening up shops near their customers’ large new plants. Soulbrain MI is building a $75 million plant to make high-purity electrolyte for the batteries that will be built nearby in Stellantis’ Kokomo plant, reported a March 22 article on the Inside Indiana Business website. Similarly, Redwood Materials, a battery recycling and components maker run by Tesla co-founder JB Straubel, plans to build a $3.5 billion plant in South Carolina.
(2) Swimming in semis. The CHIPS and Science Act has provided financial incentives for semiconductor manufacturers to build their plants in the US of A. More than 50 new semiconductor ecosystem projects, involving $210 billion of private funding, have been announced since the legislation was enacted. That figure includes new fabs, expanding existing sites, and facilities used by suppliers to the industry. They’re expected to create 44,000 new jobs, according to Semiconductor Industry Association data.
Taiwan Semiconductor Manufacturing Company is spending $40 billion to build two semiconductor fabs in Phoenix, Arizona, which are being billed as the largest foreign investments in the US. One is expected to begin production in 2024 and the other in 2026, a January 23 article on Manufacturing Drive’s website reported.
Intel is spending $20 billion on two semi plants in Ohio that are slated to open in 2025 and another $20 billion on two plants in Arizona. Samsung is spending $17 billion to build a five-million-square-meter site in Taylor, Texas, which plans to open next year. Micron Technology’s $20 billion investment to build a new facility in Syracuse, New York could meaningfully bolster that community’s development far beyond the 3,000 jobs the facility is expected to create. Texas Instruments is spending $30 billion on a plant in Sherman, Texas.
(3) Solar & other green projects get a boost. In addition to battery and EV plants, another 34 wind and solar manufacturing plants have been announced, according to a Climate Power report. The IRA contains a 30% tax credit for renewable energy facilities, and the credit can increase if the facilities use domestic materials, if the facilities are in disadvantaged communities, or if they adhere to certain labor standards, an April 24 Reuters article explained. Some manufacturers are looking for additional clarification on the tax credit rules before moving ahead with their projects.
CS Wind plans to expand the largest wind turbine factory in the world in Pueblo, Colorado. QCells is building a $2.5 billion solar panel factory in Georgia. GE has proposed two factories to build offshore wind turbine blades and another windmill component in New York. Kempower is building a $41 million EV charging station manufacturing facility in North Carolina. First Solar is investing $680 million to expand its solar plant, and Invenergy is investing $600 million in a new solar plant in Ohio.
Enel hopes to take advantage of IRA incentives to build its first plant for solar cells outside of Italy, in Oklahoma. CubicPV, which makes silicon wafers used in solar panels, has been looking for a site on which to build a manufacturing plant after the IRA passed last August. Silfab Solar plans to open its third US solar module production facility, which will also manufacture solar cells. The company hopes the new facility, which may be in South Carolina, will be operational in 2024 and produce 1 GW of cells and 1.2 GW of solar panels annually.
Disruptive Technologies: Hydrogen Gets a Boost Too. The IRA also encourages building facilities that will produce green hydrogen, which is hydrogen made using electricity produced from renewable sources like solar or wind power. The Hydrogen Production Tax Credit includes a “10-year federal tax credit of up to $3 per kilogram for clean hydrogen produced after 2022 from facilities that begin construction prior to 2033,” a March 9 Reuters article reported. There’s also $9.5 billion of federal funding available from the Infrastructure Investment and Jobs Act.
Critics say green hydrogen is inefficient because it takes too much energy to make it. Every 10kWh of wind or solar power used in an electrolyzer yields less than 4kWh of electricity. But proponents suggest using the excess solar and wind energy produced in the US Midwest and Southwest at peak hours of the day to solve that problem.
Auto parts maker Cummins has invested $10 million into its Fridley facility to produce hydrogen-based electrolyzers and will receive tax credits for renewable energy from the IRA. The company is also investing $1 billion across its US engine manufacturing network to make fuel-agnostic, low-carbon internal combustion engine platforms for heavy duty trucks, an April 3 company press release reported. They’ll be able to run on natural gas, diesel, and eventually hydrogen.
CF Industries and NextEra Energy Resources entered a joint venture to develop a green hydrogen project in Oklahoma. The facility will include a 100 MW electrolysis plant powered by a renewable energy facility developed by NextEra. CF Industries will buy the hydrogen output and use it to produce up to 100,000 tons per year of zero-carbon green ammonia, an April 24 MarketWatch article reported. The proposed project has applied for funding under the Bipartisan Infrastructure Law, which earmarks $7 billion for the US Department of Energy to develop regional clean hydrogen hubs that demonstrate the production, processing, delivery, storage, and end use of clean hydrogen.
Linde plans to use electrolyzers from Cummins in a proposed Niagara Falls, New York facility that will use hydropower to make green hydrogen by 2025. The company also plans to increase its green hydrogen production in California.
Air Products plans to invest $500 million to build, own, and operate a 35-metric-ton-per-day facility in Massena, New York that will produce and distribute green liquid hydrogen by 2026. The plant will use electricity generated by hydropower. The company is also working with AES to invest about $4 billion to build and operate a green hydrogen facility in Texas powered by wind and solar power. It aims to start operations in 2027 and targets the mobility and industrial markets, a December 8 press release stated.
NextEra, the parent of Florida Power & Light, announced a plan to eliminate all carbon emissions from its business by 2045. In addition to expanding the use of solar power, the company intends to replace almost all of the utility’s natural-gas-fired power plants with electricity produced using green hydrogen, a June 14 company press release states.
NextEra also plans to deliver clean energy solutions to sectors outside of the power industry. And the company plans to build a facility at the Gulf Coast Clean Energy Center to produce 140 tons a day of clean hydrogen and a facility in Arizona to produce 120 tons per day of clean hydrogen.
Capital Spending, Automation & Earnings
May 03 (Wednesday)
Check out the accompanying pdf and chart collection.
Executive Summary: While surveys of business managers’ capital spending plans suggest more spending caution, that could partly reflect all the recession talk recently. Actual capital spending shows no sign of recession; it hit a record high last quarter. … Also: Factory managers are flocking to technological solutions to their many challenges, reports Jackie; Rockwell updates the story. … And: Joe reviews what Q1 results reported to date collectively say about how companies fared last quarter and how results jibe with analysts’ expectations. Notably, analysts haven’t been slashing estimates after hearing managements’ conference calls, as they’ve done in recent quarters.
Industrials I: Capital Spending Surveys Downbeat. Recessions depress capital spending, which worsens the recessions (Fig. 1). Capital spending in real GDP rose to a record high of $3.0 trillion (saar) during Q1-2023. So there is no recession evident in capital spending so far. Various surveys of business managers’ capital spending plans do show that they’re turning more cautious about making large outlays of capital. But that certainly can be explained by all the talk of recession going on these days. If a recession is on the horizon, it will be the most anticipated recession on record!
While it’s possible for us to talk ourselves into a recession, Jackie and I don’t think a broad-based recession is coming partly because ongoing structural labor shortages and onshoring will force businesses to invest in productivity-enhancing technologies and in supply chains that are more homebased. Let’s review the surveys and then the actual data on capital spending:
(1) CEO survey. The Business Roundtable CEO Economic Outlook Index is based on a survey—conducted quarterly since the Q4-2002—of the organization’s members. The CEOs are asked about their plans for hiring and capital spending, as well as their expectations for sales, over the next six months.
The overall Index for Q1-2023 increased slightly by six points from last quarter to 79. The results mark the third consecutive quarter at or below the long-run average of 84 but still above the expansion or contraction threshold of 50. This quarter’s survey was conducted from February 8 through March 8, 2023, before the Silicon Valley Bank crisis. A total of 141 CEOs completed the survey.
The overall index tends to be a good leading indicator of the y/y growth rate of both nominal and real capital spending in GDP (Fig. 2). During Q1, they were up 9.5% and 2.7% respectively, down from their Q2-2021 peaks of 13.2% and 12.5%. We don’t expect to see either one of these series to show negative y/y comparisons over the rest of this year or during 2024.
(2) Regional business surveys. The regional business surveys conducted by five of the 12 Federal Reserve district banks include questions about current and future capital spending. The respondents tend to be skewed toward manufacturing companies. Based on the surveys, Debbie and I have constructed an average of the current capital spending indexes for three of them and a similar average future index for all five (Fig. 3 and Fig. 4).
The current regional capital spending index rose to a cyclical high of 25.8% during December 2021 and fell to 5.3% during April. The future index peaked at 33.8% during July 2021 and fell to 6.5% in April. So both have dropped significantly but remain in positive territory.
(3) Small business survey. The most depressing capital spending survey-based indexes are the ones compiled monthly by the National Federation of Independent Business of its membership of small business owners. During March, only 2% of them agreed that now is a good time to expand (Fig. 5). That’s a record low! However, 20% said that they planned to invest in their businesses over the next three to six months. The low in this series was 14% during March 2009.
Industrials II: Actual Capital Spending Upbeat. As noted above, overall capital spending rose to a record high during Q1-2023. However, there were pockets of weakness that were more than offset by areas of strength:
(1) Prior to the mid-1990s, real capital spending on structures exceeded spending on equipment and on intellectual property (Fig. 6). From then up until the pandemic, equipment investment exceeded the other two series. Then during the pandemic, equipment and intellectual property tracked closely, rising to new record highs. Spending on structures has been essentially flat since the early 1980s.
By the way, intellectual property includes software, research & development (R&D), and entertainment, literary, and artistic originals.
(2) During Q1, equipment investment edged down from Q3-2022’s record high, while spending on structures edged up after mostly falling since the pandemic lockdown, and intellectual property remained at a record high.
(3) Among the strongest categories of capital spending have been information technology equipment, software, and R&D (Fig. 7). They all remain on solid uptrends in record-high territory.
(4) Also showing some signs of life are spending on industrial equipment and manufacturing structures (Fig. 8 and Fig. 9). Both are likely to move higher as manufacturing continues to automate to boost productivity and to bring supply chains onshore to reduce geopolitical risk.
Industrials III: The Factory Renaissance. Factory managers are embracing all manner of technology to improve their businesses and profitability. They’re using technology to overcome labor shortages, minimize supply-chain risks, monitor product quality, harness data, and beef up cybersecurity. That’s what 1,353 global manufacturers told Rockwell Automation in its 8th annual State of Smart Manufacturing report. I asked Jackie to look at some of the report’s findings as well as Rockwell’s fiscal Q2 (ended March 31) earnings, which beat Wall Street analysts’ consensus forecast:
(1) Survey says: Factories going high tech. Manufacturers are facing a wide array of challenges, and they’re hoping to come up with solutions by harnessing technology. Nearly half of the survey respondents, 46%, said they lacked the skilled workforce to outpace the competition over the next 12 months. Many also lack the necessary technology (43%), innovation (39%), speed (38%), ability to use data to make decisions (35%), production capacity or quality (34% and 31%), access to data (30%), and capital (25%). (Respondents picked their top five problems.)
Over the next year, manufacturers plan to invest in the following technologies: cloud technology, applications, and infrastructure (44%), automation (42%), security/cybersecurity management (39%), business and/or manufacturing software (38%), smart/connected tools & equipment (35%), maintenance management (35%), robotic process automation (33%), sales and operations planning (33%), inventory management (32%), and lean manufacturing (30%). (Respondents checked off all areas that applied.)
(2) Rockwell benefits from trends. US companies across a host of industries are breaking ground on new factories as they reshore operations or tap into federal dollars and tax incentives available in many green energy industries. Globally, factories are using technology to solve many of the problems highlighted in the State of Smart Manufacturing report. These positive trends have helped Rockwell’s top and bottom lines.
Rockwell’s fiscal Q2 revenue jumped 25.8% y/y to $2.3 billion, and its adjusted earnings per share jumped 81.3% y/y to $3.01, well above analysts’ consensus $2.58 forecast. Cash flow from operating activities in the quarter doubled y/y to $187 million, and Rockwell increased its guidance for fiscal 2023 (ending September 30).
We’re “seeing across all verticals an increased focus on automation, and that’s due to large durable trends, things like scarcity of trained workforce and so the need to complement people with the technologies and the software and the services that we provide. So … while we continue to pay close attention to macroeconomic conditions, we think the setup for multiyear growth in automation and information is there,” said CEO Blake Moret on the company’s April 27 earnings conference call.
Within Rockwell’s automotive segment, which includes electric vehicles and batteries, sales grew more than 40% y/y, and sales in the semiconductor unit rose by a y/y rate in the mid-teens. The company also saw strong growth in its energy, food and beverage, and its life sciences businesses, but management called out a mid-single-digit y/y sales decline in its e-commerce and warehouse automation divisions.
(3) Strong, but slower second half? Rockwell’s order backlog started this fiscal year at $5.2 billion and had increased to $5.6 billion by the end of fiscal Q2. The backlog is expected to decline to around $5.0 billion by year-end, which the company attributed to the improvement in semiconductor chip supplies as well as its own additional capacity. The additional product will allow lead times to improve as orders and shipments converge.
Rockwell upped its fiscal 2023 sales growth guidance to 12.5%-16.5% from 10.0%-14.0% previously and its adjusted earnings per share forecast to $11.50-$12.20 from $10.70-$11.50. Assuming analysts’ consensus forecasts in the WSJ are on the mark, the company’s earnings will jump from $7.96 a share in fiscal 2022 to $11.82 this fiscal year and $12.84 in fiscal 2024. They’re calling for fiscal Q3 (ending June 30) earnings to grow 18.4%, and fiscal Q4 earnings to jump 9.5%.
Rockwell shares peaked at $350.76 in December 2021, fell to a low of $191.09 in June 2022, and since have rebounded to $282.65 as of Monday’s close.
Earnings: Q1 Halfway Review. The Q1 earnings season has now passed the halfway mark. With 57% of the S&P 500 companies having already released their interim financials through midday Tuesday, the results thus far suggest that the worst of the analysts’ downward estimate revisions cycle is in the rearview mirror.
Cost-cutting has helped companies to easily beat analysts’ forecasts for the Q1 bottom line, but the top-line surprise is not getting better relative to prior quarters, and y/y growth comparisons remain challenged at both lines, top and bottom. The silver lining is that revenues growth isn’t so strong as to imply that inflation remains an underlying problem, as that could lead to a higher-than-expected terminal federal funds rate.
Below, Joe summarizes the Q1 results and their impact on analysts’ forecasts:
(1) Companies still beating estimates. For the 285 companies that have reported thus far, Q1’s revenue beat of 2.1% is an improvement from the 11-quarter low of 0.8% at the same point during the Q4 season (Fig. 10). More impressive has been the earnings surprise of 7.7% so far, which compares to a 14-year low of 1.2% at the same point during Q4 (Fig. 11). The earnings beat is turning up now and on pace to be the strongest since Q3-2021. However, the revenue surprise remains below the average post-economic shutdown rate of 2.9% seen from Q2-2020 to Q4-2022.
For a second straight quarter, it appears that the S&P 500’s Energy sector will not meaningfully skew the revenue and earnings beats of the overall S&P 500 composite index. That implies companies will have less pricing power going forward. During the recovery coming out of the pandemic, many companies passed their higher energy and transportation costs on to their customers, which resulted in a boost to their revenue and earnings growth rates.
(2) Y/Y growth comparisons continue to slow. Revenues growth is continuing to weaken so far in Q1 compared to the double-digit percentage growth readings of 2021-22. For the 285 companies, it’s up just 3.8% y/y, down from 5.2% at the same point during the Q4-2022 season. That’s also the slowest growth rate since Q4-2020. On the other hand, the y/y earnings decline remains relatively moderate and has stabilized. Earnings for the 285 reporters is down just 0.6% y/y compared to a 1.9% decline at the same point in Q4. However, the y/y quarterly earnings growth is trailing revenues growth for a fifth straight quarter. For perspective, this previously happened only seven times in the 43 quarters prior to the pandemic.
(3) Earnings growth still energized, but revenues de-energizing. Energy is having a mixed effect on overall revenues and earnings growth so far. For the S&P 500 companies that have reported to date, the Q1 revenues growth of 3.8% y/y would be 0.8ppt higher without Energy, or 4.6%. However, Energy continues to push the needle on earnings. Among the reporters so far, S&P 500 earnings is down just 0.6% y/y, but without Energy it would be a much worse 2.8%.
(4) A sigh of relief. As companies issue their press releases and 10-Qs, the analysts that follow them look at the financials and consider what management says during the quarterly conference calls. What they’re hearing so far suggests that the profits outlook isn’t getting better. But it isn’t getting worse either.
We had a “whoa” moment when we saw that the S&P 500’s bottom-up forecast for 2023 rose during the April 27 week for a second week in a row (Fig. 12). That prompted a look behind the curtain at analysts’ forecasts for the rest of the year. We found that the gain in the 2023 estimate was attributable only to the amount of the Q1 surprise, not to improving prospects for the remaining three quarters of the year (Fig. 13). While those quarterly estimates are down, the decrease has been very minor compared to the cuts that began following the Q2-2022 earnings season (Fig. 14).
In short, analysts are not embarking on heavy estimate cutting following earnings reports for the first time in three quarters.
Global Economy Here & There
May 02 (Tuesday)
Check out the accompanying pdf and chart collection.
Executive Summary: We’re not among the vocal doom-saying economic prognosticators. We say there’s a 60% chance that the economy will land softly this year and pick up speed next year, fueled by productivity gains. … Also: We update our rolling recession watch, zeroing in on two loan-dependent industries likely to be rolled over next: autos and commercial real estate construction. … And: Melissa examines why inflation is stickier in Europe than in the US and discusses other economic headwinds facing the Eurozone. These headwinds and the Europe MSCI’s current valuation make us less bullish on European stocks than we were last June.
Weekly Webcast. If you missed Monday’s live webcast, you can view a replay here.
US Economy I: Words of Warning. Bad times are coming. Jamie Dimon, the CEO of JP Morgan Chase, has been warning since last summer that American consumers will run out of the excessive saving they accumulated during the pandemic by the second half of this year. So he expects a recession in coming months, though a mild one.
On Sunday, April 30, Elon Musk, the CEO of Tesla and proprietor of Twitter, tweeted: “It is becoming harder for people to get car loans in the US, even when their credit is good. Understandable that banks are slow to extend credit when they’re trying to avoid bankruptcy themselves!”
Also on Sunday, Charlie Munger said trouble is ahead for the US commercial property market, as US banks are packed with “bad loans” that will be vulnerable as “bad times come” and property prices fall. “It’s not nearly as bad as it was in 2008,” the 99-year-old investor told the Financial Times in an interview. “But trouble happens to banking just like trouble happens everywhere else.”
Debbie and I are still assigning a 60% subjective probability to a soft-landing scenario and the remaining 40% to a hard-landing one for the rest of this year. We had predicted a 1.0% (saar) increase in real GDP for Q1-2023 (Fig. 1). It came in at 1.1%. That’s a preliminary number that will be revised a couple of times. In any event, the reading isn’t as soft as 1.1% suggests because real final sales rose 3.4% during the quarter, led by a 3.7% increase in real consumer spending.
For Q2, we are projecting a 1.0% increase in real GDP followed by 2.0% increases for the last two quarters of this year. If that scenario starts to unfold, we wouldn’t be surprised to see the doomsters soon start pushing out their hard-landing scenario into 2024, when we expect a pickup in economic growth fueled by better productivity gains.
US Economy II: Rolling Recession Update. We think that a recession of the rolling variety actually started early last year when the Fed began raising interest rates aggressively, knocking the single-family residential industry off its foundation. Producers and providers of goods fell into a recession during H2-2022, when consumers unexpectedly pivoted from buying goods to purchasing services. That caused unintended inventory accumulation, which was cleared by cutting new orders and prices. Now the upturn in April’s M-PMI and its components suggests that the goods recession may be bottoming (Fig. 2).
Up ahead, we agree with Musk and Munger that the auto and commercial real estate industries will be challenged by tightening lending standards. So the rolling recession will continue to roll for a while longer. Consider the following:
(1) Autos. Weekly data are available on auto loans at US commercial banks (Fig. 3). The series for all banks fell 0.6% y/y through the April 19 week to $516 billion. Total motor vehicle loans in consumer credit are available only through Q4-2022, when they rose to a record $1.4 trillion even though interest rates on those loans rose and lending standards were tightened (Fig. 4). The good news is that auto sales have been relatively subdued (Fig. 5). Since there hasn’t been an auto sales boom, any bust is likely to be relatively mild.
(2) Construction. Weekly data are also available on commercial real estate loans at all banks (Fig. 6). They’ve been edging down recently from a record high of $2.92 trillion during the March 15 week.
Commercial construction put in place peaked at a record $131.8 billion (saar) during December 2022. It was down 4.8% from there through March. This is likely to be the latest cyclical peak in this series for a while. However, manufacturing construction put in place soared 62.3% y/y through March to yet another record high of $147.4 billion, fueled by the onshoring of production.
Europe I: The Price of a Baguette. Parisian bakers report that their electric bills have quadrupled since Russia invaded Ukraine, while the costs of flour, butter, and eggs all are up about 50%. “The headwinds facing boulangeries in France’s capital highlight why the European Central Bank [ECB] is facing a tougher struggle than the Federal Reserve,” according to an April 28 Barron’s article discussing why Europe’s inflation problem is stickier—more persistent and less likely to be tamed—than that of the US. Here are some of the points made and our own observations:
(1) What’s behind inflation’s rise. Expectations are that European inflation will outlast inflation in the US; one reason is that the ECB started raising interest rates later than the Fed did.
In a pressure cooker of pent-up demand and supply-chain shortages following the Covid-19 pandemic, Russia’s invasion of Ukraine during February 2022 sent European inflation boiling over. Europe’s limited gas supplies as a result of the war exerted upward pressure on prices generally. Looking ahead, the ECB is concerned that geopolitical tensions and fragmentation could push prices up further.
(2) Inflation over there. Headline inflation in the Eurozone peaked at a record-high rate of 10.6% in October and is now 6.9% (Fig. 7). (The flash estimate for April will be available this morning.) But the drop in Eurozone inflation has been driven almost entirely by lower energy prices due to a mild winter. Energy in the Eurozone CPI dropped from an extremely elevated rate above 40% in the months after the war began in March 2022 to -0.9% in March of this year (Fig. 8). Meanwhile, food, alcohol, and tobacco prices have shown no sign of abating, with the rate soaring to a new record high of 15.5% in March (Fig. 9).
French ECB policymaker Francois Villeroy de Galhau said during an April 25 interview that he expects that food price inflation will decline during H2-2023 but that headline inflation likely won’t fall to the ECB’s target until 2025.
(3) When rates will fall. With no sign of overall inflation easing anytime soon, the ECB is widely anticipated to raise interest rates during its meeting this week, on May 4, and to keep raising them at subsequent meetings. The Fed likely is nearly done raising rates.
Europe II: Winter Is Coming, Again. Europe’s economy avoided a recession during Q1-2023, when real GDP rose just 0.3% (saar). The region remained surprisingly resilient despite Russia’s war on Ukraine, the recent banking crisis, and the ECB’s fight against inflation. Rising factory output and falling energy costs helped to drive a slight rebound in overall output. Europe also benefited since late last year from less restrictive Covid-19 policies from China, its largest trading partner.
Our call last June suggesting overweighting European stocks turned out to be a good one. Melissa and I noted in the June 29 Morning Briefing: “[N]ow may be a good time to buy and hold European stocks given how cheap they’re trading relative to recent history.” That was as lots of smart money was building up short positions in Europe, only to unwind them soon after.
Looking ahead, Europe is not recession-proof. Inflation persists. The ECB is plugging along with its plans to continue to tighten monetary policy, as discussed above. European stocks have become less attractive now that stock prices have caught up with better-than-expected outcomes for energy and trade, and overall output. China’s less restrictive pandemic policies may ease supply-chain challenges for Europe, but increased domestic demand in China could increase competition for global liquified natural gas (LNG) resources. Geopolitical tensions and fragmentation could strain Europe’s ability to obtain other natural resources. It’s not hard to see these challenges sending shivers through European markets ahead of next winter.
For these reasons, Melissa and I now are less bullish on Europe than we have been. Here's more on the headwinds facing Europe:
(1) Energy stores. Energy prices have fallen from last summer’s peaks. The warm winter has mitigated the widely feared gas crisis spurred by the war in Ukraine. Europe also has found alternative sources of LNG. Imports of LNG from the US rose substantially early in 2023 compared to early last year.
However, Europe is not out of the woods, as its energy stores need to be replenished for next winter. “The European Union faces a potential shortfall of almost 30 billion cubic [meters] of natural gas in 2023—but this gap can be closed and the risk of shortages avoided through stronger efforts to improve energy efficiency, deploy renewables, install heat pumps, promote energy savings and increase gas supplies,” the IEA said in a December 2022 report.
Yet the IEA cautioned that “2023 may well prove to be an even sterner test for Europe because Russian supplies could fall further, global supplies of liquified natural gas will be tight—especially if Chinese demand for LNG rebounds—and the unseasonably mild temperatures seen at the start of the European winter are not guaranteed to last.”
A policy brief on the website of Brugel, a Europe-focused think tank, wrote that European gas stores will need to be 90% full by October 2023 to allow for naturally occurring demand. But overly low stores could be offset by demand-dampening policies that reduce consumption by 13% (relative to the average of the past five years), Brugel estimates. Strong economic growth in China, for example, could tighten LNG markets, the brief also noted.
(2) German reactors closed. On April 14, the German government went ahead with its plan to close the remaining three nuclear reactors. In an April 14 letter to Germany’s chancellor Olaf Scholz, scientists wrote: “In view of … the obvious energy crisis in which Germany and Europe find themselves due to the unavailability of Russian natural gas, we call on you to continue operating the last remaining German nuclear power plants.” In the absence of nuclear power, electricity prices are bound to rise, they said. In effect, they called Scholtz a dummkopf.
(3) China monopoly. It’s not just energy shortages that are putting Europe’s economic future at risk. Europe’s fate also could depend on geopolitical tensions and further fragmentation from China. Europe depends on China for 98% of its rare earth supply, observed ECB Chair Christine Lagarde in an April 28 speech. Indeed, Beijing is reportedly crafting plans to potentially block exports of technology needed to process and magnetize certain rare earth metals. Supply disruptions on these fronts could affect critical sectors in the economy, such as the automobile industry and its transition to electric vehicle production,” Lagarde added. She expects that if “global value chains fragment along geopolitical lines, the increase in the global level of consumer prices could range between around 5% in the short run.”
(4) Banking crisis ongoing. Despite policymakers’ attempts to inspire confidence in the banking system, stocks of European banks continue to be hit by the turmoil sparked by Silicon Valley Bank and the collapse and subsequent government-brokered takeover of Switzerland’s Credit Suisse.
(5) Stock prices. The Europe MSCI Index is up 37.9% in dollar terms through Friday’s close from a recent low on September 27, when Russia’s war on Ukraine was escalating (Fig. 10). Our Blue Angels Implied Price Index shows that European valuations have become less attractive (Fig. 11). Heading into 2023, analysts had been increasing their earnings expectations despite all the bad headlines (Fig. 12). Since the start of this year, however, consensus estimates for the Europe MSCI’s earnings per share (in local currency) have been dropping, likely because analysts anticipate higher interest rates.
Europe III: From Green to Beige Shoots. With Europe’s energy markets easing and factory orders rising, an increase in consumer demand would seem likely to follow. But because inflation broadly is still high, these positive developments have barely shown up in consumer sentiment so far. Here’s a look at the latest economic indicators, which seem to be more beige than green this spring:
(1) Eurozone output. Last fall, a recession in the Eurozone, caused largely by the cost of Russia’s pullback on natural gas supplies, was widely expected. But Europe made it through winter relatively unscathed. Real GDP rose at an annualized rate of 0.3% in Q1, after contracting by 0.2% in Q4-2022 (Fig. 13). On a y/y basis, output rose 1.3%. Growth this year has partly been driven by factories that have reversed a reduction in output, as energy prices surged last year. But depending on how the energy crisis shakes out next winter, factory output may face a pullback again later this year.
(2) Eurozone sentiment. The Eurozone’s economic sentiment indicator (ESI) fell below 100 during July 2022 on fears of energy shortages during the winter, which did not happen (Fig. 14). It bottomed at 93.8 in October, rebounded to 99.3 in March, and stayed there in April. That reading is consistent with no growth in the region’s real GDP on a y/y basis. Sentiment could fall again if the energy outlook darkens further as the ECB tightens. Consumer sentiment has been weak, as mirrored in the volume and value of retail sales (Fig. 15 and Fig. 16). However, the ESI’s consumer component has rebounded by 10.9pts since September’s record low of -28.8.
(3) Industrial production and German orders. Until the war jacked up energy prices, Europe’s industrial production on a y/y basis had fully recovered to pre-pandemic levels (Fig. 17). Manufacturers had to reduce their production late last year to conserve energy. Energy prices have come way down since late last year, but likely would need to stay at lower levels through year-end for factories to affordably raise output on a sustainable basis. Incoming orders for manufacturers in Germany, the EU’s largest economy, rose early this year along with industrial production (Fig. 18 and Fig. 19).
We will see how the energy, banking, and geopolitical crises play out ahead. But even if Europe’s headwinds turn out to be milder than expected, we would rather market-weight than overweight Europe for now.
China, Energy & CO2
May 01 (Monday)
Check out the accompanying pdf and chart collection.
Executive Summary: China’s President Xi has been pursuing an ambitious agenda for the nation, brazenly at that. Jackie reports on measures China has taken to step into the limelight on the world stage, beef up its military might, tighten its grip over multinationals operating there, and get its currency into global circulation. … Also: Energy markets are sending mixed signals, clouding the forecast. For the oil industry, tumbling earnings and revenues consensus expectations may be off the mark if optimistic oil price forecasts pan out. … And in our Disruptive Technologies segment: Expect to see more companies capturing their carbon—and attractive tax credits.
YRI Weekly Webcast. Join Dr. Ed’s live webcast with Q&A on Mondays at 11 a.m. EST. You will receive an email with the link one hour before showtime. Replays of the weekly webcasts are available here.
China: Über Alles? China’s growing military might and influence over Russia and OPEC are allowing the country to throw its weight around on the world stage with impunity.
Russia is indebted to China for supplying it with technology and supporting President Vladimir Putin’s invasion of Ukraine. The OPEC nations are likely eager to please their largest customer. Domestically, China’s President Xi Jinping has solidified his power with a third term. Throw in a military force that’s second only to the US military, and China’s recent aggression is no surprise.
China’s military has become increasingly hostile, taunting Taiwan by flying its military aircraft and sailing its ships nearby. China has grown more aggressive in the business world, questioning the employees of Western businesses located in China and pushing to settle international trade in yuan instead of dollars. But ironically, the country is attempting to play the role of peacemaker in the Middle East and Ukraine. On April 20, Treasury Secretary Janet Yellen delivered a blunt speech calling out China’s misbehavior on numerous fronts, yet indicating America’s willingness to work with the country if it adheres to international rules.
Let’s take a look at how China’s growing influence is being felt around the world:
(1) Pressing Taiwan. For years, China has harassed Taiwan by sending aircraft into airspace near the country. Last week, the country may have taken its intimidation to a new level. Two Chinese drones flew around the perimeter of Taiwan at the same time that another 17 fighter jets “hovered” southwest of Taiwan, an April 28 South China Morning Post (SCMP) article reported.
The use of drones was described as a “low-cost strategy to break the self-ruled island’s 24-nautical mile air defense identification zone.” One drone was a long-endurance strike-and-reconnaissance drone, which can carry heavy weapons.
For three days in April, the Chinese Army held drills around Taiwan in response to Taiwan’s President Tsai’s meeting with House Speaker Kevin McCarthy (R-CA) in California. The exercises involved sending 91 warplanes into Taiwan’s Air Defense Identification Zone, operating naval vessels in the waters around Taiwan, and simulating both precision strikes and sealing off the island, an April 10 article on The Hill reported.
Next week, Taiwanese business organizations are hosting the Taiwan-US Defense Industry Forum in Taiwan, providing a forum for companies from both countries to discuss cooperation. China wasn’t pleased to hear of it. Taiwan’s current leaders’ “practice of bringing wolves into the home is repugnant and will only bring a deep disaster to Taiwanese compatriots,” said China’s defense ministry spokesperson, according to an April 27 Reuters article.
(2) Economic aggression. China has begun to respond to recent actions the US has taken against Chinese individuals and business. The US banned selling high-end semiconductor chip-making technology to China to keep the leading-edge technology out of the hands of China’s military. US officials also have charged various Chinese nationals in the US with not disclosing their ties to China or spying for the country.
Now China appears to have retaliated by expanding “a version of its espionage law that placed tighter state control over a wider swath of data and digital activities. Foreign executives said they worry the new law … could criminalize an array of normal business activities such as gathering intelligence on local markets and business partners,” an April 27 WSJ article explained.
Chinese authorities have gone after specific Western businesses as well. Last week, they questioned Boston-based Bain & Company’s Shanghai employees. Bain said it is cooperating with authorities but declined to comment further, reported the WSJ. In March, Chinese authorities raided the Beijing offices of Mintz Group—a due diligence company based in Washington, DC—detaining all five staff members there. Following the raid, the office was shut. The same month, China detained a Japanese national who is an employee of Astellas Pharma, a Japanese drugmaker, on suspicion of espionage.
And in late March, China’s cyberspace regulator said it would review products sold by Micron Technology to “prevent hidden risks and safeguard national security.” Micron has said it will cooperate with the probe and that its operations in China are unaffected so far, an April 26 Reuters article reported.
(3) Pushing for the yuan. Along with China’s desire to be more politically influential on the world stage, the country also wants its currency to be more widely used. China’s trade with Russia is occurring in yuan, and 17% of Russia’s foreign reserves are denominated in yuan. The yuan also has replaced the US dollar as the most traded currency in Russia.
China is pushing to settle its trades in oil and natural gas in yuan. China’s CNOOC and France’s TotalEnergies used yuan when they completed the first LNG (liquid natural gas) trade on the Shanghai Petroleum & Natural Gas Exchange in March, reported Oilprice.com on March 29. Saudi Arabia and Beijing are in talks to price some of the oil that China purchases from the Saudis in yuan. China purchases more than 25% of the oil that Saudi Arabia exports, according to a March 15, 2022 WSJ article. Argentina announced that it will pay in yuan, instead of dollars, for $1.04 billion of Chinese imports in April and $790 million a month after that. Brazil also has offered to trade with China in yuan.
“The proportion of yuan used in China’s cross-border transactions rose to 48% in March from close to zero in 2010, while use of the US dollar has dropped from 83% to 47% during the same period,” an April 27 SCMP article reported, citing Bloomberg data. The yuan has jumped 5.7% from its 2022 low, but that likely has more to do with China ending its Covid lockdown policies. The currency is still 8.9% off its 2022 highs (Fig. 1).
(4) Playing peacemaker. President Xi has kicked off his third term by becoming a global statesman. Xi recently held his first call with Ukrainian President Volodymyr Zelensky, advocating for peace between Ukraine and Russia. After the call, China’s Foreign Ministry stated that it would send a special representative for Eurasian affairs to Ukraine and other countries for “in-depth communication with all parties on the political settlement of the Ukrainian crisis,” an April 26 WSJ article reported.
It’s hard to take this overture seriously given that a month earlier Xi visited Russia for three days. There, he noted that China’s and Russia’s “political mutual trust is deepening” and their “common interests are multiplying,” a March 21 WSJ article reported. It was Xi’s first trip since the start of his third term as president. So far, China has not supplied Russia with ammunition, but it reportedly has considered the option as well as sold the country microchips and other technology. Trade between the two countries has surged, with China’s exports to Russia climbing to $9.0 billion in March, nearly double Q1-2021’s $4.3 billion (Fig. 2).
The call with Zelensky came after a Chinese ambassador questioned the sovereignty of former Soviet states. His comments were quickly dismissed as his own opinion versus that of China, but they caused a stir nonetheless.
It’s unlikely that China would put itself in the middle of the Russia/Ukraine war unless it thought it could negotiate an agreement between the two parties that would reflect well on China. China recently enjoyed successfully negotiating a deal that reinstated the diplomatic ties between Iran and Saudi Arabia. However, China has less control over Russia and Ukraine than it has over the two Middle Eastern countries given that China is a large consumer of their oil.
(5) Bolstering military might. The US military forces eclipse those of China, but the latter country is quickly expanding and modernizing its military into a force that it believes will rival the US’s military by 2050. According to official figures, the country is expected to increase military spending by 7.2% this year to $225 billion, far less than the roughly $800 billion the US is expected to spend. However, official Chinese data are thought to understate the amount actually spent on the military.
With its pockets full, China has been “upgrading its weapons and equipment, improving its logistics and transportation capabilities and enhancing its cyber and space capabilities,” a March 6 article in The Times of India reported. China has been investing in military applications for artificial intelligence and quantum computing. The country has expanded its navy, developing new aircraft carriers and submarines that have allowed it to flex its muscle further into the Indo-Pacific region. And it has been building military bases around the world, using them for logistics and support, the article reported.
Here's a snapshot of the US and China military capabilities included in The Times of India article: active personnel (1.4 million US, 2 million China), reserve personnel (442,000, 510,000), paramilitary force (0, 625,000), aircraft (13,300, 3,284), tanks (5,500, 4,950), armored vehicles (303,553, 174,300), aircraft carriers (11, 2), helicopter carriers (9, 3), submarines (68, 78), and small warships (22, 72).
Last month, 60 Minutes ran an in-depth segment about US naval power relative to the US. The upshot: The US has a larger naval force, but China is catching up quickly, and it’s growing more aggressive in the Western Pacific. In the air, the US and China are in a race to develop sixth-generation fighter jets. The peace dividend from the end of the Cold War with Russia is officially being spent—and then some.
Energy: Divided Opinions. With oil and natural gas prices down sharply from their 2022 highs, investors and industry analysts have differing opinions about the future. Stock investors have bid up the shares despite analysts’ dour earnings projections. Let’s take a look at the S&P 500 Integrated Oil & Gas industry as well as one of its largest members:
(1) Have earnings peaked? On Friday, ExxonMobil reported earnings that were mixed. Adjusted earnings per share were up 37.7% from those of last year’s Q1, but they were 16.8% below Q4 results. The difference is largely because the price of Brent oil has fallen 38.8% since it peaked in March 2022 and the price of natural gas is 75.1% below its August 2022 peak (Fig. 3 and Fig. 4).
ExxonMobil shares gained 1.5% after the company reported earnings on Friday. The gain brought the shares’ one-year advance to 38.8%, trouncing the S&P 500’s 0.9% one-year gain. Even though Exxon shares are near their record high, analysts are decidedly negative about the oil giant’s earnings prospects. Analysts are forecasting that earnings per share will decline from last year’s $13.26 to $10.18 this year and $9.64 in 2024. And the estimates have been getting trimmed in recent months, according to WSJ data. Three months ago, Exxon was expected to earn $10.61 a share this year and $9.85 next year.
(2) Mixed messages about the industry too. A similar pattern is found when looking at the S&P Integrated Oil & Gas industry, of which Exxon, Chevron, and Occidental Petroleum are members. The industry’s stock price index is near its 2022 peak even though analysts collectively are not very optimistic about the industry’s earnings power this year (Fig. 5). Their consensus estimates suggest that the S&P 500 Integrated Oil & Gas industry’s revenue is expected to tumble 12.3% this year and another 1.4% in 2024 (Fig. 6). Expectations for earnings follow a similar path; they’re forecast to tumble 27.9% this year and 0.1% next year (Fig. 7).
The negativity conveyed by the consensus estimates contrasts with optimism of Pioneer Natural Resources’ incoming CEO Rich Dealy. He believes that oil demand will continue to increase this year, sending crude oil prices up to $80-$100 a barrel later this year, according to an April 28 Bloomberg article. The shale driller was reportedly in preliminary talks to be acquired by ExxonMobil, according to an April 7 WSJ report.
Energy companies have done a masterful job at remaining profitable even when oil prices fall, in part because they’ve been able to produce far more energy using far fewer rigs than in the past. In October 2014, there were 1,609 rigs in operation industrywide at the peak. Oil production peaked shortly thereafter at 9.6 mbd. Today, there are only 591 rigs employed, but 12.2 mbd of oil are being produced (Fig. 8).
Disruptive Technologies: Capturing Carbon. One of the items highlighted in ExxonMobil’s latest earnings press release is a recently struck long-term agreement to transport and permanently store up to 2.2 million metric tons of carbon dioxide each year from Linde’s new clean hydrogen production facility in Beaumont Texas. Linde, an industrial gases and engineering company, expects operations to begin in 2025. If its goals are achieved, the amount of CO2 stored each year will equal the emissions of nearly half a million cars.
This deal follows one struck last October between Exxon and CF Industries, a manufacturer of hydrogen and nitrogen products. CF is spending $200 million to build a CO2 dehydration and compression unit at its ammonia facilities in Donaldsonville, Louisiana. Starting in 2025, Exxon will store up to two million metric tons of the captured CO2 annually in secure geologic storage it owns in Louisiana, a company press release states.
We can expect to see more of these deals thanks to the Inflation Reduction Act, reported an excellent article in Barron’s on April 29. The legislation boosts the existing tax credit for capturing carbon from the current $50 per tonne of CO2 captured to $85 per tonne if the CO2 is buried underground. The credit is increased to $60 if the CO2 is used to enhance the amount of oil recovered from wells. The larger tax credit now covers the cost of capturing carbon dioxide from many industrial plants, including most power, cement, iron, steel, hydrogen, and ammonia plants.
Some projects may be held up if they are unable to get the permits necessary to build pipelines to transport the CO2 in situations where pipelines don’t already exist. But if that hurdle can be overcome, then expect to see the many carbon capture projects in various stages of development come to market. The amount of CO2 captured annually could surge from less than 50 million tonnes last year to more than 250 million tonnes by 2030, according to data from the International Energy Agency quoted in the Barron’s article.
Tech, Staples & Robotaxis
April 27 (Thursday)
Check out the accompanying pdf and chart collection.
Executive Summary: Before long, every large corporation will be following in PricewaterhouseCoopers’ footsteps and trying to leverage AI to their advantage. Microsoft is well positioned to benefit via its OpenAI investment and Azure cloud computing service. … Consumer Staples companies have turned investors’ heads with stellar March-quarter results, buoyed by pricing power. But their unit sales growth might be vulnerable to price-sensitive consumers’ disloyalty. … And in our Disruptive Technology segment, Jackie explores the Achilles’ heel of autonomous vehicles: situations they haven’t been programmed for.
Technology: AI Drives the Story. PC sales are in a slump, and Microsoft’s deal to acquire Activision Blizzard was blocked by a UK regulator, but Microsoft investors don’t care because the company appears to be successfully jumping into the AI era and beating its closest competitor, Alphabet, to the punch.
A WSJ article yesterday underscores the opportunity before Microsoft: “PricewaterhouseCoopers plans to invest $1 billion in generative artificial intelligence technology in its US operations over the next three years, working with Microsoft Corp. and ChatGPT-maker OpenAI to automate aspects of its tax, audit and consulting services.”
All the funds won’t line Microsoft’s pockets. Some of the funding will pay for PWC to hire its own AI workers, train existing staff in AI, and potentially acquire AI software companies. The firm plans to use AI internally to make its operations more efficient, and it plans to advise its clients on how to harness AI. When it taps into OpenAI’s AI tools, it will be paying a company that is 49% owned by Microsoft, and it will be accessing the AI tools on Microsoft’s Azure cloud computing service.
We expect that all large companies at some point will consider whether and how they can use AI to make operations more efficient. Enterprise Technology Research surveyed about 500 corporate IT decision makers, and 53% said they “planned to evaluate, use or allocate further resources to OpenAI’s ChatGPT technology,” the WSJ article reported. So while companies may be looking to shrink their existing cloud computing bills, their interest in AI will likely mean higher cloud computing bills for years to come.
Microsoft’s Azure cloud revenue jumped 27% y/y in its fiscal Q3 (ended March 31), and the company forecast 26%-27% y/y growth in the current quarter. Google also has AI capabilities, and its Q1 cloud revenue jumped 28% y/y. Both companies have divisions that dragged down results: Microsoft’s More Personal Computing unit saw revenue fall 9% y/y last quarter, and Alphabet’s advertising revenue fell less than 1% in the quarter. Microsoft’s net income rose 9%, while Alphabet’s fell 8.4%.
Microsoft shares rose 7.2% on Wednesday, compared to the S&P 500’s 0.4% decline and Alphabet’s 0.2% decline. Until Alphabet can lure AI clients like PWC, Microsoft’s lead should widen.
Microsoft is a member of the S&P 500 Systems Software industry, which has jumped 17.7% ytd through Tuesday’s close (Fig. 1). Investors expect the industry’s revenue to increase 6.5% this year and 11.1% in 2024 (Fig. 2). Earnings, though forecast to grow only 3.1% this year, are expected to jump 14.9% next year (Fig. 3). And the industry’s forward P/E of 26.9 is right in the middle of its 20.8 recent low (hit in October) and 34.3 recent high (November 2021) (Fig. 4).
Consumer Staples: Pricing Power Saves the Day. When the financial markets get a little rocky, investors often turn to the safety of consumer staples stocks. That was the case for the week ending Tuesday, when the S&P 500 lost 2.0% yet the S&P 500 Consumer Staples sector gained 1.0%, making it the second-best performing sector behind only Utilities. The Q1 results reported by some of the sector’s biggest names were boosted by an ability to raise prices sharply and offset rising costs.
One area worth watching closely is unit sales, which fell for many players last quarter. Perhaps consumers responded to higher prices by cutting back or perhaps they opted to buy less expensive alternatives. Either way, negative y/y unit sales comparisons may indicate that there is a limit to how fast and how high prices can be hiked. Fortunately, managements expect that going forward costs and price increases will moderate.
Let’s take a look at the recent earnings reports of Procter & Gamble, Kimberly-Clark, PepsiCo, and Coca-Cola:
(1) Cleaning gets expensive. Procter & Gamble boosted prices by 10% y/y in its fiscal Q3 (ended March 31), but the organic volume of products sold in many categories declined. (Organic volume excludes the impacts of foreign exchange, acquisitions, and divestitures.) Here are the year-over-year price and organic unit-volume changes in each of P&G’s divisions for the quarter: Fabric & Home Care (13% price, -5% volume), Grooming (10%, -1%), Baby, Feminine & Family Care (8%, -4%), Beauty (8%, 0%), and Health Care (6%, 1%).
Because net sales rose 4%, greater than the 1% increase in P&G’s cost of products sold, P&G’s gross margin increased to 48.2% from 46.7% a year earlier, according to the company’s April 21 press release. The company’s gross margin had been under pressure since its recent peak in 2021 at 51.2%.
Going forward, the company faces some headwinds. In “quarter four, we will start to lap price increases for the first time. So, we had about 8% of pricing in the base. So that will be a negative headwind to the top-line growth in quarter four. And while we see stabilization of volumes, I would expect that there still will be a negative volume component to the growth in the near future,” warned CFO Andre Schulten during the company’s earnings conference call. Procter & Gamble exited Russia last year, making for tough comparisons, and its China business hasn’t fully recovered. In Europe, the consumer is “under a lot of pressure,” and private-label manufacturers haven’t increased their prices as the branded companies have.
The company’s strong results allowed it to increase its fiscal 2023 (ending June) guidance for organic sales growth to 6% from 4%-5% previously. But management is maintaining its 0%-4% estimate for core earnings-per-share growth due to “significant” headwinds from input costs and foreign exchange.
Investors looked past any headwinds in the current quarter and sent P&G shares up 3.5% since its earnings release on Friday through Tuesday’s close, compared to the S&P 500’s 1.4% decline over those days.
(2) Diapers cost more too. Kimberly-Clark raised prices by 10% y/y in Q1, but volume fell 5%, according to a company press release. As a result, Q1 sales increased 2% to $5.2 billion, and organic sales improved by 5%. The gross margin improved by 340bps to 33.2%.
Volumes were down across the company’s product lines and in all geographic areas: Consumer Tissue (-5%), Personal Care (-5%), and KC Professional (-6%).
Kimberly-Clark’s Q1 diluted earnings per share jumped 8% y/y to $1.67, and the company raised its full-year earnings-per-share growth estimate to 6%-10%, up from 2%-6% previously, while decreasing its 2023 costs estimate. Kimberly-Clark’s shares rose 1.6% after its earnings were released on Tuesday, compared to the S&P 500’s 1.6% decline the same day.
Both P&G and Kimberly-Clark are among the members of the S&P 500 Household Products stock price index, which has risen 3.7% ytd through Tuesday’s close (Fig. 5). Analysts collectively forecast revenue increases of 1.5% this year and 4.0% in 2024 (Fig. 6). Earnings are forecast to inch up in 2023 by 3.4% and improve by 9.9% next year (Fig. 7). At 24.2, the industry’s forward P/E is near the upper end of its range over the past two decades (Fig. 8).
(3) Soda prices bubbling up. PepsiCo enjoyed a 10.2% y/y jump in Q1 revenue, helped by a 16% y/y jump in net prices that was offset by a 2% y/y drop in organic volume, according to its Q1 earnings press release. Excluding the impact of foreign exchange and acquisitions and divestitures, organic revenue jumped 14.3% y/y, and core EPS grew 18% y/y.
As a result of the strong quarter, the company boosted its 2023 forecasts for organic revenue growth to 8% from 6% and for its core, constant-currency earnings-per-share growth to 9% from 8%.
The company is seeing inflation decelerate, and it may not need to raise prices again this year. “We’re seeing better labor availability, better flow of materials, suppliers are obviously getting better as well. Transportation is getting better. So operationally, the business is in a better place than it was in 2022,” said CEO Ramon Laguarta on Pepsi’s April 25 earnings conference call. He added that Pepsi has “mostly taken the pricing already this year that we needed to cover for our cost increases. … and we think that with the pricing that we’ve taken already [in] most of our business around the world, that should be sufficient.” Pepsi shares rallied 2.1% on Tuesday, while the S&P 500 declined 1.6%.
Meanwhile, Coca-Cola’s Q1 organic revenue grew 12% y/y, bolstered by an 11% jump in price/product mix, the company’s April 24 press release stated. Despite the jump in prices, the cola company saw unit case volume increase by 3% for the company as a whole, with volumes falling 3% in Europe, Middle East & Africa, remaining flat in North America, and growing 10% in Asia Pacific and 5% in Latin America.
“The Atlanta-based beverage giant anticipates that inflationary pressures will moderate this year, particularly in the second half of 2023, and that means it will institute fewer price increases,” an April 24 WSJ article reported. “Our approach to pricing, whether it’s in inflationary times or not, is to make sure that we keep pace with inflation,” said CFO John Murphy, according to the WSJ. “Our pricing in 2022 and even in some markets in the early part of 2023 reflects that.”
Coke confirmed an earlier 2023 forecast of organic revenue growth of 7%-8% and comparable, currency-neutral earnings-per-share growth of 7%-9%. The company’s shares are basically flat since the earnings release.
Pepsi and Coke are both part of the S&P 500 Soft Drinks & Nonalcoholic Beverages stock price index, which is up 1.8% ytd through Tuesday’s close (Fig. 9). Analysts are optimistic that the industry will grow revenue by 4.5% this year and 5.2% in 2024 (Fig. 10). Earnings are forecast to jump 7.0% this year and 8.7% next year (Fig. 11). At 24.4, the industry’s forward P/E is near the top of its 20-year range (Fig. 12).
Disruptive Technologies: Autonomous Vehicles on a Roll. Every once in a while, autonomous vehicles (AVs) encounter a problem their programmers never anticipated.
For example, a snoozing customer in an autonomous taxi posed a conundrum recently. What does an AV do when its passenger falls asleep and can’t be roused by an in-car communication system? When sleeping beauty wouldn’t arise, the staff monitoring a Cruise AV called 911, prompting the dispatch of police and firefighters. This has occurred in San Francisco on a number of occasions, according to a January 29 Digital Trends article. While the tale made us chuckle, San Francisco agencies aren’t happy with the wasted municipal resources.
There have also been tales of AVs coming to a standstill when they don’t know how to react to a situation they’ve encountered.
But unforeseen issues notwithstanding, more and more AVs are hitting the road. Here’s an update on what some of the largest players are up to:
(1) Cruise drives 24/7 in CA. In San Francisco, GM’s Cruise AV fleet is running 24 hours, seven days a week. And from 10 pm to 5:30 am, Cruise AVs drive paying passengers in northwest San Francisco without a human driver behind the wheel, an April 25 CNBC article reported.
Cruise was granted the right to drive 24/7 even though the AV operator has had some hiccups. The company, which also operates in Phoenix and Austin, initiated a voluntary recall to update the software in 300 robotaxis after one hit the back of a San Francisco city bus. There were no injuries and only minor damage to the Cruise vehicle in the crash. But the recall is necessary to determine why the AV failed to detect that the bus was moving slowly, an April 7 TechCrunch article reported.
Cruise came under scrutiny when one of its cars stopped on trolley tracks and wouldn’t move, as a December 8 Slate article reported. And about a year ago, a Cruise vehicle blocked a travel lane needed by a fire engine.
(2) AV funding tumbles. GM believes that Cruise will generate $1 billion in revenue by 2025 compared to only $106 million last year, when it lost nearly $2 billion, an April 5 AP article reported. But not everyone in the industry is in the same lane.
Funding for self-driving vehicles crashed last year, with only $4.1 billion invested in AVs, less than half the $9.7 billion invested the prior year. Funding dropped as investors questioned the path to commercialization for many AV companies, an April 19 article in Forbes reported.
“Google’s robotaxi startup Waymo has laid off staff, self-driving tech company Aurora is looking at cash preservation, Ford and VW’s Argo AI is shutting down, and multiple other autonomous vehicle startups and projects are consolidating their positions, partnering to reduce costs and risks, or reducing headcount,” the article reported, citing a report by F-Prime Capital.
(3) Doubting BYD. A spokesman from BYD, China’s largest electric vehicle manufacturer, said that self-driving technology that is “fully separated from humans is very, very far away, and basically impossible,” an April 18 CNBC article reported.
“When we think about [self-driving tech] from all aspects, from human psychological safety needs, from ethics, from regulation, from technology—including application in this industry—we haven’t figured out [the logic] and we think it is probably a false proposition,” the BYD spokesperson told reporters. It’s better to use advanced automation in factories as a manufacturing tool, he said.
(4) Don’t tell that to Tesla fans. Tesla is expected to unveil fully autonomous driving software by year-end, prompting the folks at Cathie Wood’s ARK Invest to arrive at an audacious stock price target of $2,000 by 2027, an April 25 Yahoo Finance article reported. An ARK analyst believes the automaker will roll out a robotaxi service that will generate “$613 billion in revenue by 2027 and account for two-thirds of the company’s enterprise value,” the article states. Globally, ARK estimates the total market for robotaxis will be worth $9 trillion to $10 trillion in the next decade.
And that’s what makes a market.
Fiscal Dystopia
April 26 (Wednesday)
Check out the accompanying pdf and chart collection.
Executive Summary: If Congress doesn’t increase the federal debt ceiling soon, the government will no longer be able to pay its bills. Jim Lucier of Capital Alpha Partners reports on the progress of the Limit, Save and Grow Act, which may well pass the House this week. … The government has been in such pickles before, and the debt limit usually got raised before the 11th hour and a couple of times at the 12th hour. Of course, the recent consequences of the government’s unprecedented fiscal excesses have been massive federal deficits and inflation boosted by helicopter money. But doomsday as predicted by the doomsters has yet to arrive. We examine why. … Also: Joe looks at the profit margins that analysts expect for S&P 500 sectors and industries.
US Fiscal Policy I: X-Date Is Coming. Axios’ Matt Phillips reported on Tuesday that the federal government’s day of reckoning is approaching sooner than expected: “Analysts have been watching recent tax receipts especially closely, hoping that a bumper crop of tax payments could push out the day of reckoning—also known as the ‘X-date,’ when the government runs out of money and could default on payments. But no dice.” April is the best month for federal tax receipts because taxes are due on April 15. But last year was an awful year for stock investors. So capital-gains tax receipts are coming up short.
The US government hit its statutory debt limit of $31.4 trillion in January, putting a lid on the Treasury's ability to borrow (Fig. 1). Treasury has been taking “extraordinary measures” to pay its bills. That includes deferring payments to some government pension plans. Nevertheless, the Treasury’s funds are low, and its cash balance at the Fed was down to $166.5 billion on April 19, and falling rapidly toward zero (Fig. 2).
US Fiscal Policy II: The X-Games. Our good friend James Lucier bravely sorts out Washington’s political intrigues on fiscal policy matters for Capital Alpha Partners. He believes House Speaker Kevin McCarthy (R-CA) is within striking distance of passing a debt-limit bill, the Limit, Save, and Grow Act, through the House this week. Jim writes:
“McCarthy may surprise to the upside this week with a quick win on the debt limit. This will bring the first round of House proceedings to a successful close in April rather than the possible alternative of extending them through May and June, which seemed likely only weeks ago. A number of factors are working in McCarthy’s favor on the House floor this week. We still see the X-date as trending for late July, but we expect improved forecasts soon.”
The following are highlights from Jim’s recent analysis of the debt-ceiling impasse and what it will take to pass a deal:
(1) McCarthy has only four votes to spare, and a single high-profile defection could doom his chances of passing the bill on the first try.
(2) However, McCarthy’s conference appears to be coming together despite some trepidations from moderates and demands for more content from conservatives.
(3) Should McCarthy succeed in passing the bill this week, we think investors would receive the news that he has concluded the first stage of House proceedings with a win in April, rather than stretching the drama through May and June, as a positive surprise.
(4) McCarthy then would close the week with his political capital enhanced, not depleted. The sooner things go to the cooling-off stage on the Senate side, the better.
(5) The real challenge, of course, will be whether the House can pass a Senate-drafted bill in the end.
(6) The timing of the vote has yet to be announced, but we would not be surprised to see it on Wednesday rather than Thursday or Friday, when such votes typically take place.
(7) The House’s full agenda this week works in McCarthy’s favor, improving his chances of passing the bill through the House during this last week of April. A week-long break is coming up after Friday, South Korean President Yoon Suk Yeol will address a joint session of Congress on Thursday evening, and there will be several other votes this week that should be popular among Republicans. These include a Congressional Review Act vote to repeal President Biden’s tariff safe harbor for photovoltaics imported from South East Asia that would otherwise be subject to antidumping penalties.
(8) On the whole, moderate Republicans seem ready to support McCarthy because they see his debt-ceiling proposal as an opening offer that will jumpstart talks in the Senate and perhaps completely obviate the need for any direct talks with the Biden administration.
(9) There has never been any chance that the Senate would pass a clean debt-limit extension, in our view, a view widely shared by other observers.
(10) The Senate also has a 60-vote threshold for passing its own debt-limit package, which means that at least nine Republicans plus Democrat Joe Manchin (WV) must support it. Some features of the Senate product could be hard for House Republicans to swallow. But for now, Republicans appear to be united by the desire to beat conventional wisdom and stick one to the Biden administration.
To put Jim’s analysis of the current debt-ceiling impasse into historical context, we’d add one more important point: Such impasses have happened many times before and been resolved. The last major cliffhanger occurred at the end of 2012. It was resolved on New Year’s Eve with an agreement between Vice President Joe Biden and Senate Minority Leader Mitch McConnell! They are both still in positions to resolve the latest debt-ceiling crisis.
Fiscal Policy III: A Trillion Here, a Trillion There. Debbie and I have been on Wall Street as economists and strategists for more than 40 years. Over that entire period, doomsters have been scribbling away, producing lots of articles and books about the US federal deficits and debt. The only pause in their doom and gloom was during the late 1990s and early 2000s, when the federal government ran a surplus for a brief time. Nevertheless, while the annual federal deficits are now measured in trillions rather than billions, doomsday has yet to occur (Fig. 3).
Of course, as a result of the pandemic, the US budget deficit ballooned to record levels as government outlays soared, while receipts were depressed (Fig. 4). On a 12-month basis, the deficit hit a record $4.1 trillion during March 2021. It briefly fell just below $1.0 trillion during July 2022. In March of this year, it was back at $1.8 trillion, as outlays have been outpacing receipts.
There’s been one obvious adverse consequence of running such large deficits. The rebound in inflation since late 2021 undoubtedly was attributable to the three rounds of billions of dollars in pandemic relief checks sent by the government to millions of Americans in 2020 and 2021. All that fiscal stimulus combined with ultra-easy monetary policies amounted to “helicopter money,” a concept discussed by economist Milton Friedman and former Fed Chair Ben Bernanke. That money drop triggered a buying binge, mostly for goods since many services providers were hampered by social-distancing restrictions. The resulting demand shock overwhelmed global supply chains and sent inflation soaring.
But so far, the consequences of massive deficits haven’t been doomsday in nature. Nevertheless, it is hard to see how this doesn’t end badly eventually. There is a doomsday mechanism built into the government’s ever rising debt. The net interest paid by the government continues to grow rapidly, especially now that short-term interest rates have soared by 500bps over the past year. This outlay rose to a record $564.9 billion over the 12 months through March (Fig. 5). Just before the pandemic, it was $383.7 billion.
As Treasury issues mature and must be refinanced at higher interest rates, the government’s outlays on net interest paid will continue to rise. We estimate that the average interest rate paid by the Treasury on its publicly held debt is currently around 2.20% (Fig. 6). At 3.00%, the annual net interest expense would be $740 billion currently.
So why isn’t the deficit causing interest rates to soar? Consider the following:
(1) The Fed’s holdings of Treasury, agency, and mortgage-backed securities peaked at a record high of $8.5 trillion during May 18, 2022. As a result of the Fed’s quantitative tightening program, the Fed’s holdings of these securities are down $633.8 billion to $7.9 trillion as of April 19 (Fig. 7).
The comparable securities held by commercial banks peaked at a record $4.7 trillion on February 23, 2022. They are down $570.7 billion since then through April 12.
(2) On the other hand, bank depositors have been moving their money into money market mutual funds (MMMF), which have been buying lots of Treasury bills. The assets of MMMF increased $739.7 billion y/y through April 19 (Fig. 8).
(3) The major buyers of US bonds over the past year have been foreigners. Over the past 12 months through January, they purchased a record $1.1 trillion in the US bond markets, led by $878.1 billion in Treasury notes and bonds (Fig. 9 and Fig. 10).
(4) Finally, we have long believed that actual and expected inflation and the Fed’s reaction to inflation are more important in driving interest rates and the yield curve than supply and demand fundamentals. The latter two suggest that investors expect that inflation will moderate and the Fed will soon stop tightening.
Fiscal Policy IV: The Baby Boomers’ Bequest. The main reason that mounting government deficits and debt haven’t had major adverse consequences so far is that they represent intergenerational theft. The Baby Boomers are stealing from our children. We are leaving them a huge bequest of debt.
Strategy: Profit Margins. The consensus of analysts polled by Refinitiv expects the S&P 500 companies’ collective quarterly profit margin to improve to 11.8% in Q1-2023 from the 11.5% reported in Q4-2022 (Fig. 11). Since companies typically beat analysts’ forecasts, we think the actual profit margin could turn out to be 12.1% once all the Q1 results are in. That still would be below the 12.6% recorded for Q3-2022 and the record high of 13.7% hit in Q2-2021. But what’s more important for investors than how the level compares to past quarters’ margins is how much it prompts analysts to adjust their future expectations.
With the Q1 earnings season just getting underway, the initial response has been a lower-than-expected reduction to forecasts for Q2 and the rest of the year. For Q2, analysts currently think the profit margin will improve to 12.2%, above their current projection of 11.8% for Q1. Keep in mind that neither estimate yet reflects the typical bump that comes after companies report earnings beats, so the final profit margins should be slightly higher.
We calculate the S&P 500’s forward profit margin from analysts’ consensus forecasts for revenues and earnings. It’s down from peak levels last June for all 11 of the S&P 500’s sectors. But most sectors’ margins have held up extremely well. Energy, Financials, and Industrials have fallen the least, while just three sectors have trailed the S&P 500’s decline: Communication Services, Health Care, and Materials.
For a more in-depth look, see our S&P 500 Sectors & Industries Forward Profit Margins report, from which we highlight the notable changes below:
(1) S&P 500. The effects of the pandemic and ensuing shortages allowed companies to raise their prices, which caused the S&P 500’s forward profit margin to rise from 12.3% in April 2021 to a record high of 13.4% during the June 9 week last year. As of the April 20, 2023 week, it has round-tripped all the way back to 12.3%.
(2) Energy, Financials, and Industrials. Within the Energy sector—where margins now are rolling over from their record highs during 2022—only the Oil & Gas Refining & Marketing industry’s forward margin is still at a record high. Oil & Gas Equipment & Services’ margin is holding on at a post-pandemic high.
Within Financials, all of the banking industries’ forward margins have been drifting downward. Those of most insurance-related industries are stable, but the Insurance Brokers and Reinsurance industries’ margins have continued to move higher. These two Industrials sector industries’ margins remain near their record highs: Construction Machinery & Heavy Transportation Equipment and Electrical Components & Equipment. The Passenger Airlines industry is still rebounding from its losses during the pandemic, but its margin remains below its pre-pandemic highs.
(3) Communication Services, Health Care, and Materials. Two industries in the Communication Services sector, Broadcasting and Publishing, have been among the worst-performing S&P 500 industries in terms of profit margins. Advertising’s forward margin remains near a record high though. Health Care’s forward profit margin has dropped to a record low, paced by margin weakness in the Biotechnology, Health Care Facilities, and Pharmaceutical industries.
(4) Materials and Utilities. Most of the forward margins in the Materials sector’s industries have continued to drift downward except for that of Industrial Gases, which remains near a record high. Both the Copper and Gold industries’ margins seem to have bottomed following their steep declines in 2022, as they’ve trended higher so far in 2023. Within Utilities, only Water Utilities’ margin is trending higher; it was at a record high during the April 20 week.
The Economy Is Beige
April 25 (Tuesday)
Check out the accompanying pdf and chart collection.
Executive Summary: The stock market’s resilience since October 12 in the face of Fed rate hiking reflects the economy’s resilience. Measures of breadth for industry analysts’ estimates of S&P 500 revenues and earnings have been improving since early this year, and their optimism is supported by surveys of corporate purchasing managers. … The Fed’s latest Beige Book confirms that the banking crisis hasn’t knocked the economy off its rolling-recession path. … Also: We’ve known that QT and the banking crisis exert tightening forces equivalent to some amount of federal funds rate hiking. Now the SF Fed has quantified it, finding that the “effective” federal funds rate is currently over 6%.
Weekly Webcast. If you missed Monday’s live webcast, you can view a replay here.
Strategy: Forward Earnings Breadth Improving! Why is the stock market holding up so well, frustrating the bears who see a recession coming that will clobber both earnings and valuations? Their most optimistic scenario seems to be that the S&P 500 will retest last year’s October 21 closing low of 3577.03. Their pessimistic scenarios send the index down to 3000 or even lower.
The answer is that the economy has been remarkably resilient to the 500bps hike in the federal fund rate since early last year. It did trigger a financial crisis in mid-March, but that crisis seems to have been contained by the Fed. It hasn’t turned into an economy-wide credit crunch and recession, so far. In addition, investors seem to believe that the Fed is almost done tightening. Even if the central bank raises the federal funds rate by 25bps to 5.00%-5.25% at the FOMC’s May 2-3 meeting and keeps it there for a while, the economy will continue to grow, albeit slowly, while inflation continues to moderate, albeit slowly, but surely.
In this scenario, investors have nothing to fear but the “X-Day” for the federal debt ceiling impasse. If there is no deal in Washington by that day, the US will be in technical default. In this scenario, stock prices might plunge, causing our leaders to scramble to work out a deal quickly.
There may be more compelling fundamental support for the stock market. Joe has been tracking the percent of S&P 500 companies with positive three-month percent changes in forward revenues and forward earnings (Fig. 1 and Fig. 2). (FYI: “Forward” revenues and earnings are the time-weighted average of analysts’ consensus estimates for the current and following years.)
Both data series are weekly and start in 1998. Both tend to fluctuate around 80% during economic expansions. Both dive toward 50% and lower during recessions. So far, both seem to have bottomed around 50% at the end of last year without an actual recession transpiring. As of the April 21 week, the forward revenues series was back up to 72.5%, and the forward earnings series was at 61.6%.
These numbers suggest that industry analysts have turned more upbeat about the prospects for both earnings and revenues since the start of the year, notwithstanding the cacophony of the nattering nabobs of negativism. Confirming the positivism of the analysts are April’s flash PMIs compiled by S&P Global for manufacturing and nonmanufacturing industries in the US. Both have been rising in recent months, with the former up to 50.4 (the highest since October) and the latter up to 53.7 (the highest since last April) (Fig. 3 and Fig. 4).
US Economy I: Proceed With Caution. The cover of the economy’s playbook is neither green nor red. Economic growth is neither accelerating nor decelerating. It is just rolling along in a way consistent with our rolling recession scenario. So color the economy beige.
The Fed’s latest Beige Book was released last Wednesday, April 19. It represents an attempt to get a grassroots perspective on the economy, as described on the Fed’s website: “Each Federal Reserve Bank gathers anecdotal information on current economic conditions in its District through reports from Bank and Branch directors and interviews with key business contacts, economists, market experts, and other sources. The Beige Book summarizes this information by District and sector. An overall summary of the twelve district reports is prepared by a designated Federal Reserve Bank on a rotating basis.”
According to the latest report, “Expectations for future growth were mostly unchanged as well; however, two districts saw outlooks deteriorate.” In addition, “[c]ontacts expected further relief from input cost pressures but anticipated changing their prices more frequently compared to previous years.”
The Fed’s latest read on the state of the economy provides a snapshot of the economy and financial system in the aftermath of the mid-March failure of two large regional banks that shook confidence in the US banking sector and prompted an emergency response from the Fed, the FDIC, and the US Treasury to contain the fallout.
Overall, the economy seems to remain on the same muddling-along trajectory as before the crisis. Credit conditions were mixed. In the San Francisco Fed district, where failed Silicon Valley Bank was located, “lending activity fell significantly in recent weeks amid higher interest rates and elevated uncertainty in the banking sector,” the report said. On the other hand, the Chicago Fed reported “little change in credit availability.” The Cleveland Fed noted that the banking situation “had limited impact on recent business activity.”
Similarly, the latest Beige Book painted a mixed picture of inflation: “Overall price levels rose moderately during this reporting period, though the rate of price increases appeared to be slowing. Contacts noted modest-to-sharp declines in the prices of nonlabor inputs and significantly lower freight costs in recent weeks.” However, “[c]onsumer prices generally increased due to still-elevated demand as well as higher inventory and labor costs.”
Overall, “[w]ages have shown some moderation but remain elevated. Several Districts reported declining needs for off-cycle wage increases compared to last year.”
The Richmond Fed reported, “Trucking firms stated that in response to lower freight volumes, they were still adding drivers, but they had scaled-back recruiting and were being very selective in hiring.” Several other districts reported similar developments in the trucking industry.
The report’s mixed messages add up to a beige light, rather than either a red or green light, for the economy. The primary message that we think the Fed should take away from this report is to proceed with caution. The Fed should ease up on the monetary brakes.
Let’s not forget that the minutes of the March 21-22 FOMC meeting observed: “For some time, the forecast for the U.S. economy prepared by the staff had featured subdued real GDP growth for this year and some softening in the labor market. Given their assessment of the potential economic effects of the recent banking-sector developments, the staff’s projection at the time of the March meeting included a mild recession starting later this year, with a recovery over the subsequent two years.”
On inflation, the Fed staff’s inflation forecast was 2.8% this year, with core inflation at 3.5%. Furthermore, “[c]ore goods inflation was projected to move down further this year and then remain subdued; housing services inflation was expected to peak later this year and then move down, while core nonhousing services inflation was forecast to slow gradually as nominal wage growth eased further.”
We agree with the staff’s outlook. The question is whether the FOMC’s members are on the same page. They weren’t at their last meeting because they proceeded without caution, making a 25bps hike in the federal funds rate. That was barely two weeks after the banking crisis hit on March 10.
US Economy II: Meet the Real Nominal Federal Funds Rate. Last summer, the Fed started its second quantitative tightening (QT2) program, which allowed maturing securities simply to roll off its balance sheet with no reinvestment of the proceeds. The Fed’s holdings of securities peaked at a record $8.5 trillion during the week of May 18, 2022 (Fig. 5). At the time, Melissa and I argued that QT was equivalent to a hike in the federal funds rate. We just didn’t know if it amounted to a 25, 50, 75, or 100bps hike in the federal funds rate.
Now we are arguing that the banking crisis, or more specifically the tightening of lending standards it caused, equates to a similarly unknown hike in the federal funds rate. Fed officials were readily able to justify QE2 as an effective cut in the federal funds rate in 2010. That’s when the Fed’s econometric model indicated that the federal funds rate should be lowered from zero to minus 75bps. The model showed that Fed purchases of $600 billion in US Treasuries effectively would equate to this negative level of the federal funds rate.
We haven’t heard anything from Fed officials about their econometric model since then. Why aren’t they running it to assess the impact of QT2 and the banking crisis on the effective federal funds rate?
Four staff economists at the San Francisco Fed have done so. They published an article titled “Monetary Policy Stance Is Tighter than Federal Funds Rate” in the November 7, 2022 issue of the FRBSF Economic Letter. Their model calculates an effective federal funds rate (EFFR) using a set of 12 financial variables, including Treasury rates, mortgage rates, and borrowing spreads, to assess the broader stance of monetary policy. Here is their conclusion:
“The FOMC’s use of forward guidance provides more information about future policy than what is reflected in the federal funds rate alone. Similarly, the use of the balance sheet has a monetary policy impact that is not captured in the federal funds rate. A proxy funds rate based on financial conditions measures the broader stance of policy and suggests that these combined policy tools have a more complex effect on the economy than the federal funds rate indicates. The stance of monetary policy in September 2022 was conducted as if the policy rate was above 5¼%, as opposed to the actual rate of 3-3¼%. As the FOMC increasingly used forward guidance and the balance sheet, the proxy rate has tended to lead the actual funds rate, reflecting the fact that financial markets are forward looking.”
The monthly EFFR was almost identical to the actual federal funds rate (FFR) prior to December 2008 when the rate first fell to zero (Fig. 6). During the period from 2009-15—which included QE1, QE2, and QE3—the EFFR was negative most of the time (Fig. 7). The EFFR has consistently exceeded the FFR since October 2021 (Fig. 8).
Where are we now? As of March, the EFFR was 6.27%, well above the FFR’s reading of 4.65%. (The data are updated here.)
Yalies Yelling
April 24 (Monday)
Check out the accompanying pdf and chart collection.
Executive Summary: Banks were tightening lending standards before the banking crisis, and the crisis has escalated that. We don’t think a credit crunch will ensue, though we’re monitoring the situation closely. But we agree with Treasury Secretary Yellen that banks’ tightening of credit conditions effectively can substitute for further Fed tightening. … To monitor the crisis, we keep tabs on the Fed’s assets and liabilities, commercial banks’ assets and liabilities, and particularly the amount of loans being made by both. … Also: Dr. Ed reviews “A Spy Among Friends” (+ + +).
YRI Weekly Webcast. Join Dr. Ed’s live webcast with Q&A on Mondays at 11 a.m. EST. You will receive an email with the link one hour before showtime. Replays of the weekly webcasts are available here.
The Fed I: Cri de Coeur. US Treasury Secretary Janet Yellen and I have a lot in common. Our last names start with “Y.” I worked at the Fed and the US Treasury Department many years ago. She was Fed chair prior to her current position at Treasury. We both have PhDs from Yale’s graduate school of economics. Professor James Tobin chaired both our dissertation committees. She graduated in 1971. I graduated in 1976. Yellen took such meticulous notes in Tobin’s macroeconomics class that they became the unofficial textbook for future graduate students. I studied from those Xeroxed notes.
On the other hand, Yellen tends to be a liberal, while I tend to be a conservative. Nevertheless, we currently both agree that the Fed should stop raising interest rates. On April 15, in a “Fareed Zakaria GPS” interview, she said the following about the current banking crisis: “Banks are likely to become somewhat more cautious in this environment. We already saw some tightening of lending standards in the banking system prior to that episode, and there may be some more to come.” She said that the crisis would lead to a restriction in credit in the economy that “could be a substitute for further interest rate hikes that the Fed needs to make.”
Nevertheless, Yellen added that the Fed’s response to the crisis had caused “deposit outflows to stabilize … And things have been calm.” She said she was not yet seeing anything “dramatic enough or significant enough” in this area to alter her economic outlook. “So, I think the outlook remains one for moderate growth and [a] continued strong labor market with inflation coming down,” she said.
As Treasury secretary, the former Fed chair meets regularly with Fed Chair Jerome Powell. She undoubtedly has shared her views about monetary policy under the current circumstances with her replacement. Powell was a governor at the Fed when Yellen was the chair.
The next meeting of the Fed’s Federal Open Market Committee (FOMC) will be held May 2-3. Whether the committee votes for another 25bps hike in the federal funds rate at this meeting or not, Melissa and I expect Powell to say at his post-meeting press conference that the committee is likely to pause rate hiking for a while since the federal funds rate is clearly in “restrictive” territory given the banking crisis, which is tightening lending standards further. Continuing to raise interest rates would risk converting a banking crisis that’s been contained so far into an economy wide credit crunch.
Last week, on Wednesday, March 19, Federal Reserve Bank of New York President John Williams, who is a voting member of the FOMC, said that “inflation is still too high” and that the Fed will act to lower it. However, he also acknowledged that the recent stress in the banking sector will likely weigh on economic activity: “Conditions in the banking sector have stabilized, and the banking system is sound and resilient.” But he added that the troubles are bound to make credit more expensive and harder to get, which in turn will depress growth. “It is still too early to gauge the magnitude and duration of these effects, and I will be closely monitoring the evolution of credit conditions and their potential effects on the economy,” Williams said.
The Fed II: Watching the Fed’s Loans. Melissa and I also are monitoring the evolution of the banking crisis very closely. It appears to be contained so far. We are watching the weekly H.4.1 report showing the Fed’s assets and liabilities and the weekly H.8 report showing the assets and liabilities of the commercial banking system. The former, which is released on Thursdays, showed that the Fed’s total assets edged down to $8.7 trillion during the April 19 week after rising since early March when banks scrambled to borrow from the Fed’s liquidity facilities to offset deposit outflows during the SVB-induced banking crisis (Fig. 1).
Meanwhile, the Fed’s QT (quantitative tightening) program continues apace as maturing securities roll off the Fed’s balance sheet. Total securities held outright by the Fed fell $635 billion since the amount peaked in mid-May 2022 down to $7.9 trillion as of the April 19 week. The Fed’s holdings of Treasuries and agency debt plus mortgage-backed securities are down $494 billion and $141 billion over this period (Fig. 2).
The Fed’s holdings of total loans to the banking system spiked up dramatically during March as the banks scrambled to borrow at the discount window (a.k.a. “primary credit” in the H.4.1) and through the new Bank Term Funding Program (BTFP) (Fig. 3). These loans have edged down slightly over the past two weeks, as borrowing at the discount window declined sharply while BTFP borrowing leapt. “Other credit extensions” has remained elevated, as the FDIC needs the funds to work out the resolution of the SVB and Signature Bank implosions.
The Fed III: Watching the Commercial Banks. The Fed’s latest H.8 report is jampacked with weekly data on commercial bank credit, securities, loans, deposits, and borrowings. Let’s review the latest developments through the April 12 week (Fig. 4):
(1) Bank assets. Over the past five weeks, bank credit is down $239.3 billion including a $22.7 billion decline during the April 12 week. Over this same period, securities are down $225.0 billion including a decline of $36.5 billion during the latest week, while loans are down $14.4 billion including a $13.8 billion increase during the latest week (Fig. 5).
(2) Bank liabilities. Over the past five weeks, deposits are down $422.4 billion including a $76.2 billion drop in the latest week, while borrowings are up $480.8 billion including a $29.3 billion increase during the latest week.
The Fed IV: Watching Bank Loans. Of course, the most important item on banks’ balance sheets for assessing a looming credit crunch is their loan portfolios. The H.8 release provides this information for various types of loans. To monitor them on a weekly basis, Mali Quintana and I have compiled Commercial Bank Loans to supplement our Commercial Bank Book chart publication. Here are some of our findings:
(1) Commercial & industrial (C&I) loans. While C&I loans are down $32.6 billion over the past five weeks through April 12, they remain near their all-time high of $3.1 trillion the week of May 13, 2020 (Fig. 6).
(2) Commercial real estate (CRE) loans. Widespread concerns about a CRE crash may be starting to weigh on CRE lending by the banks. These loans peaked at a record $2.9 trillion during the March 15 week and are down $35.3 billion since then through April 12 (Fig. 7).
Within this category, construction, multi-family property, and nonfarm nonresidential properties loans are all looking toppy relative to their recent record highs (Fig. 8, Fig. 9, and Fig. 10).
(3) Residential real estate (RRE) loans. RRE loans rose to a record high of $2.5 trillion in late March and remain around that level currently (Fig. 11). That’s quite surprising given that housing has been in a recession since early last year. Then again, these loans rose even during the Great Financial Crisis!
(4) Consumer loans. Consumer loans rose to a record high on April 12 (Fig. 12). The same can be said about consumer credit card loans (Fig. 13). Auto loans have stalled near their record high around $520 billion since October (Fig. 14).
(5) Bottom line. There’s no sign of a credit crunch in bank loans so far. However, the banking crisis is relatively young, having started in early March, and lending terms undoubtedly have tightened already. It ain’t over until it’s over.
Movie. “A Spy Among Friends” (+ + +) (link) is a fascinating docudrama about Kim Philby, the British double agent who defected to the Soviet Union in 1963 after spying for the KGB in London and Washington since World War II. His close friend and colleague was Nicholas Elliott, who was aghast to learn that Philby was a traitor for so many years. The two of them were members of an elite group of spies who worked for MI6. Elliott, played flawlessly by Damian Lewis, is determined to protect his old-boy network of British spies while also punishing his friend for his duplicity.
Health Care, Financials & Hydrogen
April 20 (Thursday)
Check out the accompanying pdf and chart collection.
Executive Summary: Two of the S&P 500’s 11 sectors have staged impressive comebacks in recent weeks, Financials and Health Care. Jackie tells their laggards-to-leaders stories. … Also: Large banks’ sharp y/y increases in net interest income are making up for weaker areas of their business, enabling happy Q1 earnings surprises for some. NII gains likely peaked in Q4, but a reopening of the capital markets could help the industry as 2023 progresses. … And in our Disruptive Technologies segment: EVs have been heralded as the cars of the future, but it might be hydrogen powered cars that go the distance.
Strategy: April Brings Rotation. April showers are supposed to bring May’s flowers, but April in New York has been relatively dry, forcing us to water our wilting flowers. April did bring fortifying rotation to the stock market. The S&P 500 Financials and Health Care sectors, which are among the worst performing S&P 500 sectors on a ytd basis, have suddenly sprung up in recent weeks, outperforming every other S&P 500 sector except Energy.
Here’s the performance derby for the S&P 500 and its sectors for April to date, through Tuesday’s close: Energy (4.7%), Financials (3.7), Health Care (3.0), Utilities (1.8), Consumer Staples (1.6), Materials (1.3), S&P 500 (1.1), Communication Services (1.0), Industrials (-0.1), Real Estate (-0.2), Information Technology (-0.7), and Consumer Discretionary (-0.9) (Fig. 1).
That’s quite a turnaround for Financials and Health Care, which land dead last and third to last, respectively, viewed through a wider ytd lens: Communication Services (21.4%), Information Technology (20.6), Consumer Discretionary (14.7), S&P 500 (8.2), Materials (5.1), Industrials (2.9), Consumer Staples (1.7), Real Estate (0.9), Energy (-1.1), Health Care (-1.8), Utilities (-2.3), and Financials (-2.6) (Fig. 2).
Boosting the Health Care sector this month have been its Managed Health Care (6.5%), Pharmaceuticals (4.1), and Health Care Facilities (3.5) industries. Financials has been getting a hand from its Diversified Banks (7.1%), Insurance Brokers (5.4), and Life & Health Insurance (4.1) industries.
Let’s take a look at some of the recent news flow that may be breathing life into these two sectors.
(1) Pharma making deals. There’s been a raft of recent M&A deals driven by large pharmaceutical companies looking to refill their pipelines by buying biotechnology companies. Merck announced on Sunday that it will buy Prometheus Biosciences, an autoimmune drug developer, for $10.8 billion. Merck is looking to boost its pipeline to prepare for Keytruda’s patent expiration around 2028. Prometheus has drugs for ulcerative colitis and Crohn’s disease that soon should enter late-stage trials.
Other recent drug deals include Pfizer’s plan to buy Seagen, a biotechnology company developing cancer drugs, for $43 billion. Amgen acquired autoimmune drug developer Horizon Therapeutics in December for $27.8 billion. Merck also bought blood-cancer drug developer Imago BioSciences for $1.4 billion in January.
The iShares Biotechnology ETF (IBB) had been down 7.1% ytd back on March 10 but after a rebound is now (as of Tuesday’s close) up 1.0% ytd. The S&P 500 Biotechnology stock price index, which has larger constituents, is down 0.9% ytd through Tuesday’s close (Fig. 3). The industry’s earnings are expected to fall 21.8% this year and increase only 4.0% in 2024 (Fig. 4). The industry’s forward P/E has risen to 16.5, up from its 2019 low of 9.6 (Fig. 5).
The S&P Pharmaceuticals stock price index is down 5.2% ytd through Tuesday’s close (Fig. 6). Its earnings are expected to fall 15.8% this year before leaping 11.0% next year (Fig. 7). The industry’s forward P/E is a below-market 15.1 (Fig. 8).
(2) DC news helps Managed Health Care. The S&P 500 Managed Health Care industry had a tough start to the year, with its price index falling 13.0% through March 10. But it since has rebounded and is now down only 5.5% ytd.
The turnaround owes much to a March 31 announcement that the “Centers for Medicare and Medicaid Services will reimburse private insurers that administer Medicare plans at a higher rate in 2024 than analysts expected,” an April 11 WSJ article reported. “Additionally, new rules that could eventually reduce payments from the government to insurance companies will be phased in more slowly than originally planned.”
This news was followed by UnitedHealth Group’s announcement that Q1 earnings rose 14% y/y to $6.26 a share, above analysts’ $6.16 consensus. Revenue climbed as well, by 14.7% to $91.9 billion. Management increased its 2023 adjusted earnings forecast to $24.50-$25.00 per share from $24.40-$24.90.
The company’s shares have fallen 4.1% since the report hit the tape, giving back some of their gains after the Medicare news, on investor concerns about rising expenses as more people use diabetes drugs for weight loss and as consumers continue to catch up on medical procedures postponed during the pandemic.
The S&P 500 Managed Health Care industry is expected to grow revenue by 6.9% this year and 5.3% in 2024 (Fig. 9). Earnings are forecast to climb 12.1% in 2023 and 13.2% in 2024 (Fig. 10). The industry’s forward P/E of 17.7 has come down from its recent high of 21.4 during the April 21, 2022 week (Fig. 11).
Financials: Loans Save the Day. Large banks with sticky deposits and lots of floating-interest-rate loans on their books had a great Q1, as their loans repriced at higher rates than their deposits. Net interest income (NII)—the difference between what banks earn on their loans and investments and what they pay out on their deposits and other funding—has been rising sharply since Q1-2021. That helped both JPMorgan and Bank of America report surprisingly strong Q1 earnings, as their sharp NII increases more than offset drags from their reserve increases and drops in their investment banking activity.
NII jumped to $179.9 billion in Q4 at FDIC-insured institutions, up 31% y/y and up 40% from its low in Q3-2020 (Fig. 12). Here are Jackie’s takeaways from the recent earnings reports of Bank of America, Morgan Stanley, Goldman Sachs, and Charles Schwab:
(1) B of A flexes. Bank of America’s huge loan book and fixed-income trading desk allowed it to report strong Q1 revenue and earnings growth that beat analysts’ consensus estimates.
B of A’s Q1 revenue grew by $3.1 billion, or 13% y/y, to $26.3 billion, propelled by the $2.9 billion, or 25%, y/y jump in NII to $14.4 billion. An 8.5% y/y jump in sales and trading revenue helped as well. These two areas of strength allowed the bank to offset its $931 million provision for credit losses in the quarter and 20% drop in investment banking fees to $1.2 billion. As a result, the bank’s net income rose 15% y/y to $8.2 billion, and its diluted earnings per share of 94 cents beat analysts’ 82 cents consensus estimate.
The comparisons to year-ago NII levels will get much tougher during H2, given that NII may have peaked in Q4. Here’s B of A’s NII progression over the past five quarters: Q1-2023 ($14.5 billion), Q4-2022 ($14.7 billion), Q3-2022 ($13.8 billion), Q2-2022 ($12.4 billion), and Q1-2022 ($11.6 billion). In general, banks may be forced to continue raising the rates they offer on deposits, especially as smaller banks look to keep their depositors from fleeing to larger banks and as upstarts like Apple try to disrupt the industry by luring customers with a 4.15% interest rate on savings accounts. If rates on deposits climb faster than rates on loans, that will pressure NII.
Bank of America’s Q1-2023 NII actually fell compared with the Q4-2022 level. Likewise, the bank’s revenue fell on a q/q basis in three of its four segments: Consumer Banking, Global Wealth Investment Management, and Global Banking. The only segment that had a jump in revenue q/q was Global Markets. Its revenue was $5.6 billion in Q1, up from $3.9 billion in Q4. Behind the gain was a jump in Fixed Income Currencies and Commodities (FICC) sales and trading revenue to $3.4 billion, up from $2.3 billion in Q4. Bond traders saved the day.
Bank of America shares were up less than 1.0% on Tuesday, when it reported its earnings, but they had jumped on Friday after JPMorgan reported a strong quarter. For the week through Tuesday’s close, the shares are up 6.4%. Ytd through Tuesday’s close, the shares have lost 7.7%.
B of A and JPMorgan are both members of the S&P Diversified Banks stock price index, which is down 0.3% ytd (Fig. 13). Analysts have modest expectations for the industry, forecasting revenue growth of 6.4% this year and 0.7% in 2024 (Fig. 14). Earnings are expected to grow a touch faster, by 7.2% this year and 4.3% in 2024 (Fig. 15). At 8.7, the industry’s forward P/E hasn’t been so low except when some crisis has gripped the market (Fig. 16).
(2) Brokers have a tougher time. Without a large banking operation, firms like Morgan Stanley and Goldman Sachs have been at the mercy of the markets. The M&A business has been painfully quiet in recent months as few CEOs are willing to pull the trigger on large deals during uncertain times. And the Fed’s interest rate hikes have put a damper on the bond and stock markets.
At Morgan Stanley, Q1 investment banking revenue fell 24% y/y and trading revenue fell 13%, partially offset by a 10% jump in wealth management revenue. Net net, the firm’s earnings per share dropped to $1.70 from $2.02 a year ago, but Morgan Stanley shares have risen 5.6% over the past week as results beat expectations.
At Goldman Sachs, investment banking revenue fell 27% y/y, equity underwriting revenue dropped 8%, and debt underwriting declined 32%. The investment bank’s FICC business lost 17%, and its equities trading business dropped 7%. Altogether, the global banking and markets’ revenue dropped 16% to $8.4 billion. The segment’s revenue was up 30% compared to Q4 when revenue in equity and fixed-income trading were even weaker.
Goldman’s results were also helped by its Asset & Wealth Management division, where revenue jumped 24% to $3.2 billion. Results would have been even stronger were it not for the $470 million loss related to the partial sale of the Marcus loans portfolio and the transfer of the remaining portfolio to the held-for-sale category. The loss was partially offset by a $440 million reserve reduction. Goldman Sachs shares fell 1.7% on Tuesday after the earnings were released, and they’re down 2.8% ytd. But at $339.91, they’re well off their lows of $279.79 hit last June.
Schwab does have a bank, but it hasn’t benefited the firm in recent quarters because some depositors have fled for higher interest rates elsewhere. Deposits have fallen 30.1% y/y, from $465.8 billion in Q1-2022 to $325.7 billion last quarter. Deposit flight has outpaced the rate that securities held by the bank have been maturing. As a result, Schwab has had to borrow between $10 billion to $30 billion a quarter from the Federal Home Loan Bank at an interest rate of about 5%, Michael Wong of Morningstar wrote on Tuesday. He expects the company’s earnings will decrease in the next few quarters until this dynamic changes.
Wall Street analysts are forecasting earnings per share of 78 cents in Q2 and 77 cents in Q3, down from the 93 cents earned in Q1-2023 and $1.07 in Q4-2022. Three months ago, analysts were much more optimistic, forecasting $1.14 in Q2 and $1.22 in Q3.
The positive news is that the firm’s active brokerage accounts and banking accounts are at recent highs. All in, Schwab’s revenue jumped y/y but fell 7% q/q. Likewise, its net income of $1.5 billion jumped 20% y/y but fell 16% q/q. Schwab shares rallied 6.4% Monday and Tuesday after the earnings release, after which they were still down a lot ytd, 35.1%.
Goldman, Schwab, and Morgan Stanley are part of the S&P 500 Investment Banking & Brokerage stock price index, which is down 11.5% this year through Tuesday’s close (Fig. 17). Analysts are forecasting strong rebound for the industry next year, with 2024 revenue up 6.5% versus a projected 3.9% in 2023 and earnings up 18.7% next year versus 6.1% this year (Fig. 18 and Fig. 19). At 11.1, the industry’s forward P/E is down from its highs but still above the single-digit levels seen during market crises (Fig. 20).
Disruptive Technologies: Hydrogen Vehicles Get a Second Look. Electric vehicles (EVs) might have all the buzz, but some believe hydrogen fueled vehicles will dominate the future of car transportation. Today’s H2-powered cars use fuel cells that convert hydrogen into electricity to propel cars. Proponents say that, compared to EVs, hydrogen powered cars have longer travel range, operate better in extreme temperatures, refuel much faster, and have smaller batteries that use less cobalt, nickel, and lithium. The downsides are that hydrogen fueling stations are limited to a handful in California, and to be truly “green,” hydrogen production relies on solar or wind power.
Toyota recently captured industry headlines with a concept car boasting a combustion engine that runs on hydrogen. Let’s take a look at what the auto giants are dreaming up:
(1) Toyota’s in the race. Toyota’s concept vehicle, the Corolla Cross H2, has a V3 hydrogen combustion engine. BMW produced the first such vehicles in 2002 and 2005, but they were highly flammable and emitted nitrous oxide.
Toyota’s Corolla Cross H2 has thick armored fuel tanks to store the H2 to prevent fire, explains this video from Car Maniacs. Toyota has also brought down the vehicle’s cost of production. While the Corolla Cross H2 isn’t currently available for sale, Toyota does offer the Mirai, a hydrogen fuel cell powered vehicle that can travel 402 miles on a tank of hydrogen.
(2) BMW’s in the race. BMW is also experimenting with cars powered by hydrogen fuel cells, planning to produce roughly 100 of them this year. These iX5 FCVs will be used as a “demonstration fleet for various regulatory bodies and marketing endeavors,” a February 27 article in Car and Driver reported. The model is expected to travel 260 miles on a tank of hydrogen, and refueling takes just minutes as for a gasoline-fueled car. Many of the core fuel cell elements come from its fuel cell partner Toyota.
(3) Hyundai’s in the race. Hyundai introduced its hydrogen fuel cell powered concept car, the N 74 Vision, in 2022. The snazzy two-door sports car can accelerate from zero to 62 mph in just four seconds and can travel as fast as 155 mph. An April 8 Top Speed article speculated that the model may roll off factory assembly lines in three to four years. The company does sell the more mundane Nexo hydrogen fuel cell crossover in California.
(4) Honda’s in the race. Honda plans to introduce a hydrogen fuel cell powered version of the CR-V next year in North America and Japan, a February 8 article in Car and Driver reported. The H2 CR-V’s fuel cell system is co-developed with GM, and the car can be plugged in and run for short distances on electricity.
(5) GM’s in the race. General Motors is developing medium-duty trucks equipped with GM hydrogen fuel cell technology, but they aren’t expected to launch until after 2025, a December 2, 2022 article in GM Authority reported. The trucks may also contain a large electric battery pack, allowing them to run on either energy source or to supply electricity to an external piece of equipment.
Construction, MegaCap-8 & Financials
April 19 (Wednesday)
Check out the accompanying pdf and chart collection.
Executive Summary: Even as the rolling recession rolls through segments of the real estate market, areas of the construction industry have never been stronger. Residential construction isn’t one of them, but nonresidential and public construction each hit new record highs in February. Construction industry employment did the same in March. … Also: If industry analysts’ forecasts are on the mark, the eight MegaCap-8 companies that exert outsized influence over the S&P 500’s performance can look forward to a rebound of their collective y/y earnings comparisons starting in Q2-2023. … And: The S&P 500 Financials sector’s growth prospects improved overnight when the Transaction & Payment Processors industry was added. Joe takes a look.
US Economy: Construction on a Roll. The rolling recession is likely now to be rolling into the commercial real estate sector and possibly into the multi-family housing sector. But it may also be rolling out of the single-family housing sector. Meanwhile, there’s plenty of construction of nonresidential structures going on, excluding commercial ones. The outlook for public construction remains bright. Consider the following:
(1) Commercial. The banking crisis that started in early March may mean more bad news for the commercial real estate industry (CRE). The pandemic caused lots of workers to work from home. Many of them liked the experience so much that they don’t want to go back to the office. Many companies have downsized their offices, leaving enough space that their employees can at least get together for group meetings and interactions on an occasional basis. So lots of office buildings are vacant.
All commercial banks held a record $2.9 trillion in CRE loans as of April 5, up $284.2 billion on a y/y basis (Fig. 1). Large and small domestically chartered banks along with foreign-related banks held $0.8 trillion, $1.9 trillion, and $0.1 trillion in such loans. On a y/y basis, they are up $20.6 billion, $252.7 billion, and $11.0 billion (Fig. 2).
Senior loan officers surveyed by the Fed every quarter were already tightening lending standards significantly on CRE loans at the end of last year (Fig. 3). As a result, the demand for such loans weakened significantly at the end of last year, according to the same survey (Fig. 4). That was before the banking crisis, which undoubtedly tightened lending standards for CRE loans further.
(2) Nonresidential excluding commercial. Commercial construction put-in-place totaled $123 billion (saar) during February, down slightly from January’s record high (Fig. 5). It accounted for 20.4% of total nonresidential construction during February. Even if it weakens in coming months, construction of manufacturing structures—which totaled a record $140 billion during February—should continue to move higher thanks to onshoring by many companies and the building of semiconductor plants subsidized by the federal government.
Meanwhile, also at record highs are construction of health care and transportation facilities.
(3) Public. Also receiving a big boost from federal spending is infrastructure construction. We can see that in the record (or near-record) highs in construction put-in-place of highways and streets, sewage & waste disposal, water supply, and health care facilities (Fig. 6).
Before turning to residential construction, let’s compare some of the construction numbers. Total construction put-in-place rose to a record $1.8 trillion (saar) in February (Fig. 7). That’s despite soaring interest rates and tightening lending standards.
Residential construction fell in February to $852 billion (saar), down 9.8% from its record high during May 2022 (Fig. 8). Nonresidential and public construction each rose to their new record highs during February, i.e., $601 billion and $391 billion. So together, they exceeded residential construction.
(4) Residential. Residential construction consists of single-family and multi-family units as well as spending on home improvements (Fig. 9). Single-family construction is down 23.4% from its record high during April 2022 to $368 billion during February. Multi-family construction rose to a record $123 billion that month.
Still near its record high was home improvements at $361 billion during February. It is now as big as construction spending on single-family homes! It has soared since the pandemic, which caused more people to spend more time at their homes. (Just try finding a construction crew!)
Tighter lending conditions already have depressed single-family housing starts, but they may be bottoming now that mortgage rates have declined from their October 2022 peaks (Fig. 10). Multi-family construction may soon be moderated by tighter lending standards and easing rent inflation.
(5) Construction employment. The construction market is proving to be more resilient than in the past when credit conditions tightened. That’s evident in the construction industry’s payroll employment headcount, which rose to a record high during March (Fig. 11).
Strategy I: Spring for MegaCap-8 Earnings. In our April 12 Morning Briefing, titled “Bulls vs Bears,” Joe reviewed the MegaCap-8 group of stocks (i.e., Alphabet, Amazon, Apple, Meta, Microsoft, Netflix, Nvidia, and Tesla). He discussed how these companies’ cost-cutting has helped to spur nascent recoveries in their collective market capitalization, forward earnings, and forward profit margin this year to date. However, the group was then and still is expected to see Q1-2023 earnings decline markedly.
Below, Joe updates his review, summarizing the group’s past quarterly earnings growth performance and expanding on their outlooks for Q1-2023 and the remaining quarters of the year.
(1) Peak and trough earnings growth rates. The MegaCap-8 recorded positive quarterly earnings growth during the shutdown of the US economy and benefitted tremendously from its re-opening as businesses and consumers transitioned to a post-Covid19 work/life balance. The group’s float-adjusted earnings growth quickly rose from a trough of 3.8% y/y during Q1-2020 to a peak of 107.2% in Q1-2021 and slowed over the next four quarters through Q1-2022. Their y/y earnings growth rate first turned negative during Q2-2022 and probably bottomed at -17.9% during Q4-2022, when Tesla was the only MegaCap-8 component with positive growth.
Analysts’ consensus Q1-2023 earnings forecasts for the eight companies suggest a fourth straight quarter of y/y earnings declines for the group collectively, but this time the drop should be a more moderate 11.3%. Microsoft headlines the group in Q1 as the sole y/y gainer, while Tesla’s earnings are forecasted to be down for the first time since before the pandemic.
(2) Return to positive y/y growth comparisons just around the bend. If the analysts are right, then the worst of the MegaCap-8’s y/y earnings growth comparisons already occurred in Q4-2022. They’re expecting 9.5% growth in Q2-2023, with all but Meta and Netflix improving y/y. Again assuming that the analysts are right, Q2-2023 would mark the MegaCap-8’s first positive contribution to S&P 500 quarterly earnings growth since Q1-2021.
Looking ahead to Q3- and Q4-2023, the MegaCap-8’s y/y earnings growth is expected to improve to 18.2% and 28.2%, with all of the companies except Tesla participating in the rebound.
Strategy II: Financials Get Growth Hormone. Athletes use steroids to make them stronger, but that has the impact of making them bulkier and slower. On the other hand, HGH (human growth hormone) fuels growth and maintains tissues and organs through life.
The addition of the Transaction & Payment Processors (TPPS) industry to the Financials sector on March 20 is like a shot in the arm of HGH, improving the sector’s long-term growth prospects and profitability. As GICS classifications changes go, it was the biggest one that S&P and MSCI had made since the Telecommunications sector was reconstructed in September 2018.
(1) A big boost to the sector’s market cap. The addition of TPPS to the Financials sector was stunning, boosting its market capitalization by 26% to $4.3 trillion. At $885 billion on March 20, TPPS’ market cap approached the $929 billion market cap of the Diversified Bank industry, the biggest in the Financials sector.
Visa and Mastercard together accounted for 90% of TPPS’ market capitalization, a lot higher than the 62% combined market-cap share of Diversified Bank’s two weightiest constituents, JPMorgan Chase and Bank of America.
(2) Resetting Financials’ margin and LTEG. Following the addition of TPPS, Financials’ forward profit margin reset 1.0ppt higher to 18.5% from 17.5%. Since then (through the April 6 week), Financials’ margin edged down to 18.4%, while TPPS’ margin was unchanged at 32.8%.
An even more stunning reset from the TPPS addition was the jump in the Financials sector’s expected long-term earnings growth (LTEG)—i.e., five-year forward consensus earnings growth. It improved overnight on March 20 from 6.0% to 8.6%. With an LTEG forecast of 16.1%, TPPS’ long-term prospects top those of all other Financials sector’s industries.
(3) Financials’ future brighter than before? Just before the Fed began its current rate-hike cycle in March 2022, Financials’ forward profit margin was 18.7%, just 1.1ppts short of its record-high 19.8% hit during August 2021 (Fig. 12). One year later, by the March 16 week of this year, the sector’s margin had fallen 1.2ppts to 17.5% due to declining earnings from sharply higher interest rates as well as the stock market downturn and the IPO market collapse in 2022.
However, this period of margin contraction for the sector was relatively mild compared to those during the GFC and GVC (Great Financial Crisis and Great Virus Crisis), when Financials’ forward profit margin fell to around 5% and 13%, respectively. We believe the addition of TPPS to the sector should help to stabilize its profit margin until the economy improves and send it to new highs during the next growth cycle.
Strategy III: Trader’s Corner. We checked in with Joe Feshbach last weekend to hear his latest thoughts on the stock market. Joe writes: “The S&P 500 is approaching its early February highs. While it may exceed them, I believe the bulk of this rally is behind us now. I suggest building up some defensive reserves for a better opportunity down the road. The sentiment measures just don’t support meaningful upside from here. Furthermore, the widely spoken about tech rally looks to me, chartwise, to be about 90% done.”
Pandemic Pandemonium
April 18 (Tuesday)
Check out the accompanying pdf and chart collection.
Executive Summary: The pandemic effectively accelerated the latest business cycle. Government interventions including lockdowns, rent moratoriums, stimulus payments, and ultra-easy monetary policy altered the behavior of economic actors including businesses, workers, consumers, landlords, tenants, home buyers, and home sellers. The result was a business cycle on warp speed. … Pandemic-altered consumer behavior escalated inflation, first for goods and then for services. … That disproves the theory that inflation is simply a monetary phenomenon, fully within the Fed’s power to control.
Weekly Webcast. If you missed Monday’s live webcast, you can view a replay here.
Pandemic I: Reunion. I have one wife, five kids, two granddaughters, one mother-in-law, two sons-in-law, and three dogs. We had a family reunion this past weekend at our house on Long Island to celebrate the birthday of our nine-year-old granddaughter. Seven of us (not counting the dogs) spent March and April 2020 locked down in this house during the pandemic. And we all got along very nicely. So during our latest reunion, we reminisced about the experience. It certainly affected all our lives and still does in some ways.
Three years ago, we titled our April 27, 2020 Morning Briefing “The Twilight Zone: Where Is Everybody?” We explained: “The very first episode of The Twilight Zone aired on CBS on October 2, 1959. It was titled ‘Where Is Everybody?.’ The TV series was created by Rod Serling and broadcast from 1959 to 1964. Wikipedia observes: ‘Each episode presents a stand-alone story in which characters find themselves dealing with often disturbing or unusual events, an experience described as entering “The Twilight Zone,” often with a surprise ending and a moral.’” Later in that Morning Briefing, we observed: “[A] pandemic of fear continues to weigh on our economy. As a result of voluntary and enforced social distancing and lockdowns, the streets are empty, as are office buildings, shopping malls, restaurants, hotels, and airports.”
In many ways, we’re all still stuck in The Twilight Zone, still experiencing the shockwaves from the pandemic shock. Now as we approach the third anniversary of the lockdowns, which mostly ended by May 2020, we are struck by the thought that the economy and the financial markets are trapped in that time warp too. Since the pandemic, consensus economic and financial forecasts have been mostly blindsided by surprise endings. Instead of “Where is everyone?” the main question seems to be “Where are we all going?”
Pandemic II: Economy on Warp Speed. The Trump administration formally introduced “Operation Warp Speed” on May 15, 2020. The goal was to speed up the development of a Covid vaccine with billions of dollars committed by the federal government to the project. The pandemic seems to have accelerated the latest business cycle at warp speed.
The lockdowns hurled the economy into a very severe recession, but it lasted only two months. The Index of Coincident Economic Indicators (CEI) plunged 13.1% from February through April 2020 (Fig. 1). Real GDP fell 9.6% from Q4-2019 through Q2-2020 (Fig. 2). It fully recovered by Q1-2021. It declined modestly during the first half of 2022; but by Q4-2022, it was at a record-high 5.0% above its previous business cycle peak just before the pandemic.
Weighing on the CEI has been payroll employment, which is one of its four components (Fig. 3). It didn’t fully recover from the pandemic until June 2022. There were plenty of job openings, which rose to a record high of 12.0 million during March 2022 (Fig. 4). The problem was that the labor force didn’t fully recover until August 2022.
The pandemic weighed on the recovery in the labor force. Many people couldn’t work because they were ill or had to take care of a family member who was sick. Some stayed home with their kids because schools offered only remote lessons or because government restrictions had closed daycare facilities. Many seniors decided to retire rather than be exposed to the virus at work. Sadly, more than a million Americans died from the virus (Fig. 5).
Nevertheless, consumer spending and saving were boosted by three rounds of pandemic relief checks provided by the government (Fig. 6 and Fig. 7). To relieve their cabin fever, consumers went on a buying binge right after the lockdowns were lifted. Much of the binge focused on goods rather than services because the latter still faced social-distancing restrictions (Fig. 8).
During the second half of 2021, consumers pivoted toward buying more services as they became more available. Retailers experienced unintended inventory pileups as a result and had to cut back their orders and lower their prices, especially during 2022.
There was lots of talk about a recession in 2022 as the Fed was forced to raise the federal funds rate in the face of a surge in inflation, which was exacerbated by Russia’s invasion of Ukraine. When a recession didn’t happen, economists attributed the resilience of consumer spending mostly to the excess savings accumulated during the pandemic. Now there’s lots of chatter about the possibility of a recession during the second half of this year if the Fed were to hike rates further notwithstanding the tightening of credit conditions caused by the banking crisis that started in early March.
Pandemic III: Transitory & Persistent Inflation. Contrary to renowned economist Milton Friedman’s claim that inflation is essentially a monetary phenomenon—i.e., a product primarily of monetary policy—inflation remained remarkably subdued ever since the Great Financial Crisis notwithstanding the ultra-easy monetary policies of the major central banks, which would be expected to raise it if Friedman’s thesis was correct. On December 9, 2020, we wrote: “We soon should find out if money matters to the inflation outlook given that the GVC [Great Virus Crisis] has resulted in ultra-easy monetary policies on steroids and speed combined!”
That was before we knew that the first round of pandemic relief checks would be followed by two more rounds. The third one in early 2021 was the charm: The combination of excessively stimulative fiscal policy and excessively easy monetary policy amounted to Friedman’s “helicopter money.” It fueled the consumer buying binge for goods. Goods producers and distributors raised prices and ordered more goods as their inventories were depleted.
However, as noted above, the buying binge for goods abated during the second half of 2022, forcing goods providers to slash prices to clear their inventories. As we noted in yesterday’s Morning Briefing, the core CPI goods inflation rate soared from 1.3% y/y during February 2021 to peak at 12.3% during February 2022. It was back down to 1.5% during March of this year (Fig. 9). Goods inflation has turned out to be transitory.
On the other hand, the core CPI services inflation rate has increased from 1.3% to 7.1% over this same period. It has been more persistent largely because of the rent inflation component of the CPI. Rent inflation in the CPI hovered around 3.5% during the second half of the 2010s (Fig. 10). It dropped just below 2.0% following the lockdowns during the first half of 2021. It then soared to 8.8% last month.
The Centers for Disease Control and Prevention (CDC) took unprecedented action on September 1, 2020 by issuing a temporary national moratorium on most evictions for nonpayment of rent to help prevent the spread of coronavirus. The CDC eviction moratorium took effect September 4 and was initially set to expire on December 31. Congress extended the moratorium through January 2021—and President Biden further extended it through March, June, and July 2021—and provided a total of $46.5 billion for emergency rental assistance (ERA). The eviction moratorium lapsed on July 31, but the CDC announced on August 3 a limited eviction moratorium through October 3, 2021 for renters living in communities experiencing a surge in Covid-19 cases, covering an estimated 80% of all US counties and 90% of all renters. Some states also passed legislation to protect tenants from eviction for failing to pay their rent if they suffered a financial hardship from Covid.
Guess what landlords did once the moratoriums were lifted? They raised rents aggressively. The ApartmentList index of rents soared from -1.2% y/y at the start of 2021 to peak at 18.1% by the end of 2021. The pace of rise was back down to 2.6% during March of this year (Fig. 11). The CPI primary residential rent inflation rate rose to 8.8% in March because it includes rents on all active leases, while the ApartmentList index includes just newly signed leases. We expect that the CPI rent inflation measure will peak by mid-year and then fall sharply during the second half of this year.
Pandemic IV: Fed Awakes From Being Woke. Based on the above, the Fed doesn’t deserve all the blame for letting the inflation genie out of the bottle. Nevertheless, the Fed certainly exacerbated inflation. Most importantly, under Fed Chair Jerome Powell’s leadership, the Fed turned woke and prioritized “inclusive” maximum employment over its stated 2.0% inflation target in its August 2020 statement on its long-run goals and strategy. Also in that statement, the Fed embraced flexible average inflation targeting, indicating that it now would tolerate inflation overshoots to compensate for prior inflation shortfalls.
By maintaining ultra-easy monetary policies through the start of 2022, the Fed succeeded in lowering the unemployment rate to 3.6%. In addition, the ratio of job openings to unemployed workers rose to a record 2.0 during March 2022. The result has been a significant increase in wage inflation, which has spiraled into price inflation, thus eroding the purchasing power of all workers. That has been the unintended consequence of the Fed’s wokeness!
Recognizing that they were well behind the inflation curve, the members of the FOMC voted to raise the federal funds rate from 0.00%-0.25% to 0.25%-0.50% at the March 15-16, 2022 meeting of the committee. They continued to raise the rate at every meeting, all the way up to 4.75%-5.00% at the March 21-22 meeting this year.
Pandemic V: The Future Is Now. That has been the fastest and most dramatic tightening of monetary policy since former Fed Chair Paul Volcker let interest rates soar in late 1979.
As a result, the single-family housing market fell into a recession. However, construction remains strong for multi-family residential units and for infrastructure, funded by various government spending programs. In fact, construction employment rose to a record high during March (Fig. 12).
Consumer spending has held up very well during the pandemic thanks to the relief checks and now excess saving. In addition, employment gains have been very strong, and in recent months wages have been rising faster than prices, boosting the purchasing power of consumers. Nevertheless, consumers’ pivot from goods to services depressed consumer goods manufacturing and retailing.
It has all added up to a rolling recession rather than an economy-wide one. The Atlanta Fed’s GDPNow tracking model estimates as of April 14 that Q1-2023 real GDP rose 2.5% (saar). Real consumer spending is tracking at 4.2%.
The Sky Isn’t Falling
April 17 (Monday)
Check out the accompanying pdf and chart collection.
Executive Summary: JPMorgan CEO Jamie Dimon’s ambiguous warnings about the economy broadly and banks specifically, voiced intermittently since last summer, have probably led many an investor astray. JPM stock has soared 34% since October, and the S&P 500 has leapt 7% in the month or so since SVB imploded, with every sector participating. … One thing Dimon said is on the mark: The economy isn’t headed for a credit crunch. That’s substantiated by US banks’ balance-sheet data, which we monitor. … Another alarmist creating disconcerting background noise is Fed Governor Christopher Waller. He’s not bothered by the economy or the banking crisis but by inflation, which he says requires further tightening. We strongly disagree.
YRI Weekly Webcast. Join Dr. Ed’s live webcast with Q&A on Mondays at 11 a.m. EST. You will receive an email with the link one hour before showtime. Replays of the weekly webcasts are available here.
Credit I: The Alarmist. JPMorgan Chase CEO Jamie Dimon has been warning since last summer that the economic outlook is grim and that investors should prepare for bad times. He has been among the most vocal and credible of the pessimistic prognosticators. However, unlike the other “nattering nabobs of negativism” (to quote former Vice President Spiro Agnew in 1970), Dimon has provided a more hedged view, as follows:
(1) Chicken Little. Last summer, Dimon said he is preparing America’s biggest bank for an economic hurricane on the horizon and advised investors to do the same. “You know, I said there’s storm clouds, but I’m going to change it … it’s a hurricane,” Dimon said on Wednesday, June 1 at a financial conference in New York. While conditions seem “fine” at the moment, nobody knows whether the hurricane is “a minor one or Superstorm Sandy,” he added. “You’d better brace yourself,” Dimon told the roomful of analysts and investors. “JPMorgan is bracing ourselves and we’re going to be very conservative with our balance sheet.”
On April 4, in his annual letter to shareholders, Dimon said the economy remained in “pretty good” shape. However, he warned: “As I write this letter, the current crisis is not yet over, and even when it is behind us, there will be repercussions from it for years to come.” Nevertheless, he toned it down, writing that “the current crisis is nothing like what occurred during the 2008 global financial crisis.” Turning to the economic outlook, he wrote that “jitters” would “clearly cause some tightening of financial conditions as banks and other lenders become more conservative.” But he also toned that down, writing “Even if we go into a recession, consumers would enter it in far better shape than during the great financial crisis.”
(2) Dimon in the rough. Dimon used his weather analogy once again on Friday’s earnings call, offering a less downbeat outlook again: “The US economy continues to be on generally healthy footings—consumers are still spending and have strong balance sheets, and businesses are in good shape,” Dimon said. “However, the storm clouds that we have been monitoring for the past year remain on the horizon, and the banking industry turmoil adds to these risks.”
Dimon also discouraged the use of the term “credit crunch” on the call. “Obviously, there’s going to be a little bit of tightening, and most of that will be around certain real-estate things,” Dimon said. “You’ve heard it from real-estate investors already, so I just look at that as a kind of a thumb on the scale. It just means the fast conditions will be a little bit tighter, which increases the odds of a recession. That’s what that is. It’s not like a credit crunch.”
While Dimon’s message about the economic outlook has been somewhat confusing, there was no ambiguity in JPMorgan’s strength out of the gate this year: It had a huge Q1 revenue beat and projected big future net interest income. Barron’s Carleton English reported: “JPMorgan saw profit climb 52% from a year earlier to $12.6 billion, or $4.10 a share, coming in well ahead consensus estimates. The consensus call on Wall Street was that the bank would earn $10.2 billion, or $3.41 a share. Revenue was a record $38.3 billion, up 25% from a year ago and topping estimates of $36.2 billion. The strong results were largely because JPMorgan’s net interest income rose 49% from last year to $20.9 billion, fueled by the Federal Reserve’s interest-rate increases. Higher rates improve the spread, or net interest income, between what banks charge for loans and what they pay depositors or borrow. For the full year, JPMorgan expects net interest income to be $81 billion, up from a previous forecast of $74 billion.”
Dimon enjoyed a 7.5% jump in JPM’s stock price on Friday. Too bad lots of investors might have sold their holdings of JPM and other stocks on Dimon’s bearish comments since last summer. The stock is up 33.9% since its bear market low on October 12.
The stock price index of the S&P 500 Diversified Banks (BAC, C, JPM, USB, and WFC) is still down 24.2% from the bull market peak of January 3, 2022 through Friday’s close (Fig. 1). Over this period, the forward P/E of the industry dropped from 12.9 to 8.4 (Fig. 2). In the past, such a low valuation multiple has been a good opportunity to buy these stocks.
We've previously observed that any day without a banking crisis is a good day for stocks. SVB imploded on Friday, March 10. On Sunday, March 12, the Fed and FDIC took actions to avoid additional bank runs. The S&P 500 is up 7.1% since March 10, led by its Information Technology (9.8%), Health Care (8.6), and Utilities (7.6) sectors (Table 1). All 11 sectors are up since then, even Financials (0.1).
Credit II: On the Lookout for Disintermediation. Melissa and I agree with Jamie Dimon on one thing: An economy-wide credit crunch isn’t likely to result from the latest banking crisis. We are monitoring the situation by tracking the Fed’s weekly H.8 report titled “Assets and Liabilities of Commercial Banks in the United States,” released on Fridays at 4:15 p.m. We do that in our Commercial Bank Book. Here are the latest findings through the week of April 5:
(1) Bank credit. During the April 5 week, bank credit actually increased by $41.1 billion, with securities up $30.9 billion and loans up $10.2 billion (Fig. 3). During the previous two weeks, bank credit declined by $311.0 billion, with securities down $206.5 billion and loans down $104.5 billion.
(2) Deposits and borrowings. During the April 5 week, bank deposits rose $60.7 billion following five weekly net outflows totaling $500.1 billion. Borrowings declined by $94.6 billion following the previous week’s decline of $24.0 billion. During the first two weeks of the banking crisis, borrowings rose $570.1 billion.
(3) Small banks. The Fed reports the assets and liabilities of large and small domestically charted banks as well as foreign-related ones. The hard-landers are anticipating that the banking crisis will intensify among the smaller banks, leading to a credit crunch and a recession. We disagree. So we were heartened to see bank credit, securities, and loans at the small banks rose in the latest week following declines during the past two weeks. Their deposits also rose for a second week in a row, while their borrowings have declined for the past three weeks (Fig. 4).
(4) Allowances for losses. JPMorgan set aside roughly $2.3 billion during Q1 to protect against borrowers’ falling behind on their loans. That was up from $1.5 billion in the same quarter last year, largely because of a somewhat worse economic outlook, the bank said. The H.8 release shows that allowances for loan losses at all banks rose $10.7 billion so far this year through the April 5 week (Fig. 5).
That’s not an alarming increase. Raising loan-loss reserves is a prudent move given all the chatter about a recession this year. The March 21-22 FOMC minutes, released last Wednesday, showed that the Fed’s staff is now forecasting a mild economic downturn soon because of the banking crisis: “Given their assessment of the potential economic effects of the recent banking-sector developments, the staff’s projection at the time of the March meeting included a mild recession starting later this year, with a recovery over the subsequent two years.”
(5) Liquidity facilities. The Fed’s H.4.1 report comes out on Thursdays at 4:15 pm. It shows the assets and liabilities of the Fed. Since the start of the banking crisis, we’ve been tracking the Fed’s loans portfolio, which includes discount-window borrowing and borrowing under the new Bank Term Funding Program (BTFP) as well as “other credit extensions.” Boosting the other credit extensions category have been loans that were extended to depository institutions established by the FDIC.
While the other loans category remains high at $172.9 billion (near its high during the week of March 29), the discount-window borrowing, a.k.a. primary credit, fell from a recent peak of $117.0 billion during the week of March 22 to $67.9 billion (Fig. 6). Borrowing under the BTFP, which was announced on March 12, is at a record $76.7 billion.
These numbers suggest that the Fed’s liquidity-providing response to the banking crisis is working to calm things down.
Inflation: The Alarmist. While Jamie Dimon has been sounding the alarm on the economic outlook, Fed Governor Christopher Waller is sounding the alarm about inflation. In a speech on Friday, he said that there has been little progress on inflation for more than a year and that more interest-rate hikes are needed to get prices under control.
Waller isn’t losing any sleep over the banking crisis: “The BTFP and discount window appear to have been successful in providing stability to the banking system. In the past few weeks, we have seen deposit flows stabilize across banks and, as a result, the combined usage of the discount window and the new program has moderated. Both tools remain ready and able to provide liquidity, enabling banks to support households and businesses.”
Waller is also relatively sanguine about the economic outlook. He didn’t even mention that the Fed’s staff is forecasting a mild recession later this year. On the other hand, he remains concerned about inflation. He observed that inflation is still well above the Fed’s 2% target. He added that since “December of 2021, core inflation has basically moved sideways with no apparent downward movement.” Consequently, “monetary policy will need to remain tight for a substantial period of time, and longer than markets anticipate.”
We beg to differ with Waller’s assessment of inflation. In our April 13 QuickTakes, we observed that goods inflation has turned out to be transitory, while services inflation has been persistent, but is likely to moderate over the rest of the year along with rent inflation:
(1) The core CPI goods inflation rate soared from 1.3% y/y during February 2021 to peak at 12.3% during February 2022. It was back down to 1.5% during March of this year (Fig. 7). On the other hand, the core CPI services inflation rate has increased from 1.3% to 7.1% over this same period.
(2) Rent accounts for 56.6% of the core CPI services inflation rate. Rent of primary residence and owners’ equivalent rent (OER) account for 12.9% and 43.7% of the core CPI services inflation rate. The former rose from a spring 2021 low of 1.8% to 8.8% last month (Fig. 8). The three-month annualized inflation rate for rent of primary residence fell sharply from 9.2% during February to 8.0% during March, the first significant drop since 2020. The same story can be told about OER.
(3) Waller and his colleagues don’t seem to spend much time looking at the PPI. They should. The March PPI for final demand fell to only 2.7% y/y, down from a peak of 11.7% during March 2022 (Fig. 9). PPI goods inflation has dropped from a peak of 17.6% last June to 2.0% in March. PPI services inflation (which does not include rent) fell from about 9.0% to 2.8% since early this year!
The PPI for final consumer demand fell to 2.7% in March, signaling that both the CPI and PCED inflation rates will continue to moderate in coming months (Fig. 10). The inflation rate for the PPI of final demand for personal consumption of services has been much more transitory than the comparable CPI and PCED measures, which both include rent (Fig. 11).
Waller should have a look at the core CPI inflation rate versus the core PPI inflation rate (Fig. 12). The former has “basically moved sideways” since December 2021, as he said. However, the core PPI for personal consumption has plunged from a peak of 8.1% last March to 3.3% this March. We think that the latter is a good leading indicator for the former. Unlike Waller, we think the Fed should cease and desist from further rate hikes. However, he gets to vote on that issue; we don’t.
Materials, Earnings & Bricks
April 13 (Thursday)
Check out the accompanying pdf and chart collection.
Executive Summary: Banking-crisis-stoked recession fears knocked the S&P 500 Materials sector off its top-performing perch; now with those fears allayed, it’s been rebounding. Jackie examines the earnings prospects of two Materials industries, steel and copper, and the economic prospects of their biggest consumer, China. … Also: While analysts have lowered their earnings sights for S&P 500 companies collectively in recent weeks, forward earnings have risen for more S&P 500 industries than have fallen. The outlooks for travel and commodities related industries have improved the most. … And: A promising new energy storage solution comes from improbably low-tech sources that have been right under our feet: bricks and stones.
Materials: Is the Mojo Returning? The S&P 500 Materials sector has started to recover from its March swoon now that the Federal Reserve appears to have prevented the latest US banking crisis from escalating. The sector may continue to improve if the US skirts a recession and China’s economy rebounds from the Covid lockdowns that were lifted in December.
At its peak this year on February 1, the S&P 500 Materials stock price index was up 9.7% ytd, which made it the fifth best-performing sector in the S&P 500 at the time. The index subsequently fell to a low on March 17, putting it down 3.2% ytd, as investors feared that the banking industry’s problems would cause a recession. Since the Fed’s interventions in early March, no additional banks have gone bust, and the outlook for the US economy has improved—helping to fuel the Materials sector’s rebound. It’s now up 3.7% ytd (through Tuesday’s close), placing it fourth among the S&P 500’s 11 sectors.
Here's the performance derby of the S&P 500 and its sectors’ stock price indexes ytd through Tuesday’s close: Communications Services (21.6%), Information Technology (18.7), Consumer Discretionary (12.8), S&P 500 (7.0), Materials (3.7), Consumer Staples (1.3), Real Estate (1.2), Industrials (1.0), Energy (-1.2), Utilities (-1.2), Health Care (-1.5), and Financials (-5.6) (Fig. 1).
Let’s take a look at two large constituents of the S&P 500 Materials sector—the Copper and Steel industries—and examine some of the economic data out of China, a notoriously huge consumer of commodities:
(1) Steel’s wild ride. The S&P 500 Steel industry has had sharp ups and downs in just the past four months. The industry’s stock price index rose to a ytd peak of 36.6% in March only to see its ytd gain fall to a low of 7.8% on April 5. The index has rebounded modestly since the low and is now up 12.1% ytd through Tuesday’s close (Fig. 2). While the stock price index has gyrated this year, the price of US Midwest domestic hot rolled coil steel has gone in just one direction: up. The price is $1,165 per ton, up from the recent low of $650 per ton in late December 2022 (Fig. 3).
Demand for steel in the US has been supported by the giant windmills sprouting up across the country, a moderately strong auto market, and construction of new manufacturing plants. Auto sales have jumped nicely, averaging 15.4mu (saar) during Q1, up from a low of 12.4mu in 2021 (Fig. 4). With auto inventory levels still abnormally low, the gradual increase in production appears to have room to run (Fig. 5).
The surge in US nonresidential and public construction has more than offset the decline in home construction (Fig. 6). Public construction has received a boost from companies’ reshoring of manufacturing operations to the US and use of government incentives to build new semiconductor and green energy equipment plants.
Analysts’ consensus estimates imply that earnings for the S&P 500 Steel industry are expected to tumble 43.6% this year and fall an additional 29.1% in 2024 (Fig. 7).
(2) Copper’s selloff ends. Copper started the year as the top-performing industry in the S&P 500 Materials sector. It was up 22.7% as of January 25 only to give back its gains and then some. By March 15, the Copper stock price index was down 6.6% ytd. Only in recent weeks has the industry’s stock price index resumed its upward momentum. As of Tuesday’s close, the Copper stock price index is up 8.2% ytd.
The Copper stock price index has performed somewhat better than the actual metal. Copper futures at $402.45 are below their recent high of $414.60 in March and their 2022 high of $492.90 (Fig. 8). The two indexes may be behaving somewhat differently because the S&P 500 Copper stock price index includes only one company, Freeport-McMoRan, and it doesn’t just mine copper but gold and molybdenum as well. While the price of copper is up 6% ytd, the price of gold is up 10% ytd (Fig. 9).
Earlier this year, Freeport gave investors an optimistic view of long-term copper demand. “On Jan. 25, Freeport offered guidance for 2023 copper sales of 4.2 million pounds, flat vs. 2022,” a March 1 Investor’s Business Daily article reported. “Longer term, Freeport expects widespread copper supply deficits. Demand fueled by the green energy transition is seen outstripping the capacity of mining projects currently in development. The mining investment needed to close that gap will require higher copper prices, Freeport says.”
Earnings for the S&P 500 Copper industry are expected to fall 18.9% this year but rebound by 17.6% in 2024 (Fig. 10).
(3) China’s economy improving too. No discussion of copper and steel is complete without looking at the economy of the world’s largest consumer of the two metals, China. The country’s appetite for commodities has been muted over the past year or so as Covid lockdowns and a glut of apartments have weighed on construction and manufacturing. But the lifting of the Covid restrictions in December is expected to boost the country’s economy, which grew only 3.0% last year.
China’s March manufacturing purchasing managers index was in expansion territory at 51.9, with new orders at a solid 53.6 (Fig. 11). China’s service sector grew even faster. The non-manufacturing purchasing managers index hit 57.8 in March (Fig. 12).
Offsetting this growth were February’s 8.9% decline in exports and a sluggish residential property sector plagued by oversupply that could continue through this year (Fig. 13). Fortunately, the country isn’t facing an inflation battle. China’s March CPI increase was only 0.7% y/y, and industrial prices declined 2.5% y/y in March. The subdued prices sparked speculation that the government would provide additional stimulus to boost the economy (Fig. 14 and Fig. 15).
China’s stock market and its currency have had a strong bounce from their 2022 lows. The yuan/dollar exchange rate is 6.88, down from its 2022 high of 7.32 on November 3 (Fig. 16). Likewise, the China MSCI share price index has risen 40.2% from its 2022 low on October 31 (Fig. 17). If the country’s economy continues to improve, its demand for commodities and their prices are likely to increase as well.
Strategy: A Look at Earnings Revisions. The forward earnings of S&P 500 companies in aggregate has been revised downward by 1.0% over the 13 weeks through April 6. And more of the sectors have had negative earnings revisions than positive ones.
Here’s the performance derby for the S&P 500 and its sectors’ forward earnings revisions for the 13 weeks through April 6: Communications Services (3.9%), Consumer Staples (3.6), Industrials (1.4), Utilities (0.6), S&P 500 (-1.0), Information Technology (-1.0), Real Estate (-2.0), Consumer Discretionary (-2.3), Materials (-2.8), Health Care (-3.1), Energy (-8.6), and Financials (-11.1) (Table 1).
But the picture is more optimistic than these sector-focused results imply, as industries with upward revisions are more prevalent than those with downward ones. Here are some takeaways from the estimate-change data:
(1) Tech doesn’t dominate. The industries with the largest upward revisions to their forward earnings over the past 13 weeks are involved with travel and commodities. There are also several names from the Communication Services sector.
Here are the 10 industries that saw their forward earnings revised upward the most over the past 13 weeks: Casinos & Gaming (76.7%), Oil & Gas Refining & Marketing (24.0), Airlines (21.7), Reinsurance (15.8), Gold (15.3), Copper (14.1), Steel (13.5), Wireless Telecommunication Services (13.2), Movies & Entertainment (12.8), and Advertising (12.3). Many Consumer Staples industries also enjoyed upward revisions but weren’t among the top 10, including Agricultural Products (11.1%), Personal Products (9.0), Tobacco (8.2), and Food Retail (6.2). Not far behind, in 20th place, is Hotels, which had a 7.2% increase in its forward earnings.
Despite the strong rally in technology stocks this year, few industries in the S&P 500 Information Technology sector have seen the largest upward revisions in forward earnings. Application Software fared best among Tech industries, in 12th place with a 10.7% jump in its forward earnings estimate over the past 13 weeks, followed by Communications Equipment in the 21st slot with a 6.8% upward forward earnings revision. Conversely, forward earnings revisions were downward for Electronic Components (-1.6%), Semiconductor Equipment (-1.7), and Semiconductors (-3.4).
(2) Downward revisions hit banks and energy. Given the March banking crisis, it’s not surprising to see the S&P 500 Regional Banks industry near the bottom of the list, with its forward earnings cut by 13.1% over the past 13 weeks. More surprising are the downward revisions that some of the Energy sector’s industries have experienced. But perhaps that will change in the wake of OPEC’s oil production cuts earlier this month, which boosted the price of oil.
Here are some of the S&P 500 industries with the greatest downward forward earnings revisions over the past 13 weeks: Oil & Gas Exploration & Production (-20.9%), Housewares & Specialties (-20.7), Fertilizers & Agricultural Chemicals (-20.3), Publishing (-14.9), Leisure Products (-13.3), Regional Banks (-13.1), Integrated Oil & Gas (-10.7), Commodity Chemicals (-9.5), and Automobile Manufacturers (-9.0).
Disruptive Technologies: An Energy Storage Solution. Generating industrial heat—the heat used in industrial processes like producing plastic, food, steel, or concrete—makes up about 20% of global energy demand. And in the US, it throws off about 10% of our country’s CO2 emissions. Industrial heat historically has been produced by burning fossil fuels, like natural gas. Fossil fuels haven’t been replaced by wind or solar power because the intermittency of those green energy sources isn’t acceptable in a factory that runs 24-7. Meanwhile, the high cost of lithium batteries and their negative environmental impact makes them unattractive as a means of storing green energy.
Some small companies believe they’ve arrived at a solution: storing energy in bricks and stones. Here’s Jackie’s look at how two companies, Brenmiller Energy and Rondo Energy, are approaching renewable energy’s storage problem:
(1) Heating a stack of bricks. Rondo Energy’s heat battery system turns electricity into heat by passing the electricity through a heating element. The company, which counts Bill Gates’ Breakthrough Energy Ventures among its investors, compares the system to a large toaster. The difference is the heat thrown off by the heating element is absorbed by a stack of bricks, and their temperature can climb to 2,700 degrees Fahrenheit. They’re housed inside an insulated steel container and can remain hot for days, explains an April 10 article in the MIT Technology Review.
Fans blow the heat off the bricks, warming air that is pumped via pipe into a factory and can be used to turn water into steam, which is used in many industrial processes. The heat storage units are installed outside of the factory, so their installation doesn’t require changing the plant’s existing footprint.
The fact that the units don’t use chemicals gives them two big advantages over lithium batteries: no risk of igniting and easy disposal after their 40-plus-years lifecycle. The system can charge in about four hours, and heat can be stored for up to 18 hours. Rapid charging allows the plant operator to pull electricity from the grid at times when it’s the cheapest.
Rondo’s heat batteries are extremely efficient and can get hot enough to power most industrial processes (two exceptions involve steel and cement making). The company’s first commercial project provides steam for use in fermentation to produce ethanol.
(2) Heating a pile of rocks. In the Brenmiller system, steam is created by capturing residual heat, using biomass or electricity. The steam flows through pipes, which heat the surrounding crushed rock up to 1,022 degrees Fahrenheit. It can hold up to 24MWh of clean heat for five hours. The heat is discharged by heating pressurized water and generating steam, which is converted into electricity. It can charge when there’s excess sun and wind and discharge when there’s not.
Brenmiller has partnered with The Enel Group, an Italian energy company, to install a heat-based energy storage system in Enel’s power plant in Tuscany. The project was partially supported by the Israeli Innovation Authority’s 1 million euros in financing given to Brenmiller. It is “the first ever system of its kind to provide utility-scale thermal energy storage and offers commercial and industrial users a viable path towards decarbonization,” CEO Avi Brenmiller told The Jerusalem Post in a November 7 article. “The TES also makes it possible to add additional renewables to the grid with greater reliability.”
A few years ago, the company installed its system at an Israeli army base, and earlier this month Brenmiller was tapped to construct its thermal energy storage facility at Tempo beverage headquarters in Israel. Tempo is partially owned by Heineken International and produces Heineken, Pepsi, and Nestle products. The project is receiving NIS 2.2 million from Israel’s Ministry of Environmental Protection, an April 10 article in The Jerusalem Post reported.
And last year, the company agreed to install a thermal unit alongside a Philip Morris plant in Romania, which hopes to reduce its dependence on natural gas.
Bulls vs Bears
April 12 (Wednesday)
Check out the accompanying pdf and chart collection.
Executive Summary: We’re still stock market bulls, believing that the bear market ended in October. But now that the Fed’s tightening has touched off a financial crisis, we’d defect to the bear camp IF the Fed were to keep on tightening. … While industry analysts have been lowering their earnings sights this year, that’s almost moot to stock investors, who are more focused now on next year’s better growth prospects. … Also: The current concerns of small business owners are anything but small, including inflation, labor shortages, and a possible credit crunch. … And: The MegaCap-8’s upcoming Q1 earnings reports could set the tone for the S&P 500’s performance.
Strategy I: Stalemate Between the Bulls & Bears. The stock market seems to be experiencing a stalemate in the trench war between the bulls and the bears. Neither side has gained any ground. Since the S&P 500 first fell to the 4000 level last year on May 9, it’s been going nowhere fast, fluctuating in a wide range of 4305 on the upside and 3577 on the downside (Fig. 1).
Arguably, the bulls’ case has advanced significantly if last year’s bear market ended on October 12, as we believe. The S&P 500 is up 14.9% since then through Monday’s close. About half of that gain has been logged this year: The S&P 500 is up 7.0% ytd, led by Communication Services (22.1%), Information Technology (19.9), and Consumer Discretionary (12.8) (Fig. 2).
Nevertheless, the bears are confident, as they were at the start of this year, that last year’s bear market isn’t over. Most of them are expecting the S&P 500 to fall below last year’s closing low of 3577 on October 12.
At the start of this year, the bears were mostly hard landers, expecting the economy to fall into a recession that would depress both earnings and valuations during the first half of this year. The surprising strength in January’s economic indicators during February converted many bears into no-landers even as they remained bearish, figuring that a strong economy would force the Fed to raise interest rates even higher to beat down inflation. The result would be an inevitable recession, but delayed to the second half of the year, with bearish consequences for the stock market, of course. In other words, according to the bears, good economic news is still bad news.
The banking crisis that started in early March convinced the bears that an economy-wide credit crunch is inevitable, and so is a recession—all the more reason to stay bearish, in their opinion.
We’ve been siding with the bulls since late October, when we concluded that the bear market was over. However, now that something has broken in the financial markets as a result of the Fed’s aggressive monetary tightening cycle, we are ready to turn into pessimists on the economic prospects and bears on the stock market outlook IF the Fed doesn’t stop raising interest rates, as we wrote in yesterday’s Morning Briefing.
Strategy II: Earnings Stalemate. The bears are right about S&P 500 operating earnings per share this year. Industry analysts have cut their estimates so much that the consensus has fallen by 4.2% from $229.52 at the start of the year to $219.83 during the April 6 week (Fig. 3). They’ve been lowering their estimates for all four quarters of this year (Fig. 4).
The analysts collectively now expect the following y/y growth rates for Q1 (-7.7%), Q2 (-6.6), Q3 (1.4) and Q4 (9.7). They estimate that earnings will be up 0.8% this year and 12.3% next year. The analysts have also been cutting their estimate for 2024’s S&P 500 operating earnings per share by 2.6%, from $253.37 at the start of this year to $246.83 during the April 6 week.
So why isn’t the stock market going down along with consensus earnings forecasts? As the current year passes, investors are giving greater weight to next year’s earnings than to this year’s. So they’re increasingly looking past 2023 into 2024, when analysts expect that earnings will be higher than this year. The bears haven’t said much about next year, but they have opined that their recession scenario now applies to the second half of this year, implying that the economy should be growing again next year.
The time-weighted average of analysts’ consensus earnings expectations for this year and next year—i.e., “forward earnings”—was $227 per share during the week of April 6. It’s been hovering around this level for the past 11 weeks. That’s after falling 5.8% from its record high on June 23, 2022.
While forward earnings has been in a funk since last summer, S&P 500 forward revenues rose to a new record high during the March 30 week (Fig. 5). The forward profit margin, which we derive from forward earnings and revenues, peaked last year at a record 13.4% during the June 9 week and fell to a two-year low of 12.3% during the March 30 week.
US Economy: The View From the Trenches. While the bulls and the bears have been stalemated in their trench war, small business owners are fighting their own trench war against inflation, labor shortages, and a possible credit crunch. Let’s have a look at the March survey of small business owners conducted by the National Federation of Independent Business:
(1) Inflation. Last month, 24% of small business owners said that inflation is their most important problem (Fig. 6). That’s down from 37% during July 2022. Only 3% of them said that the availability and cost of credit is their number one problem.
The percent of small business owners either raising or planning to raise their prices fell to 37% and 26% during March, down from their respective peaks of 66% and 54% during March 2022 and November 2021 (Fig. 7).
(2) Labor. The labor market remains tight. However, fewer small business owners, i.e., 15%, are planning to increase hiring over the next three months. That’s down from the record high of 32% during August 2021 (Fig. 8).
The percentage of respondents with job openings declined from 47% during February to 43% during March. That’s still a very high reading and suggests that the comparable JOLTS series for job openings also remain high in March (Fig. 9).
(3) Credit. When asked whether “credit was harder to get than last time,” 9% responded in the affirmative (on a net basis), up from 5% in February (Fig. 10). That’s not much, but it is up sharply. Also the percentage saying that they are borrowing at least once a quarter rose to 30% during March, up from a series low of 20% during August and September 2021 (Fig. 11).
Review: The MegaCap-8. The MegaCap-8 group of stocks (i.e., Alphabet, Amazon, Apple, Meta, Microsoft, Netflix, Nvidia, and Tesla) is leading the S&P 500 higher in a big way so far in 2023. While the group isn’t as cheap as at the start of the year—when its valuation was very depressed—it is decidedly less expensive than during 2020-21, when its forward P/E flirted with 35 (Fig. 12). The revived performance is due partly to some of the companies’ prospects for a forward earnings turnaround. The same can’t be said about the S&P 500 companies generally.
These eight stocks still account for a large part of the S&P 500’s market capitalization, revenues, and earnings. Their soon-to-released results for Q1, which should reflect aggressive cost-cutting, could set the tone for the S&P 500’s performance. Consider the following:
(1) Market capitalization. The MegaCap-8’s market cap tumbled 41.5% in 2022 but has rebounded since by 30.0% ytd, to $9.2 trillion as of Friday’s close (Fig. 13). The S&P 500’s market cap is up 6.8% ytd; but excluding the MegaCap-8, it would be up only 1.0% ytd. The MegaCap-8’s market-capitalization share of the S&P 500 has recovered too, soaring from 19.4% at the start of the year to 23.7% during the April 7 week (Fig. 14).
(2) Forward revenues and earnings. Forward revenues and earnings have risen for six of the MegaCap-8 companies (or 75%) so far in 2023, with Apple and Tesla the exceptions. That beats the S&P 500’s 61% of companies with forward earnings increases so far in 2023 (Fig. 15 and Fig. 16).
Excluding the MegaCap-8, the S&P 500’s forward revenues would be up 1.3% ytd, just slightly higher than the full index’s 1.2%. But forward earnings would be down 1.7% ytd without the group, greater than the full index’s drop of 1.2%.
Here’s how the MegaCap-8’s forward revenues and earnings have performed ytd: Alphabet (forward revenues up 1.2%, forward earnings up 3.8%), Amazon (3.1, 8.5), Apple (-1.5, -0.1), Meta (4.3, 33.6), Microsoft (0.8, 1.5), Netflix (5.6, 18.9), Nvidia (8.4, 15.6), and Tesla (-0.4, -16.9).
(3) Forward profit margin. Through the March 30 week, the S&P 500’s forward profit margin has dropped to 12.3% from 12.6% at the start of the year (Fig. 17). The MegaCap-8’s forward profit margin behaved the opposite, rising from 18.0% to 18.2%. Among the MegaCap-8 companies, all but Alphabet and Tesla have seen their forward profit margin rise ytd: Alphabet (down from 23.0% to 22.9%), Amazon (3.0 to 3.1), Apple (25.2 to 25.6), Meta (21.1 to 22.6), Microsoft (34.6 to 34.8), Netflix (14.1 to 15.7), Nvidia (36.7 to 38.7), Tesla (15.9 to 13.6) (Fig. 18).
(4) Q1 revenue and earnings outlook. There will still be pain reflected in Q1’s y/y comparisons reported by the MegaCap-8 but less so than during recent past quarters. This could have an impact on overall Q1 results for the S&P 500: Analysts expect the group to account for 5.8% of the S&P 500’s Q1 revenues and 13.7% of its Q1 earnings.
Collectively, the MegaCap-8’s Q1 revenues are forecasted to rise 1.5% y/y, but earnings are expected to fall 13.7% y/y. Those are considerably poorer than the y/y changes expected for the S&P 500 generally: revenues rising 4.0% and earnings dropping 7.7%.
The Big Lebowski
April 11 (Tuesday)
Check out the accompanying pdf and chart collection.
Executive Summary: The Fed’s rate hiking may have busted something in the credit system. Specifically, the disintermediation that tightening has caused may require small banks to cut costs so deeply that merging is their only recourse. … Given this, how can the Fed fail to conclude that the federal funds rate is restrictive enough now? Pausing the tightening for a while should land the economy softly, with moderating inflation. But continued tightening would cause a hard landing and possibly even deflation. … And: You wouldn’t know there’s any landing debate going on looking just at the labor market; payroll employment is at a record high.
Weekly Webcast. If you missed Monday’s live webcast, you can view a replay here.
US Economy I: Disintermediation vs Disinflation. “The Big Lebowski” is a 1998 crime comedy film written, produced, and directed by Joel and Ethan Coen. It stars Jeff Bridges. It is a comedy masterpiece. There are two Lebowskis, who appear to represent the opposing values of two different eras: the “Dude” embodies the free-spirited liberalism of the 1960s and 1970s and the “Big Lebowski” personifies the capitalism of the 1980s and 1990s. The plot is extremely convoluted and nearly impossible to comprehend with only one viewing.
Today, we are all struggling to figure out the economy’s complex plot line. Getting it right is deadly serious; there’s nothing funny about it. We aren’t even sure who is today’s Big Lebowski. The obvious choice is Fed Chair Jerome Powell. Since early last year, he and his colleagues on the Federal Open Market Committee (FOMC) have been scrambling to tighten monetary policy to subdue soaring inflation. At first, when prices started rising at a faster pace in 2021, they thought it was transitory.
Powell first used the term “transitory” to describe inflation in a press conference following the FOMC meeting on April 28, 2021. He said then that the recent increase in inflation was due to temporary factors related to the reopening of the economy following the Covid lockdowns and that he expected inflation to return to the Fed's 2% target over time.
Powell and other Fed officials continued to use the term “transitory” to describe inflationary pressures until November 30, 2021. That day, in congressional testimony, Powell said: “The word transitory has different meanings for different people. To many it carries a sense of short-lived. We tend to use it to mean that it won’t leave a permanent mark in the form of higher inflation.” He added: “I think it’s probably a good time to retire that word and try to explain more clearly what we mean.”
Once Powell & Company realized how far behind the inflation curve they were, they moved quickly and forcefully to tighten monetary policy. The federal funds rate range was raised from 0.00%-0.25% to 0.25%-0.50% during the March 15-16, 2022 FOMC meeting and raised further at every meeting since, to 4.75%-5.00% at the March 21-22, 2023 FOMC meeting (Fig. 1). It was the most aggressive tightening of monetary policy since former Fed Chair Paul Volcker let interest rates soar in late 1979 (Fig. 2).
As the FOMC tightened, Powell and his colleagues said they were mindful that monetary policy operated with a “long and variable lag” on the economy. They said that they aimed to follow a narrow path that would permit the economy to grow even as their tightening brought inflation down. So far so good: Real GDP rose 2.1% last year and is on track to grow during Q1-2023 (Fig. 3). Meanwhile, the headline PCED inflation rate peaked at 7.0% in June of last year and fell to 5.0% in February (Fig. 4). We think it is on track to fall to 3.0%-4.0% by the end of this year.
While prices have been disinflating on balance since last summer, there is mounting concern that the Fed’s rapid rate hiking has broken something in the credit system, namely small community and regional banks. Rapidly rising bond yields and mortgage rates have slashed the value of their securities portfolios. That’s not a problem to the extent that the banks are able to categorize the securities as “held-to-maturity” (HTM). They have a worse problem, shared by bigger banks as well: The Fed’s efforts to disinflate prices have caused a disintermediation crisis. In other words, rising interest rates in the money markets are attracting funds out of deposit accounts:
(1) Deposits at all commercial banks have declined by $878 billion y/y through the March 29 week (Fig. 5). Over this period, deposits are down $648 billion and $206 billion at the large and small banks (Fig. 6).
(2) Assets of money market mutual funds (MMMF) are up $687 billion y/y through the April 5 week to a record high $5.2 trillion (Fig. 7). Over this period, retail and institutional MMMFs are up $462 billion and $225 billion (Fig. 8).
(3) Bottom line. To stop disintermediation, the banks must raise their deposit rates. But that’s bad for their profits. Higher rates might pose an existential threat for some banks that have lots of loans on their books made in recent years when the federal funds rate was around zero. Banks that face losses rather than gains on their income statements might scare depositors away, especially since the same banks are also likely to have big losses on their balance sheets on a mark-to-market basis, even if they have assets categorized as HTM.
We expect that rising costs of deposits and shrinking profits will force banks to cut costs, prompting lots of M&A activity among them. Politicians and regulators are bound to respond to the current banking crisis by increasing regulations and supervision of the smaller banks, i.e., those that haven’t been as tightly regulated as the bigger ones. The rising costs of complying with more regulations also will force many banks to lower costs by merging with each other.
US Economy II: Fed Would Be Nuts To Raise Rates Again. Under the circumstances, Powell & Company should declare that they’ve accomplished what they set out to do a year ago. They said that they were going to raise the federal funds rate until it was restrictive enough to slow the economy and bring inflation down. They said that once the rate got there, they’d leave it alone for a while until inflation falls closer to their 2.0% target.
The recent banking crisis strongly suggests that the federal funds rate is restrictive enough at 4.75%-5.00%. If so, then the long and variable lag between when the Fed started to raise interest rates and when they became sufficiently restrictive might be one year this time.
The Fed would have to be nuts to keep raising interest rates now that something has broken in the financial system. The yield curve has been predicting this outcome since last summer, when the 10-year Treasury bond yield first fell below the 2-year Treasury yield (Fig. 9). Financial crises tend to occur a few months after yield-curve inversions (Fig. 10).
If the Fed pauses for a while, the result is likely to be a soft landing with moderating inflation. If the Fed continues to tighten, then a hard landing and even deflation could result.
US Economy III: Leading Employment Indicators. Meanwhile, as reported on Friday by the Bureau of Labor Statistics, payroll employment rose to a new record high during March, and so did the household measure of employment (Fig. 11). They are up 1.0 million and 1.6 million during the first three months of the year. There’s no hard landing in those numbers!
Let’s drill down into the March payroll numbers to see whether there might be some signs of trouble:
(1) Goods and construction. Goods-producing employment in March held around its highest level since May 2008 (Fig. 12). Leading the way was construction employment, which barely budged from February’s record high (Fig. 13)! That’s impressive given the recession in the single-family housing market. The strength in nonresidential construction is corroborated by the record high in heavy and civil engineering construction payrolls (Fig. 14).
(2) Consumer services. Employment in service-producing industries rose to a record high in March (Fig. 15). Leading the way higher are consumer-related services, especially those catering to the health care needs of the many senior Baby Boomers, including ambulatory health care services, hospitals, and social assistance. All three are at record highs (Fig. 16).
Also in high demand, especially by Baby Boomers, are food services (including drinking places) & accommodations (including hotels and motels). Both remain in V-shaped recoveries, remaining below their pre-pandemic highs mostly because of a shortage of workers (Fig. 17).
Also in record-high territory are payrolls in educational services. Retail trade employment is still below its pre-pandemic record high and has stalled at around 15.5 million over the past eight months.
(3) Other services. Also still going strong and at record highs are payrolls in professional, scientific & technical services as well as administrative & support services (Fig. 18). That’s impressive given that tech companies have been announcing layoffs in recent months.
Employment in transportation & warehousing has stalled at a record high in recent months following big gains as the pandemic lockdown restrictions were lifted (Fig. 19). Wholesale trade payrolls rose to another record high last month.
(4) Bottom line. The labor market remains hot. That’s impressive given that Fed officials have been aiming to cool it off by tightening monetary policy.
It Still Looks & Walks Like A Duck
April 10 (Monday)
Check out the accompanying pdf and chart collection.
Executive Summary: The tug-of-war between the hard-landers and the soft-landers continues. The twists and turns of recent economic-outlook-impacting events have been taking investors for a ride, but our stance remains steadfastly fixed on one outcome: a soft landing of the broad economy with mini recessions continuing to roll through various sectors. … Friday’s labor market report supports our soft-landing thesis. … While hard-landers think the banking crisis will trigger a credit crunch, causing a recession, we doubt it—believing that scenario will be avoided by the actions taken by the Fed and FDIC. … And: Dr. Ed reviews “Tetris” (+ + +).
YRI Weekly Webcast. Join Dr. Ed’s live webcast with Q&A on Mondays at 11 a.m. EST. You will receive an email with the link one hour before showtime. Replays of the weekly webcasts are available here.
US Economy I: Rollercoaster Ride & Rolling Recession. At the start of this year, the widespread economic consensus was that a hard landing is coming. The consensus changed dramatically during February, when January’s stronger-than-expected economic indicators suggested that a no-landing scenario was more likely. Last week’s batch of economic indicators revived concerns about a hard landing. Debbie and I watched this rollercoaster ride with our feet firmly planted on the ground. The outlook still looks like a soft landing to us. We think that the economy has been in a rolling recession since early last year and is likely to remain in it during the first half of this year.
We can see the rollercoaster ride in the Citigroup Economic Surprise Index (CESI) and in the ups and downs of the 10-year US Treasury bond yield. The CESI peaked late last year at 25.5 on October 20 and 21 (Fig. 1). It fell to this year’s low (so far) of -24.7 on January 18. It rebounded to 61.3 on March 28. It was back down to 31.4 on April 6.
I (Ed) stay away from rollercoaster rides because they make my head spin. The bond market ride has also been a head spinner so far this year. The 10-year bond yield was 3.79% at the start of this year (Fig. 2). It jumped to 4.08% on March 2 and dropped back down to 3.39% at the end of last week. The 2-year yield was just as volatile, as market sentiment flipped from expectations of more Fed tightening in February to suppositions that the Fed is done or almost done. We are in the Fed-is-done-or-should-be-done-soon camp. The 6-month federal funds future yield fell from a peak of 5.67% on March 8 to a low of 4.23% on March 15 and was back up at 4.82% on April 7 (Fig. 3).
Also on a rollercoaster ride has been the Atlanta Fed’s GDPNow tracking model, which at the end of January started with a 0.7% (saar) estimate for Q1’s real GDP growth rate. As more of the quarter’s economic indicators were released, the growth rate was revised steadily higher, to 3.5% on March 23. Since then, it has been revised back down to 1.5% on April 5.
Rollercoaster rides are the main attraction at most amusement parks. Rolling recessions aren’t amusing, but they beat hard landings.
US Economy II: Labor Crunch. Last Friday’s labor market report doesn’t support the hard-landing scenario. It does support the soft-landing one. The same can be said for last Tuesday’s JOLTS report, which showed that while job openings fell by 632,000 during February, they remained plentiful at 9.9 million, or 1.7 open positions for every unemployed person (Fig. 4). This is consistent with the recent solid readings of the Conference Board’s “jobs plentiful” survey and the NFIB’s “small business with job openings” (Fig. 5).
Here is the list of February’s help-wanted count among the major industries from highest to lowest: professional & business services (1.8 million), health care & social assistance (1.7 million), leisure & hospitality (1.5 million), retail trade (829,000), state & local government ex-education (535,000), transportation, warehousing & utilities (488,000), financial activities (476,000), durable goods manufacturing (475,000), and construction (412,000).
Here’s more on the latest labor market readings:
(1) Jobs. The March payroll gain was 236,000, a solid increase though it was the lowest monthly gain since December 2020. The February gain was revised higher by 15,000 to 326,000. Even better was that household employment (which counts the number of people with jobs rather than the number of jobs) was up 577,000 during the month to yet another record high. That exceeded the 480,000 increase in the labor force, so the unemployment rate fell from 3.6% during February to 3.5% during March. Best of all is that the number of workers with full-time jobs rose 1.15 million during March to a record high, according to the household survey (Fig. 6). The number of workers with part-time jobs fell 342,000 during March.
(2) Coincident indicators. Payroll employment (the number of jobs) is one of the four components of the Index of Coincident Economic Indicators (CEI). The other three (i.e., real personal income less transfer payments, industrial production, and real manufacturing & trade sales) might weigh down the CEI. From Friday’s report, we know that the aggregate number of weekly hours worked in manufacturing was flat m/m during March following a 0.5% decline in February. That suggests that industrial production (a CEI component) was also flat in March (Fig. 7).
(3) Earned Income Proxy. Inflation-adjusted personal income is also a CEI component. Friday’s employment report showed that our Earned Income Proxy (EIP) for private wages and salaries in personal income rose just 0.1% m/m (Fig. 8). The 0.1% and 0.3% increases in payroll employment and average hourly earnings were offset by a 0.3% drop in average weekly hours. The latter fell to 34.4 hours during March, which is back within the “old normal” range before the pandemic (Fig. 9).
(4) Sales. The fourth component of the CEI is inflation-adjusted manufacturing & trade sales (MTS). Our inflation-adjusted EIP probably fell 0.3% m/m during March. If so, that would have weighed on disposable personal income and on retail sales, which is included in MTS.
(5) Bottom line. There’s no hard landing suggested by the latest employment report. All in all, the data for payrolls and the other CEI components add up to a soft landing. Nevertheless, when the March CEI is released on April 20, it could be only the second decline in the series since last March. The CEI has been making new record highs since October 2021 even as the Index of Leading Economic Indicators has declined every month since hitting its record high on February 2022 (Fig. 10).
US Economy III: Credit Crunch. The hard-landers aren’t impressed by the strength of the labor market. In their opinion, the banking crisis that started in early March is inevitably going to morph into an economy-wide credit crunch, which will cause a recession.
The soft-landers (including us) believe that the actions taken by the Fed and FDIC to avoid a run of bank runs should work. If so, then there will be enough strength in the labor market to keep the consumers spending. In addition, spending on multi-family housing construction, public infrastructure, ongoing onshoring of supply chains, and green new deals should keep the economy growing, albeit at a slow pace for a while longer.
Whether hard or soft, we are all landers now. We are all watching the Fed’s H.4.1 release on Thursdays at 4:15 pm and the Fed’s H.8 release on Fridays at 4:15 pm. The former is titled “Factors Affecting Reserve Balances of Depository Institutions” and includes weekly data on emergency borrowing by the banks from the Fed. The latter shows the weekly assets and liabilities of the banking system, including deposits, securities, loans, and borrowings. Needless to say, all these variables are important for assessing whether the banking crisis is abating or morphing into a widespread credit crunch.
So, let’s assess the latest weekly data starting with the first week of March, just before Silicon Valley Bank (SVB) imploded on March 10:
(1) Deposits. Even though Friday was a bank holiday, the folks at the Fed stayed around to release the H.8 data. We can compare the commercial bank assets and liabilities since the March 8 week (just before the SVB calamity) and the March 29 week (the latest data). Let’s start with deposits to assess whether the Fed and FDIC have succeeded in averting a widespread bank run.
Apparently so. During this period, deposits declined by $411.2 billion with outflows from large, small, and foreign-related banks of $62.6 billion, $235.3 billion, and $113.3 billion (Fig. 11). The pace of outflows has slowed to $64.7 billion during the latest week.
(2) Borrowing. According to the latest H.4.1 release, showing averages of daily figures through Wednesdays, loans by the Fed totaled $326.4 billion as of the week ended April 5, up $311.0 billion since the week ended March 1. That’s down by $31.6 billion versus the week before. That’s a bit of a relief.
Over this same period, the H.4.1 release shows that “primary credit loans” (i.e., borrowing by banks from the discount window) rose by $66.4 billion to $71.0 billion, which was down $33.9 billion from the week before. Loans by the Bank Term Funding Program (i.e., the new liquidity facility created on March 12) rose to $68.2 billion.
“Other credit extensions” by the Fed jumped from zero before the SVB crisis to $177.9 billion during the April 5 week. This item consists of loans that were extended to depository institutions established by the FDIC, namely SVB and Signature Bank. The Federal Reserve Banks’ loans to these depository institutions are secured by collateral and the FDIC provides repayment guarantees.
The H.8 data show a similar spike in bank borrowings, of $546.0 billion to $2.5 trillion (Fig. 12). That jump was attributable to increases of $304.4 billion, $175.0 billion, and $66.6 billion at large, small, and foreign-related banks.
(3) Securities. On March 29, banks in the US had $5.2 trillion in securities, consisting of $4.2 trillion in Treasury and agency securities and $1.1 trillion of other securities (Fig. 13). From March 8 through March 29, securities held by banks fell $219.2 billion. Much of that might have represented maturing securities that weren’t rolled over to offset deposit losses.
(4) Lending. On March 29, loans and leases at all US banks totaled $12.1 trillion. They are down $38.5 billion since March 8. The record high of $12.2 trillion in this series occurred on March 15 (Fig. 14).
Commercial and industrial loans edged down during the March 29 week (Fig. 15). The same can be said for commercial real estate loans. But residential real estate and consumer loans rose to record highs.
The big worry isn’t about lending by the big banks, but rather by the small banks, particularly in their commercial real estate portfolios (Fig. 16 and Fig. 17). The latter group currently accounts for $1.9 trillion of such loans, or 67% of the total held by the banks.
(5) Loan losses. Last but not least is the H.8 weekly data on allowances for loan losses (Fig. 18). These series have been remarkably stable during the banking crisis, so far. From March 8 through March 29, it is up a piddling $1.5 billion! What banking crisis?
Let’s see what the big banks have to say on this subject during their earnings conference calls this coming week.
(6) Bottom line. Don’t head for the hills just yet. There’s no credit crunch so far in the bank loans data. The run on bank deposits seems to be slowing, as banks have tapped into the Fed’s liquidity facilities. Worry, but be happy.
(7) Special resources. You can monitor charts of the weekly H.8 banking data in our Commercial Banks Book. You can also follow the weekly H.4.1 data including the Fed’s emergency lending facilities in our Fed’s Balance Sheet.
Movie. “Tetris” (+ + +) (link) is a fascinating docudrama about the fourth best-selling video game for Nintendo Entertainment Systems. It was released in November 1989 and sold more than 8 million copies. It was invented by a Russian programmer. The movie is about the free-for-all attempts by various competitors to get the worldwide distribution rights for the game, including for Game Boy, Nintendo’s game-changing device. Among the interested parties was Robert Maxwell, who needed a big hit to bail out his media company after he had stolen millions of pounds from its employee retirement fund. He lost his bid and his life when he drowned after apparently falling off his yacht, the Lady Ghislaine, named after his now infamous daughter.
Oil Markets & AI In HR
April 06 (Thursday)
Check out the accompanying pdf and chart collection.
Executive Summary: Oil futures leapt this week after OPEC+ announced it would cut oil production. Jackie examines possible reasons for the organization’s decision and likely ramifications for Saudi Arabia, the US, and US oil producers. … Also: Judging by the 8% surge in the S&P 500 Oil & Gas Exploration & Production price index over the past week, investors expect the production cuts will mean much better 2023 earnings prospects than the declines that analysts had been expecting. … And: What can’t bots do? Our Disruptive Technologies segment focuses on the use of AI to interview job candidates.
Energy I: Third Time’s the Charm? The oil production cuts by OPEC+ this week mark the third time since the fall that the organization or one of its members has reduced the amount of oil hitting the market—but it’s the first time that the market sat up and paid attention.
Production cuts began in October, when OPEC+ reduced supply by 2.0 million barrels per day (mbd). Then in February, Russia announced that it would reduce production by 0.5 mbd in March, and when March arrived, Russia extended the cuts through the end of June. But the oil market shrugged off both production cuts because economic growth and demand for oil was expected to slow. Central bankers around the world were busy raising interest rates to fight inflation, and then the banking crisis arrived last month, sparking fears of a global recession. Despite the oil production cuts, the price of Brent crude oil futures fell from a November 4 high of $98.57 to a low of $72.97 on March 17 (Fig. 1).
It took a third production cut on Sunday to grab investors’ attention. Saudi Arabia and other OPEC+ members announced plans to cut production by another 1.2 mbd from May through year-end. Together, the three cuts take roughly 3.7% of the world’s oil off the market. And the oil market has responded: The price of Brent crude oil futures has jumped to $84.94 as of Tuesday’s close, up $5.17 from before Sunday’s cut and up $11.97 from its recent low on March 17.
In making its decision, OPEC+ may have been considering the oversupply of crude in the market as well as the softening US economy. Let’s take a look at both factors:
(1) A well supplied market. Before Sunday’s production cuts, the US Energy Information Administration (EIA) expected global oil inventory buildups this year and next because it thought production would continue to outpace consumption, according to the agency’s March 7 Short-Term Energy Outlook. Specifically, the agency estimates global consumption of liquid fuels of 100.9 mbd this year, less than the 101.6 mbd it had expected to be produced, followed by consumption of 102.7 mbd and production of 103.2 mbd next year (versus 99.4 mbd and 100.0 mbd last year). Those production estimates obviously will need to be revised given OPEC’s move on Sunday.
The 1.5 mbd y/y increase in expected 2023 consumption comes from China (0.7 mbd), India (0.2 mbd), and other non-OECD countries (0.5 mbd). Consumption by OECD countries is expected to remain largely unchanged “as the effects of inflation continue to limit GDP and oil demand growth.” Next year, most of the consumption increase (1.6 mbd of the 1.8 mbd forecasted increase) also comes from non-OECD countries.
(2) Prices were expected to fall. As of March 7, the EIA had expected the spot price of Brent crude oil would drop from 2022’s average of $100.94 per barrel to $82.95 this year and $77.57 in 2024. Those estimates will most likely be revised upwards, as OPEC+ has drawn a new line in the sand.
“Before previous production cuts announced in October, Saudi officials said they believed economic data indicated that the government budget required $90 to $100 a barrel for Brent crude, above the $75 to $80 range the kingdom was targeting,” an April 3 WSJ article reported.
(3) Anticipating a softening US economy. It’s possible that OPEC+ oil ministers expected the economic soft landing that appears to have arrived in the US. The regional manufacturing purchasing managers index came in decidedly negative last month, sinking to its lowest level in nearly three years. It was below the break-even point of 50.0 for the fifth successive month, and even the red-hot service sector slowed, with March’s reading of 51.2 coming in below the previous reading of 55.1.
Jobs were still plentiful in February, though there were fewer job openings (9.9 million) than last March, when openings were at a record-high 12.0 million. And the 10-year Treasury yield fell to 3.35% on Tuesday, down from its recent peak of 4.08% on March 2 (Fig. 2).
Energy II: Politics Behind the Cuts. The tangled webs binding Saudi Arabia, China, Russia, and the US make oil prognosticating more involved than counting barrels of oil produced and consumed. Let’s take a look at some of the actors in this drama and what Saudi Arabia’s cuts on Sunday will mean to them:
(1) Saudis and US at odds. President Joe Biden got off on the wrong foot with Saudi Arabia’s Crown Prince Mohammed bin Salman before landing in the White House. As a presidential candidate, Biden in a debate pledged to make Saudi Arabia a “pariah” because the Crown Prince was considered responsible for the killing of prominent dissident and Washington Post columnist Jamal Khashoggi. As president, Biden tried to sidestep the Crown Prince, who essentially runs the country, and work instead with his 85-year-old father King Salman. It’s doubtful that Biden’s attempt to repair the damage last year by visiting the country and fist-bumping the Crown Prince erased memories of the “pariah” comment.
The Saudi production cuts could push US gasoline prices to $4 a gallon, according to some analysts, and that could hurt the US in several ways, pressuring US inflation higher, slowing the US economy, and making the Federal Reserve’s job tougher. Higher costs related to oil prices could weigh on US consumption as well as corporate margins and profits.
(2) Saudis help Saudis. Higher oil prices will help fund Saudi Arabia’s ambitious domestic projects aimed at boosting economic growth and diversifying the country’s economy beyond its dependency on black gold. Among its projects, Saudi Arabia is constructing a new, $500 billion city in the desert that’s 33 times bigger than New York City and it’s building a Red Sea resort the size of Belgium.
Saudi Arabia also appears to be trading its relationship with the US for one with China, the world’s second largest consumer of oil. Last week, Saudi Arabia’s cabinet approved a plan to join the Shanghai Cooperation Organization (SCO) as a dialogue partner, an April 4 article on Oilprice.com reported. SCO is one of the world’s largest political, economic, and defense organizations. “It was formed in 2001 on the foundation of the ‘Shanghai Five’ that was set up in 1996 by China, Russia and three states of the former USSR (Kazakhstan, Kyrgyzstan, and Tajikistan),” the article explains. The organization believes we live in a multi-polar world that China expects to dominate by 2030.
(3) Saudis help US producers. If the OPEC+ cuts continue to keep oil prices high, it could raise the cash flows and earnings of US oil companies and shale drillers. Shale producers have been keeping their production relatively flat and returning excess cash to investors or repurchasing stock instead of using it to increase production.
“US production growth is less than half of what it was before 2020, with overall output yet to return to pre-pandemic levels. Major forecasters see growth of just 500,000 barrels a day or so this year from the Permian Basin, the country’s fastest-growing shale field, less than half of the more than 1 million barrels a day of cuts announced by OPEC+ on Sunday,” an April 4 Bloomberg article reported.
Higher oil prices may tempt shale producers to produce more, if they can access the equipment and materials necessary, the article noted. The US rig count at 592 is near a recent peak of 627 during the weeks of November 25 and December 2, but it’s well below the 2014 peak of 1,609. US oil production has risen to 12.2mbd, well off its Covid lows but still 900,000 barrels off its pre-pandemic highs (Fig. 3).
(4) Saudis help Russia. Saudi Arabia’s production cuts have increased the price of crude oil by roughly $5 a barrel, and that means more cash flowing into Russia’s coffers to fund its war with Ukraine. It’s exactly what the US and European countries were trying to prevent by placing caps on the price of oil that Russia sells.
“Every $1 increase in the price of crude oil boosts Russian export revenues by about $2.7 billion a year,” reported an April 4 article in The Telegraph, which cites Benjamin Hilgenstock, author of a report on Russian sanctions for the Centre for Economic Policy Research, a think tank.
The OPEC move is also interpreted as the organization’s embrace of Russia and China as it shuns the US and other Western nations. The shift makes sense considering that future demand for oil is expected to come from Asian nations and not from the West.
(5) Saudis help EV producers. Electric vehicle (EV) sales have been picking up nicely in the US and globally, but they’re likely to receive a boost if gas prices rise due to the OPEC+ production cuts. There’s nothing like paying $4 a gallon at the pump to convince car buyers to give EVs a shot.
GM sold 20,000 EVs in Q1, expects to sell another 30,000 EVs this quarter, and anticipates selling twice those amounts during the H2-2023 quarters, an April 3 CNBC article reported. It’s a pittance compared to GM’s total Q1 car deliveries of just over 600,000. But the Q1 growth occurred despite falling gas prices.
Jackie and three of her friends each have purchased EVs or plug-in hybrid vehicles over the past year or so. That has prompted us to keep tabs on a chart that shows the number of miles driven by all motor vehicles plateauing after rebounding from Covid lows, while gasoline usage has fallen 4.6% from its recent peak on March 25, 2022 (Fig. 4).
Use of mass transit is also slowly recovering from the pandemic, when everyone opted to stay home or drive places in their cars. New York City subway trips rose to 84.3 million in February, which was 65% of the pre-pandemic February 2019’s ridership levels but up decently from the prior three Februarys’ ridership counts relative to pre-pandemic levels: 37% in 2020, 48% in 2021, and 56% in 2022, according to a March 16 report from the NYC Comptroller. Weekend ridership has been closer to 2019 levels than weekday ridership, indicating that further improvement may require more people returning to the office full time.
Energy III: Shares Jump. Last week’s cut in oil production has energized the S&P 500 Energy sector’s price index. For the week ending Tuesday, Energy is the S&P 500’s top performing sector, up 5.7% compared to the S&P 500’s 3.3% gain over the same period. Certain industries within the sector had even better performance stats over the past week: Oil & Gas Exploration & Production (8.0%), Integrated Oil & Gas (6.7), and Oil & Gas Equipment & Services (6.0). The only major underperformer: Oil & Gas Refining & Marketing (-3.9).
Given the recent jump in Oil & Gas Exploration & Production shares, investors seem to be betting that analysts’ current earnings and revenues estimates are likely to get upwardly revised. Current estimates suggest y/y declines in the industry’s revenues and earnings this year after both leapt last year—revenues down 14.9% in 2023 after jumping 54.3% in 2022 and earnings down 16.5% this year after having risen 122.8% last year (Fig. 5 and Fig. 6). These estimates imply a forward profit margin that slumps from a 12-year high of 34.4% last June to 26.5% over the next 12-months (Fig. 7). But if the production cuts mean what investors seem to think they do, the industry’s outlook may not be so pessimistic.
Disruptive Technologies: The AI Job Interview. Human resources departments have long used computer algorithms to scroll through stacks of resumes to identify the best candidates for a job. More recently, hiring pros have begun using artificial intelligence (AI) programs to judge recorded job interviews. Between 35%-45% of companies are expected to use “AI-based talent acquisition software” to evaluate job candidates in the coming year, a January 12 article in Computerworld reported.
In an AI interview, job candidates sitting in front of a computer are asked to respond rapidly to questions from the company. Responses are recorded and evaluated by AI systems. The candidate may be judged on visual or verbal cues, like how often they smile, use certain words, or their tone. AI programs might use data on these cues collected from past hires to determine whether the interviewee will be a good hire, a February 7 article in the Harvard Business Review explained.
The automated process should save recruiters time and money. Fans believe AI programs will be unbiased, or at least they should have fewer biases than their human counterparts. But others caution that AI systems may reflect the biases of their programmers, and because the AI is in a black box, interviewees won’t know what those biases are.
Colleges have been offering students training to prepare for this new method of interviewing. It’s just one more hoop that job applicants need to jump through before seeing an actual HR professional.
All About Earnings
April 05 (Wednesday)
Check out the accompanying pdf and chart collection.
Executive Summary: Today, we analyze the analysts, specifically industry analysts’ recent earnings and revenue estimate revision behavior. Their collective earnings estimate shaving doesn’t suggest recession jitters, in our view, even though flattish y/y revenues expectations may indicate concern about unit sales. Forward earnings remains consistent with a soft landing. … And: Analysts typically do lower their quarterly estimates as a quarter progresses, often setting the stage for a positive earnings surprise. Joe highlights the takeaways from data on earnings estimate revisions that occur in the runup to reporting seasons, including what the data say about Q1-2023.
Earnings I: Analysts Shaving. Industry analysts following S&P 500 companies continue to lower their outlook for 2023 and 2024 earnings per share (Fig. 1). Yet S&P 500 forward earnings has stabilized around $227 per share over the past seven weeks. That’s because 2024’s consensus estimate remains higher than 2023’s consensus estimate. As time passes, the former’s weight in the calculation of forward earnings increases as the latter’s decreases (since forward earnings is the time-weighted average of analysts’ consensus estimates for this year and next).
Let’s have a closer look:
(1) Revenues. S&P 500 revenues estimates have been holding up quite well. During the week of March 16, industry analysts collectively predicted revenues of $1,801 per share this year and $1,888 next year (Fig. 2). Those estimates have been relatively steady since H2-2022. Analysts tend to be too optimistic when the economy is expanding, causing them to lower their projections as the actual results become available during earnings reporting seasons (Fig. 3).
During 2021 and 2022, however, analysts weren’t being overly optimistic when higher-than-expected inflation led them to raise their revenues outlook; they were right to do so. Given that inflation remains relatively high, the recent flatness in the 2023 and 2024 revenues estimates might reflect concern about the prospects for unit sales (Fig. 4).
S&P 500 forward revenues per share is a great high-frequency (weekly) indicator of actual quarterly revenues (Fig. 5).
(2) Earnings. Industry analysts also tend to be too optimistic about earnings during economic expansions, causing them to lower their annual estimates as earnings are released (Fig. 6). That’s making it hard to discern whether the downward trend in the 2023 and 2024 consensus estimates reflects any mounting concern about an imminent recession. Forward earnings is a more reliable economic indicator than its annual components (Fig. 7). It is currently consistent with a soft-landing economic scenario rather than a hard one, in our opinion.
As of the March 30 week, industry analysts projected S&P 500 earnings per share of $220.45 this year and $247.57 next year. So earnings are expected to be up just 0.3% this year and 12.0% next year (Fig. 8).
Also, S&P 500 forward earnings is a great high-frequency (weekly) indicator of actual quarterly earnings (Fig. 9). It is showing a softer landing than is the forward revenues series, for now.
(3) Margins. If there is a recession in all these numbers, it’s clearly a profit margin recession. We can calculate weekly profit margin estimates simply by dividing weekly earnings estimates by weekly revenues estimates. Since the start of this year through the March 16 week, the analysts’ consensus expected S&P 500 profit margin for 2023 fell from 12.5% to 12.1% (Fig. 10). The margin estimate for 2024 fell from 13.3% to 12.9% over the same period.
These are still relatively high, but similar declines occurred during the pre-pandemic economic expansion years from 2011 through 2019. Joe and I attribute the current margin squeeze to rising labor costs, which we expect will ease as the hot labor market cools off in a soft-landing scenario. We also expect that productivity growth will make a comeback later this year.
In any event, the actual quarterly operating profit margin for the S&P 500 fell to 11.6% during Q4-2022, down from a record high of 13.7% during Q2-2021 (Fig. 11). The weekly forward profit margin, which we calculate using forward earnings and forward revenues, was down to 12.3% during the March 16 week from a record-high 13.4% during the June 9, 2022 week.
So maybe there isn’t much more downside for the profit margin. Obviously, if the hard-landers are right, there will be lots more downside for revenues, earnings, margins, valuations, and the stock market. That’s not our story, but rather the risk to it.
(4) S&P 500, M-PMI, NRRI & NERI. On Monday, we learned that the M-PMI was down to 46.3, the lowest reading since May 2020 (Fig. 12). That’s somewhat unsettling because the yearly percent change in the S&P 500 is highly correlated with it. Then again, the S&P 500 fell to a low of -16.5% y/y during October and rose to -9.6% during March, suggesting that the worst may soon be over for the M-PMI.
By the way, the yearly percent change in the S&P 500 is also highly correlated with the S&P 500’s Net Revenues Revisions Index (NRRI) and Net Earnings Revisions Index (NERI) (Fig. 13 and Fig. 14). NRRI was in negative territory from August through January and turned slightly positive during February and March. On the other hand, NERI has been negative since July through March.
(5) STRG, STEG & LTEG. Also consistent with soft-landing readings recently have been analysts’ consensus Short-Term Revenues Growth (STRG), Short-term Earnings Growth (STEG), and Long-Term Earnings Growth (LTEG) (Fig. 15). As of the March 16 week, they were 2.6%, 4.2%, and 9.8%. During the previous two recessions, STEG turned negative.
Earnings II: Looking Ahead to Q1’s Earnings Season. Joe has been tracking the S&P 500’s quarterly earnings forecasts each week in our S&P 500 Earnings Squiggles (Annually & Quarterly) publication since the series started in Q1-1994.
The typical playbook has been for analysts to cut their estimates gradually over the course of a quarter until reality sets in during the final month of the quarter, when some companies warn of weaker results. The combination of reduced forecasts for poorly performing companies and steady forecasts for companies that are quietly keeping good news close to their vests inevitably leads to an earnings hook in the chart, indicating a positive surprise.
The strong recovery following the Great Virus Crisis (GVC) had analysts scrambling to raise their forecasts for six straight quarters from Q2-2020 through Q3-2021—and still not coming close to the actual earnings results. This period saw the S&P 500 record unusually high double-digit-percentage earnings beats for the first time since the aftermath of the Great Financial Crisis (GFC) in 2009-10. The earnings-surprise tide turned in Q1-2022, and this data series has remained weak since Q3-2022.
Joe separates the good news from the bad news. Let’s have a closer look:
(1) Still an uphill run to the finish line, but not getting steeper. After falling slightly during H1-2022, the pace of analysts’ earnings estimate declines made over the course of the quarter accelerated in Q3-2022, when estimates dropped 6.6%. The pace hasn’t let up since, but it’s not getting substantially worse. The Q4-2022 estimate was down 5.9% during the runup to that quarter’s earnings reporting season, and the Q1-2023 estimate is down a nearly similar 6.2%.
This recent trend marks a return to estimate cutting as usual. In the 105 quarters from Q2-1994 to the GVC in Q2-2020, the consensus earnings estimate fell more than 85% of the time (90 quarters) during the runup to earnings season. Of the gains that occurred the rest of the quarters, half were following the GFC, when shell-shocked analysts mistimed the recovery. Post-GVC, the consensus estimate rose for six straight quarters through Q4-2021 before the earnings recovery fizzled during H1-2022. The quarterly estimate now has declined for five straight quarters including Q1-2023.
(2) More sectors have falling estimates. Analysts have been too bullish and overestimated the length of the post-GVC boom in earnings. More and more sectors now are seeing their collective Q1-2023 earnings estimates decline during the runup to earnings season.
For perspective, at the peak in Q2-2021, nine of the 11 S&P 500 sectors experienced rising estimates for the quarter over the course of the quarter (Fig. 16). By Q1-2022, that was down to five sectors (Energy, Financials, Real Estate, Tech, and Utilities) (Fig. 17). That count dwindled to just one sector during Q3-2022 (Energy) and Q4-2022 (Utilities). For Q1-2023, Utilities remains the only sector with an earnings forecast that rose during the quarter (Fig. 18).
Prior to the Regional Bank Crisis (RBC) in early March, Financials’ estimate had been down just 2% since the start of Q1-2023, which made it the second-best performer of the 11 sectors. It quickly tumbled to -13.2% during the last two weeks of the quarter and now ranks last among the 11 S&P 500 sectors. Financials’ decline would have been considerably worse had Signature Bank and Silicon Valley Bank not been removed from the index by S&P.
Here's how much each sector’s Q1 estimate changed over the course of the quarter: Utilities (5.1%), Consumer Staples (-2.7), Communication Services (-6.8), Tech (-6.9), Energy (-7.5), Industrials (-7.8), Real Estate (-8.0), Health Care (-8.9), Consumer Discretionary (-10.9), Materials (-12.1), Financials (-13.2).
(3) More sectors to show y/y growth in Q1. Four sectors are expected to record positive y/y percentage earnings growth in Q1-2023, up from only two sectors in Q4-2022 (Energy and Industrials). The top three projected double-digit-percentage growers for Q1 are: Consumer Discretionary (36.4%), Industrials (17.9), and Energy (13.7). Surprisingly, Financials comes in at 5.2% growth. Analysts expect the S&P 500’s Q1-2023 earnings growth rate to weaken from the Q4-2022 level, to -7.5% y/y from -1.6% on a frozen actual basis and to -5.0% from -3.2% on a pro forma basis.
Here are the seven sectors expected to report y/y earnings declines in Q1-2023: Materials (-33.5%), Health Care (-18.8), Tech (-14.4), Communication Services (-12.6), Utilities (-9.9), Real Estate (-8.0), and Consumer Staples (-4.8)
(4) Y/y growth streaks: winners and losers. The S&P 500 is expected to record its second straight quarter of y/y earnings declines in Q1-2023. However, the Energy and Industrials sectors remain on strong positive earnings growth paths. Energy is expected to record a ninth straight quarter of growth, followed by Industrials at eight quarters. Consumer Discretionary’s expected earnings growth rises y/y after falling in Q4-2022, and Financials’ rises after dropping for four quarters.
For Communication Services and Utilities, Q1-2023 is expected to mark a fourth straight quarter of y/y earnings declines. For Consumer Staples, Materials, and Tech, the streak would be three quarters long and for Health Care and Real Estate two quarters.
Crosscurrents
April 04 (Tuesday)
Check out the accompanying pdf and chart collection.
Executive Summary: All 11 sectors of the S&P 500 are up since October 12, which we believe was the bear market’s bottom and the start of a new bull market in stocks. Leading the charge has been the MegaCap-8 stocks, which collectively now make up nearly a quarter of the S&P 500’s capitalization and nearly half of the S&P 500 Growth index’s. … With all the focus on a prospective credit crunch, gone relatively unnoticed are two market-buoying positives: Corporate cash flow hit a record high at year-end 2022, and the global economy has been proving rather resilient.
Weekly Webcast. If you missed Monday’s live webcast, you can view a replay here.
Strategy I: Bear Market Rally? We Don’t Think So. We still think that October 12, 2022 marked the bottom in—and end of—the latest bear market (Fig. 1). The S&P 500 is up 14.9% since then through Friday’s close (Table 1). All 11 sectors of the S&P 500 are up since then as well. We’ve been recommending overweighting the Energy (up 3.0%), Financials (6.4%), Industrials (19.4), Information Technology (29.2%), and Materials (17.8%) sectors. Three of them have outperformed the S&P 500, while two of them have lagged (Fig. 2).
We don’t think this strength has been just a rally in a bear market. The Nasdaq is arguably in a bull market, since it is up 19.7% from last year’s low on December 27 through Friday’s close (Fig. 3). In fact, on a logarithmic scale, the Nasdaq remains on the uptrend line that started from the bottom of the bear market at the start of 2009! It is up 863% since then even though it’s 24.1% below its record high on November 18, 2021. Over this same period, the Nasdaq 100 is up 1,163% (Fig. 4). It is up 23.4% since late last year’s low.
They’re back: Leading the way higher has been the MegaCap-8 group of stocks (i.e., Alphabet, Amazon, Apple, Meta, Microsoft, Netflix, NVIDIA, and Tesla):
(1) Market capitalization. The market cap of the MegaCap-8 bottomed early this year, on January 5, at $6.8 trillion (Fig 5). It rebounded 35% since then to $9.2 trillion. Since October 12 of last year, the S&P 500’s market cap is up 14.0% with and 11.6% without the MegaCap-8.
(2) Market-cap share. The MegaCap-8 currently accounts for about 24% of the S&P 500’s market cap and about 45% of the S&P 500 Growth index (Fig. 6).
(3) Valuation. On Friday, the forward P/E of the MegaCap-8 was 28.0, up from this year’s low of 21.1 on January 6 (Fig. 7). The forward P/Es of the S&P 500 with and without the Mega-Cap-8 were 17.3 and 15.4.
(4) Investment styles. The outperformance of the MegaCap-8 since October 12 explains the outperformance of S&P 500 LargeCaps (14.9%) relative to the S&P 400 MidCaps (11.5%) and the S&P 600 SmallCaps (8.5%).
Interestingly, S&P 500 Growth, which underperformed S&P 500 Value during last year’s bear market and through the end of 2022, has outperformed Value since the banking crisis started in early March (Fig. 8). The same can be said about the equal-weighted S&P 500 relative to the market-cap-weighted index (Fig. 9).
Strategy II: Record Corporate Cash Flow. While the banking crisis has caused much ink to be spilled in speculation about a possible credit crunch, not much has been written about the fact that corporate cash flow rose to a record high of $3.2 trillion (saar) at the end of last year (Fig. 10).
After-tax corporate profits rose to a record high of $2.5 trillion, while dividends totaled $1.7 trillion, leaving $821 billion in undistributed profits (Fig. 11). Undistributed profits plus record economic depreciation of $2.4 trillion equaled Q4’s corporate cash flow.
That’s all based on data in the National Income & Product Accounts (NIPA) compiled by the Bureau of Labor Statistics (BLS). The Fed’s Financial Accounts of the United States shows similar data for nonfinancial corporate cash flow, which rose at the end of last year to a record high of $3.0 trillion, well exceeding the record $2.5 trillion in capital spending on a current-dollar basis (Fig. 12).
Global Economy: No Boom, No Bust. Yesterday, Bloomberg reported that OPEC+, including Russia, pledged to reduce its production by more than 1 million barrels a day starting next month and lasting through the end of the year. The reduction surprised the energy markets, which had expected the cartel to hold output steady. Adding to the shock, the decision came outside of the group’s scheduled timetable for reviewing the market’s demand and member’s supplies.
Debbie and I view the cartel’s decision as a defensive move to avert a further slide in the price of oil rather than to push it back up aggressively. The nearby price of a barrel of Brent crude oil jumped over $110 per barrel early last year when Russia invaded Ukraine (Fig. 13). It was back down to $79 at the end of last week when futures prices were in backwardation, i.e., the futures prices followed a downward-sloping curve that put them below spot prices (Fig. 14).
The global economy was expected to get a big boost after China abandoned its zero-Covid policy at the beginning of December last year. Apparently, that rebound in China’s economy has been muted, as evidenced by falling oil prices. The price of copper, which is a very sensitive indicator of economic activity, did rally during January on expectations of a stronger rebound in China’s manufacturing sector than subsequently occurred (Fig. 15).
Let’s review a few of the latest data points for the global economy:
(1) Global M-PMI. Debbie observes that the JP Morgan Global M-PMI is hovering around the breakeven point of 50.0, ticking down to 49.6 in March after edging up from 48.7 in December (the lowest since mid-2020) to 50.0 this February (Fig. 16). She adds that March data are available for 31 nations, with 13 signaling expansions in output, 17 signaling contractions, and one—China—at the 50.0 breakeven point.
(2) US M-PMI. We aren’t surprised by the weakness in the US M-PMI reported yesterday for March. The five regional business surveys we track suggested that was likely to happen. The overall index fell further below 50.0 to 46.3, and its three major components did the same: new orders (44.3), production (47.8), and employment (46.9).
Yes, we know that gives the hard-landers something to gloat about. However, we see the weakness in goods production and distribution as a rolling recession that has been offset by consumers pivoting from buying goods to purchasing services. That’s been the trend since mid-2021 (Fig. 17).
(3) Eurozone sentiment. The Eurozone’s economic sentiment indicator fell below 100 during July 2022 on fears of energy shortages during the winter, which did not happen (Fig. 18). It bottomed at 93.8 during October and rebounded back to 99.3 during March. That reading is consistent with no growth in the region’s real GDP on a y/y basis.
Banking Crises, Then & Now
April 03 (Monday)
Check out the accompanying pdf and chart collection.
Executive Summary: The S&L crisis of 1990 caused a mild, short-lived recession impacting earnings but not triggering a bear market in stocks. Conversely, we had a bear market last year but no recession (yet?). Similarly, though, the commercial real estate market was hit hard during 1990’s banking crisis and stands now in the eye of the SVB storm, since small banks—the most vulnerable—make most CRE loans. … Also: Do you wonder why consumer spending has been so resilient lately? That huge demographic cohort that disrupts the status quo at every life stage is at it again. … And: For stock traders, Joe Feshbach’s take on the market. ... Finally: Dr. Ed reviews “Godfather of Harlem” (+ + +).
YRI Weekly Webcast. Join Dr. Ed’s live webcast with Q&A on Mondays at 11 a.m. EST. You will receive an email with the link one hour before showtime. Replays of the weekly webcasts are available here.
Banks I: 1990 & 2023. There was a banking crisis in 1990. It was centered in the Savings & Loan (S&L) industry. It caused a mild recession that lasted only eight months (Table 1). Real GDP fell only 1.3%, and the Index of Coincident Economic Indicators declined 2.6% from peak to trough (Fig. 1 and Fig. 2). It was a relatively soft landing compared to other recessions.
Back then, S&P 500 forward earnings per share fell 8.9%, and actual operating earnings fell 21.8%, measured from peak to trough (Fig. 3). Yet there was no bear market in the S&P 500. Instead, there were two corrections, from January 2, 1990 to January 30, 1990 (-10.8% over 28 days) and from July 16, 1990 to October 11, 1990 (-19.9% over 87 days) (Fig. 4 and Table 2).
The S&L crisis put a lid on home mortgage lending and depressed commercial mortgage lending (Fig. 5 and Fig. 6). That depressed housing starts and commercial real estate construction. As a result, the drop in real GDP was led by private residential investment in single-family and multi-family structures and private nonresidential fixed investment on commercial and health care structures (Fig. 7, Fig. 8, and Fig. 9).
This time has been different: There has been a bear market but no recession, so far. The S&P 500 fell 25.4% over 282 days from January 3, 2022 through October 12, 2022 (Fig. 10). It was a relatively short and shallow bear market, assuming as we do that it is over.
On the other hand, this time is similar in that the economic weakness since early last year, when the Fed started tightening, has been led by single-family housing construction. However, multi-family housing construction remains strong. The next shoe to drop may very well be commercial real estate (CRE) as a result of the banking crisis. Small banks account for 67.5% of all outstanding CRE loans (Fig. 11 and Fig. 12).
Banks II: The S&L Crisis. In my 2018 book Predicting the Markets, I reviewed what happened during the S&L crisis:
“The next recession was short, lasting just the eight months from July 1990 through March 1991. The first Gulf War during the second half of 1990 triggered another spike in oil prices. Once again, consumers retrenched, causing the inventory-to-sales ratio to spike. So production and employment dropped, but not for long. This time, the unemployment rate peaked at 7.8% during June 1992, or 15 months after the official end of the recession. No doubt there were plenty of unemployed workers at the time who thought the NBER had called the recession’s trough too soon.
“In addition, this recession included a financial contagion in the thrift industry, which was the consequence of the industry’s haphazard deregulation following previous bouts of disintermediation, as I show in Chapter 8. The industry’s lobbyists successfully convinced Congress to deregulate thrifts so that they could pay market rates on their deposits. Unscrupulous thrifts gained market share and fees by paying premium deposit rates and making lots of dodgy loans. It ended badly, with a few thrift executives going to jail.
“Once again, there was a credit crunch as depositors lost their confidence in thrifts even though they were mostly insured. This time, the rolling recession hit both residential and commercial real estate hard, while the overall national downturn was relatively short and shallow. That was my forecast after I thoroughly examined the nature of the thrift crisis and concluded that it would be relatively contained. Housing starts dropped to only 798,000 units during January 1991; at the time, this was the lowest on record for the series, which started at the beginning of 1959.”
US Consumers: Baby Boom Buying Binge. The Atlanta Fed’s GDPNow tracking model is showing (as of March 31) that real GDP rose 2.5% (saar) during Q1. That’s a downward revision from the previous estimate of 3.2% on March 24. The model’s estimate for the pace of real consumer spending is down from 5.0% to 4.6% over those few days, which is still remarkably strong.
How can we account for the resilience of consumer spending? Consider the impact of the Baby Boomers on consumption:
(1) Retiring and expiring. The Baby Boomers were born between 1946 and 1964. They are 59-77 years old currently. They are retiring after having accumulated more wealth per household than any other previous generation. Many of them have the means to live very comfortably in retirement. Many of them have the option to decide how much of their wealth to spend on themselves versus leaving it for their descendants, who may be rightly expecting a windfall when their parents expire.
(2) Labor market remains strong. There are currently 57.6 million people who are 65 years old and over, with 46.6 million not in the labor force (Fig. 13). Both are record highs. The latter group has increased by 13.6 million since the oldest Baby Boomers turned 65 years old in 2011.
As they started to retire, they exacerbated the shortage of labor, especially since the pandemic. Now the retired seniors are boosting the demand for labor in the most labor-intensive industries, namely food services and health care. With more jobs like these at higher pay than ever before, consumers’ purchasing power has gotten quite a boost. Real disposable income is up 3.3% y/y through February (Fig. 14). Real consumer spending is up 2.5% over this same period (Fig. 15).
(3) Lots of homeowners’ equity. Notwithstanding the recession in the single-family housing market, home prices have held up remarkably well (Fig. 16). That’s because there is a shortage of homes for sale. Many homeowners, including lots of Baby Boomers, who locked in record-low mortgage rates in recent years aren’t in a rush to sell their home and buy a new one at much higher mortgage rates.
As a result, at the end of last year, the value of household real estate was a record $43.5 trillion, with owners’ equity at a record $31.0 trillion (Fig. 17). Owners’ equity as a ratio to disposable personal income was 1.62 during Q4-2022, edging down from the record high of 1.69 during Q2-2022 (Fig. 18).
Strategy: For Traders. Here are Joe Feshbach’s latest thoughts on the S&P 500: “The S&P 500 is now up 4% from the level at which the buy signal occurred on the incredibly reliable stochastic I use. It’s certainly tough to ignore this technical indicator. I concluded last week by saying that if the market does continue Friday’s rally, the sentiment indicators are just not good enough to support a real good rally and I’d rather wait for more improvement before getting too optimistic short term.
“I guess if the S&P 500 takes out its early February high, which the Nasdaq has already done, that would classify as a decent rally off the stochastic buy signal. However, with the sentiment indicators just not in great shape (albeit but one), that’s really all I can see as upside for this rally. If you played it, I’d suggest cutting back on price strength, and if not I’d say wait for a better opportunity in the future.”
Movie. “Godfather of Harlem” (+ + +) (link) is a very entertaining and informative television series about the turmoil in Harlem during the 1960s. It is based on the true story of infamous crime boss Bumpy Johnson, played by Forest Whitaker. He had a very bumpy relationship with the Italian crime bosses as they vied to control the drug trade in Harlem. The docudrama also covers the civil rights movement during that turbulent period. It is as much about the struggles of Malcolm X and Adam Clayton Powell Jr. against discrimination as about Bumpy.
Financials, Semis & The Fountain Of Youth
March 30 (Thursday)
Check out the accompanying pdf and chart collection.
Executive Summary: Financial companies have had it rough lately, but those involved in the capital markets should benefit from easy y/y comparisons this year. Jackie recaps takeaways from Jeffries’ fiscal Q1 earnings, as the early reporter may be a bellwether for the industry, as well as industrywide data and analysts’ expectations for the S&P 500 Investment Banking & Brokerage industry. … Also: The semiconductor industry downturn may finally be ending, says Micron Technology’s CEO. But semiconductor investors are already focused on 2024’s better growth prospects. … And in our disruptive technologies spotlight: a breakthrough in anti-aging science.
Financials: Rebound Delayed. Financial companies with investment banking and capital markets businesses have had a rough Q1 with the capital markets slamming shut after the demise of Silicon Valley Bank and others. But last year was no picnic for them either. The Federal Reserve raised interest rates seven times over the course of 2022, and the federal funds rate jumped 425 ppts to a target range between 4.25%-4.50%. Inflation spiked, bond prices fell, and recession fears rose.
We believe that the investment banking and capital markets businesses will bolster financial companies’ bottom lines as 2023 progresses because comparisons to 2022 are relatively easy. The recent banking fiasco may just have pushed that optimistic scenario out by a quarter or two.
Investors got their first look at Q1-2023 earnings when Jefferies Financial Group reported results on Tuesday for its quarter ending February 28. The firm’s Q1 net revenue dropped 24% y/y, and operating earnings fell 60.6% y/y to $129.3 million. But behind that dour news, there were a few reasons for optimism. Here’s Jackie’s look at Jefferies’ results and the industry’s investment banking business in general:
(1) Faint signs of improvement. Jefferies’ Q1 investment banking and capital markets revenue tumbled 17% y/y, but it looks appreciably better on a q/q basis, as these results were quite depressed during Q4. Q1 revenue from equity underwriting rose 14.6% q/q, debt underwriting revenue rose 29.9% q/q, and equity and debt capital markets revenue jumped 33.8% q/q, reported the company. Only Jefferies’ advisory fees declined q/q, by 22.1%.
Jefferies’ Q1 earnings beat analysts’ consensus estimate, which had been progressively cut for the last three months. Jefferies’ earnings per share of 54 cents was down sharply from last year’s $1.23 a share, but it topped analysts’ consensus estimate of 43 cents a share, a March 28 Reuters article reported. And while analysts expect this year’s earnings per share to be flat or down slightly from last year’s ($2.99 versus $3.06), they remain optimistic about the future, with 2024 earnings forecast to surge to $4.43 a share.
(2) Similar patterns industrywide. Just as we saw in Jefferies’ results, industrywide data on Q1 capital markets activity fell on a y/y basis but improved for many categories on a q/q basis. US high-yield issuance in Q1 of $45.2 billion was down from Q1-2022’s $54.4 billion but nearly triple Q4-2022’s $15.5 billion, according to Dealogic data in the WSJ. The investment-grade debt picture shows a similar, if less dramatic, pattern: Q1 underwriting volume of $406.0 billion fell short of Q1-2022’s $502.0 billion but dwarfed Q4-2022’s $216.1 billion.
The equity offering bust has been even more dramatic. In Q1, IPO offerings fell to $2.4 billion, less than a fourth of the $10.9 billion of Q1-2022 but double the $1.1 billion of Q4-2022.
Unsettled markets have also doused CEOs’ willingness to make acquisitions. US-targeted M&A activity fell to $275.9 billion in Q1, down from $492.1 billion in Q1-2022 and $324.9 billion in Q4-2022.
(3) Earnings estimates have room to fall. The S&P 500 Investment Banking & Brokerage industry’s stock price index has fallen 15.0% ytd through Tuesday’s close and 27.4% from its January 11, 2022 peak (Fig. 1). The industry’s index is 1.8% below its October low.
The industry posted losses last year, with revenue dropping 10.5% and earnings declining even more, 30.7%. Analysts’ net earnings revisions have been negative since late last year. Even so, the consensus estimate calls for an earnings rebound despite the tough current environment. Revenue is forecast to increase 5.7% this year and 6.6% in 2024 (Fig. 2). Likewise, earnings are forecast to jump 14.1% this year and 18.0% in 2023 (Fig. 3).
Investors aren’t as sanguine. The industry’s forward P/E has fallen to 10.6, down from 11.8 at the start of the year and from 13.8 at its recent peak in February 2022 (Fig. 4).
Information Technology: Micron Calls the Semi Industry Bottom. The chip industry is slogging its way through the worst downturn in the last 13 years, confirmed Micron Technology CEO Sanjay Mehrotra on Tuesday during the company’s fiscal Q2 (ended March 2) conference call. But he also offered up some rays of hope about future sales and inventory levels. He expects the volume of shipments for DRAM and NAND chips to “increase on a sequential basis from here on” and the industry’s demand and supply balance to “gradually improve through the course of the year.”
The optimistic outlook helped the chip manufacturer’s shares rise 7.2% Wednesday as investors looked past Micron’s Q2 inventory write-down and y/y sales declines.
Here’s a look at some of the details:
(1) AI needs lots of chips. One of the strongest areas of Micron’s business is selling chips for servers used in data centers. After declining in recent quarters, server sales will start to grow again in the current quarter (fiscal Q3, ending June 2), and data center customer inventories will be healthy by the end of 2023, said Mehrotra. in the company’s fiscal Q2 earnings conference call on Wednesday.
Artificial intelligence (AI) is a secular driver of demand growth in data centers. “An AI server today can have as much as 8x the DRAM content of a regular server and up to 3x the NAND content,” Mehrotra said.
(2) PC market still resizing. PC demand is normalizing after the pandemic-sparked surge, Mehrotra said, but PC customer demand for chips should improve nonetheless. “Although still elevated, client customer inventories have improved meaningfully, and we expect increased bit demand in the second half of the fiscal year,” said Mehrotra.
(3) Graphics and mobile markets. In the market for graphics chips, customer inventory adjustments are “progressing well,” and demand should be stronger in the second half of this fiscal year (ending August) than it was in the first half.
This year, smartphone unit volume may be down slightly y/y, the company forecasts, and some customers continue to reduce their chip inventories. “In aggregate, we expect mobile customer inventory to improve through the remainder of calendar 2023, and we expect growth in mobile DRAM and NAND bit shipments in the second half of our fiscal year versus the first half,” Mehrotra said.
(4) Autos & industrial markets. Auto and industrial clients now represent more than 20% of Micron’s sales, reflecting just how “smart” cars and factories have become. In fiscal Q2, Micron’s auto revenue grew about 5% y/y, and demand is expected to remain strong.
Conversely, the industrial market continues to soften, as customers are reducing their inventory and demand has weakened. Again, the company expects demand to improve during the second half.
(5) Cuts just in case. Notwithstanding these expectations for market improvement ahead, the company had negative free cash flow of $1.8 billion in fiscal Q2 and took a $1.4 billion inventory write-down. It’s also is reducing headcount by almost 15% and cutting fiscal 2023 capital spending by more than 40% y/y to about $7 billion.
(6) Semis’ bounce continues. Semiconductor investors have anticipated the industry’s improvement for many months. The S&P 500 Semiconductors industry stock price index has jumped 55.8% from its 2022 low, as of Tuesday’s close (Fig. 5). The index remains 20.9% off of its November 29, 2021 peak.
As is often the case in this industry, investors jumped into semiconductor shares before seeing the industry’s results actually turn around. Revenue for the S&P 500 Semiconductors industry this year is expected to decline 10.1%, before increasing 14.3% in 2024 (Fig. 6). Likewise, the industry’s earnings are forecast to drop 21.2% this year before rebounding by 31.4% next year (Fig. 7). The optimism has pushed the Semiconductors industry’s forward P/E up to 23.5, a nice rebound from its 13.7 low of June 30, 2022 and not far from its 25.0 high of November 25, 2021 (Fig. 8).
Disruptive Technologies: Forever Young. Humans have always been obsessed by youth. The 1980s band Alphaville sang about wanting to be forever young. Spanish explorer Ponce de Leon supposedly was searching for a fountain of youth when he traveled to Florida. And cosmetic companies spend billions to create elixirs that diminish wrinkles. While a fountain of youth hasn’t been found, scientists have discovered a way to reverse some signs of aging.
Here’s a look at this exciting area of study:
(1) First, a biology lesson. When we are young, aging cells are automatically destroyed. As we age, this process is interrupted, and zombie cells—also known as senescent cells—stick around.
Scientists have shown that senescent cells cause the decline of a specific protein, a-Klotho, which appears to cause changes affiliated with aging. Specifically, a-Klotho appears to affect lifespan, health span, and renal and cognitive function in both mice and humans. Mice that have high a-Klotho levels live longer, have enhanced cognition, delayed age-related vascular dysfunction, decreased diabetes-related inflammation, and improved skeletal muscle regeneration.
There are no drugs that directly increase or replace a-Klotho. So scientists are using senolytic drugs to reduce senescent cells, which in turn increases levels of the a-Klotho protein; doing that appears to improve the functioning of many different types of cells.
(2) Testing on mice. Mayo Clinic researchers found that giving senolytic drugs to mice increased the amount of a-Klotho measured in their urine, kidneys, and brains, a March 12 report on the study in The Lancet explained.
In another study by Mayo Clinic researchers, an elderly mouse that aged naturally appeared shrunken and old, while another mouse from the same litter had received senolytic treatment and “had the pep of a cheerleader,” explained a February 28 article in National Geographic. The authors believe senolytic treatment could help the improve the functioning of cells in the heart and brain. It could reduce heart disease, treat type 2 diabetes, and reverse skin aging and osteoporosis.
(3) Testing on humans. Experiments on mice have been so successful that human trials have begun. In one trial, researchers at the University of Texas San Antonio, the Mayo Clinic, and Wake Frost School of Medicine used senolytics in patients suffering from idiopathic pulmonary fibrosis (IPF), a lung disease resulting from the scarring of lung tissue. “Patients who participated in the trial enhanced their six-minute timed walking distance by an average of 21.5 metres—no other drug or therapy has shown the same results as senolytics,” a December 19 Longevity.Technology article reported.
Unity Biotechnology, a company developing senolytic therapies, is currently focused on treating ophthalmologic and neurologic diseases. It recently concluded a Phase II study where patients with diabetic macular edema were treated for 24 weeks with a substance that eliminated senescent cells in the eye, a March 2 article in Genetic Engineering & Biotechnology News reported. At the start of the trial in June 2022, the patients had fluid in the eye and visual deficits. Six months later, a “very significant majority” of patients didn’t need a second injection and their vision improved by two eye-chart lines on average.
The company, which has its roots in the Mayo Clinic, has also had setbacks. Earlier this week, Unity’s share price was halved to $1.95 on news that its lead drug candidate UBX 1325—a senolytic therapy to treat wet age-related macular degeneration—failed to outperform Regeneron’s eye therapy aflibercept in a Phase 2 trial.
Churning Earnings
March 29 (Wednesday)
Check out the accompanying pdf and chart collection.
Executive Summary: The SVB debacle has depressed the S&P 500 Financials sector’s market-cap share further below its earnings share. And the S&P 500 Bank Composite hasn’t ever been this cheap relative to the S&P 500 (i.e., since the mid-1980s start of the data). We liked the Financials sector before SVB imploded and like it even more since, as the fallout we expect doesn’t include systemic contagion and does include more M&A activity. … Also: While analysts have been cutting their 2023 earnings estimates for S&P 500 companies, the index’s forward earnings increasingly reflects the higher 2024 estimates and has stopped falling. ... Also: Joe discusses some impacts of Standard & Poor’s sector and industry reclassifications.
Strategy I: Hanging in There with Financials. Joe and I liked the S&P 500 Financials sector before Silicon Valley Bank (SVB) hit the fan. We like it even more now that the stocks are cheaper as a result of the SVB debacle. That’s mostly because our economic outlook hasn’t changed. We don’t expect more bank runs, a credit crunch, and a recession. We believe that the rapid response by the Fed and the FDIC should avert any contagion. We do expect that banks will have to raise their deposit rates to avert disintermediation. That undoubtedly will squeeze the profit margins of many banks, especially the small community and regional banks. The result is likely to be lots of M&A activity aimed at cutting costs through consolidation. That would also benefit the S&P 500 Investment Banking & Brokerage industry.
Here are a few related developments to think about:
(1) Regional banks. Yesterday, Joe and I observed that industry analysts scrambled to cut their revenues and earnings estimates for the regional banks following the implosion of SVB on March 10. Investors responded accordingly, as the S&P 500 Regional Banks stock price index plunged 24.7% from March 9 through March 27 (Fig. 1). Industry analysts slashed their 2022 and 2023 earnings forecasts for the S&P 500 Regional Banks by 6.3% and 7.0% during the March 16 week. Investors lowered the industry’s forward P/E from 8.3 on March 9 to 6.6 on Monday (Fig. 2).
(2) Diversified banks. The carnage was less intense for the S&P 500 Diversified Banks stock price index. It fell 5.6% from March 9 through Monday’s close (Fig. 3). Analysts’ consensus earnings-per-share expectations for this industry actually rose 0.2% and 0.2% for 2023 and 2024 during the March 16 week. The industry’s P/E has fallen less than the Regional Banks’, from 9.1 to 8.5 (Fig. 4).
During the week ended March 15, deposits at large domestically chartered banks rose $67 billion. Deposits fell $120 billion at small domestically chartered banks and $45 billion at the US branches of foreign banks. The net outflow from all these banks was $98 billion during the March 15 week.
(3) Money market mutual funds. Benefitting from the deposit outflows were money market mutual funds (MMMF) that had net inflows of $238 billion over the two weeks through March 22 (Fig. 5). Over this period, institutional and retail MMMFs attracted $203 billion and $35 billion, respectively (Fig. 6).
(4) Financials. Industry analysts who cover companies in the S&P 500 Financials sector collectively reduced their earnings estimates for 2023 and 2024 by only 0.8% and 0.7% during the March 16 week (Fig. 7). From March 9 through March 27, the S&P 500 Financials stock price index fell 5.9% (Fig. 8). The sector’s forward P/E dropped from 11.9 to 11.3 (Fig. 9).
The S&P 500 Financials sector’s market-cap share (i.e., its share of the S&P 500’s total market capitalization) was down to a relatively low 10.5% on March 16 versus the sector’s earnings share of 16.1% (Fig. 10). The sector outperformed the S&P 500 during 2020’s stock market rally and since then was a market performer, until it dropped in response to the SVB debacle (Fig. 11). The S&P 500 Bank Composite hasn’t been this cheap relative to the S&P 500 since the start of the data in the mid-1980s (Fig. 12). S&P 500 Life & Health Insurance is also relatively cheap on this basis (Fig. 13).
Strategy II: Industry Analysts Awaiting Earnings Season. As the Q1 earnings reporting season in April and May approaches, industry analysts are still paring their estimates for the four quarters of 2023 (Fig. 14). They now expect to see a 7.4% y/y decline during Q1 followed by -5.8% in Q2, 2.1% in Q3, and 10.5% in Q4 (Fig. 15).
Nevertheless, S&P 500 earnings per share is still expected to be up 1.5% y/y for 2023 to $221.40 and 12.0% in 2024 to $248.03 (Fig. 16). As time passes, forward earnings—the time-weighted average of analysts’ consensus operating earnings-per-share expectations for 2023 and 2024—is giving more and more weight to the 2024 estimate. As a result, it has stopped falling over the past three weeks through the March 23 week. It is currently $227.55. At year-end, it will equal whatever the 2024 estimate will be at that time.
We believe that the upcoming earnings season will be especially important during the second and third weeks of April, when most of the big banks report their results. Their profits are likely to be depressed by increases in their provisions for loan losses. Given the recent banking crisis, even if bank managements aren’t that concerned about loan losses, they might still want to show the banking regulators that they are being prudent. Then again, the Fed’s weekly H.8 report on the assets and liabilities of commercial banks is still showing modest increases in their allowances for bad loans. They might prefer to downplay the impact of the banking crisis on their profitability to calm the nerves of their investors, or at least not to overdramatize it.
During the March 16 week, S&P 500 forward revenues rose to another record high (Fig. 17). The forward profit margin dropped to 12.3%, down from a record high of 13.4% during the June 9 week of 2022.
Accounting: S&P Changes GICS Classifications. On March 17, following the close of trading, Standard & Poor’s and MSCI changed their GICS sector and industry classification schema. Such changes typically impact S&P 500 sectors’ valuation, profit margin, and market-cap metrics. These were no different.
Two of the S&P 500’s three largest-market-cap sectors—Financials and Information Technology—saw major impacts: Financials’ size, valuation, and profit margin were boosted the most of any sector; those metrics mostly shrank for Information Technology. Also affected, albeit not by much, were the Consumer Discretionary, Consumer Staples, and Industrials sectors.
Here's a closer look:
(1) Impact on market-cap share. Financials’ market cap soared by 25.9% due to the creation of a new sub-industry, Transaction Processing & Payment Services, in the sector. Overnight, the sector’s market-cap weighting in the S&P 500 rose to 12.9% from 10.3%.
On the flip side, Information Technology’s market cap fell by 10.9%, primarily due to the removal of the Data Processing & Outsourced Services sub-industry. Information Technology is still the S&P 500’s largest sector even though the changes chopped its market-cap share to 25.9% from 29.0%.
Additionally, Consumer Staples’ and Industrials’ capitalizations rose by 6.5% and 4.7%, respectively, while Consumer Discretionary’s dropped 4.5%. But these three sectors’ combined market-cap shares rose by just 0.5ppt to 27.9%.
(2) Processing the biggest change. Information Technology’s Data Processing & Outsourced Services sub-industry was transferred to the Industrials sector, but with only one of its prior 11 constituent companies. Of the remaining 10 companies, two were added to Industrials’ Human Resource & Employment Services sub-industry and eight were moved to the newly created Transaction Processing & Payment Services industry housed in Financials—eight extremely profitable companies, by the way. Among the 11 firms moving out of Tech were two of the S&P 500’s top 16 companies by market cap, Visa and Mastercard.
A recent note by Refinitiv’s Tajinder Dhillon highlights how the GICS changes affect the profit margin and valuation metrics of Financials and Information Technology. Financials’ forward P/E rises from 11.7 to 12.7 with the addition of the Transaction Processing & Payment Services sub-industry, which trades at a forward P/E of 21.1. But Financials’ forward profit margin is most affected, rising, by Refinitiv’s calculation, to 18.9% from 17.8%. That means Financials remains the S&P 500’s second-most profitable sector. The changes take the forward margin of the most profitable sector, Information Technology, down to 21.8% from 22.6%. Its forward P/E rises, though, from 24.1 to 24.9.
(3) What’s in Financials’ wallet? The addition of Visa and Mastercard, the 10th and 16th biggest S&P 500 companies by market capitalization, account for 90% of the Financials sector’s market-cap increase. On a float-adjusted basis, Visa steals Financial’s top market-cap-share spot from Berkshire Hathaway, and Mastercard slides into the fourth spot behind JPMorgan Chase. According to Refinitiv, Visa and Mastercard have forward profit margins of 54.6% and 46.6%, well ahead of JPMorgan Chase’s 27.1%.
(4) What’s in a name? Most of the dozen-plus sub-industry name changes are minor and don’t involve changes to constituent companies. However, a few of the renamed sub-industries bear little resemblance to their forebears. In Industrials, for example, Trucking was renamed “Cargo Ground Transportation.” In Consumer Discretionary, Internet & Direct Marketing Retail (home to Amazon) became “Broadline Retail.”
Consumer Staples’ Hypermarkets & Super Centers industry is now “Consumer Staples Merchandise Retail.” The renamed sub-industry—which had contained only Costco and Walmart—now houses three transferees from Consumer Discretionary’s discontinued General Merchandise Store’s sub-industry: Dollar General, Dollar Tree, and Target.
(5) A little history. The impacts of this round of GICS changes pale in comparison to the upheavals of the 2016 and 2018 reshufflings.
In September 2016, Real Estate was carved out of Financials and elevated to sector status, which dropped Financials’ market-cap share of the S&P 500 from 16% to 13%. The September 2018 round shifted sector weightings even more substantially. The stodgy Telecommunications sector, with just a 2% market-cap share, was reinvented as “Communication Services” with new players moved from Tech and Consumer Discretionary (including the entire Media & Entertainment industry). Overnight, the sector’s market-cap share jettisoned back up to the 10% of its heyday a decade earlier.
‘Yes, There Will Be Growth in the Spring!’
March 28 (Tuesday)
Check out the accompanying pdf and chart collection.
Executive Summary: Stock market bears have long expected a recession, but now the prospective credit crunch that could cause one seems more plausible after the SVB crisis. … We expect that the Fed and FDIC will contain the crisis. But we do see regional banks paying higher deposit rates now to prevent disintermediation. That’s likely to hurt their profitability and prompt more cost-saving M&A activity among them. … Also: The latest batch of economic indicators supports a soft-landing scenario.
Banking I: Disintermediation 2.0? The bear case last year was that the Fed would have to tighten monetary policy aggressively because the Fed was behind the inflation curve and had to scramble to catch up. That would cause a recession, which is the only way to bring inflation down, according to the narrative. As a result, valuation multiples would tumble, and so would earnings.
That scenario played out well for the bears as the S&P 500 dropped 25.4% from January 3 through October 12 of last year. However, the bear market was mostly attributable to a 29.8% plunge in the S&P 500’s forward P/E (Fig. 1). Forward earnings actually rose 6.2% during the bear market because the recession didn’t happen as expected by the bears (Fig. 2).
Nevertheless, they are still growling. A recession is still coming, and it will depress both the valuation multiple and earnings, they claim. The forward P/E is up from 15.1 on October 12, 2022 to 17.5 last Friday, but it is likely to fall down to single digits in the bears’ scenario. They’re saying S&P 500 earnings could fall 15% to $185 per share this year, down from $218 last year.
The banking crisis that started when the FDIC seized Silicon Valley Bank (SVB) on March 10 will cause the credit crunch that causes a recession this year, the bears contend, and sooner rather than later. Money will pour out of bank deposits into safer Treasury securities that are yielding more than deposits. Banks will be forced to sell their underwater bonds. They’ll be forced to stop lending, resulting in a credit crunch. Credit crunches attributable to disintermediation have always caused recessions.
Banking II: Let’s Make a Deal. That’s all a very plausible litany of what has gone wrong and could continue to go wrong. What could go right is that the banking crisis is contained by the actions taken so far by the Fed and the FDIC. They undoubtedly will respond with more contagion-containing measures if necessary.
On Sunday, March 12, the Fed provided a new emergency liquidity facility for the banks. According to the Fed’s press release: The Bank Term Funding Program (BTFP) offers loans of up to one year in length to depository institutions pledging US Treasuries, agency debt and mortgage-backed securities, and other qualifying assets as collateral. These assets will be valued at par. “The BTFP will be an additional source of liquidity against high-quality securities, eliminating an institution's need to quickly sell those securities in times of stress.”
In effect, the Fed guaranteed 100% of deposits for 100% of depositors by providing the BTFP as a backstop to stop bank runs. So far, so good.
The FDIC started to do its job immediately after it seized SVB. The regulator transferred all SVB deposits and assets into a new “bridge bank” to protect depositors of the failed lender. On Monday morning, March 27, the FDIC announced that First Citizens BancShares will buy SVB’s deposits and loans, just over two weeks after the biggest US banking collapse since the global financial crisis. The FDIC estimated that SVB’s failure will cost its Deposit Insurance Fund (DIF) around $20 billion, with the exact amount to be determined once the receivership is terminated.
There could be more mergers and acquisitions among the regional banks. To avert disintermediation, they will have to raise their deposit rates, which will squeeze their profitability. That could force many of them to consolidate to lower their costs.
In any event, industry analysts who cover the S&P 500 Regional Banks industry responded quickly to the banking crisis. During the March 16 week, they cut their 2023 and 2024 revenues-per-share estimates by 7.0% and 7.6% (Fig. 3). They reduced their estimates for earnings per share those years by 6.3% and 7.0% (Fig. 4).
Investors slashed the S&P 500 Regional Banks stock price index by 25.8% from March 9 through March 24 (Fig. 5). That caused the forward P/E to plunge from just above 10.0 during February to a record low of 6.3 on March 15 (Fig. 6).
By the way, the FDIC’s Deposit Insurance Fund had a balance of $128.2 billion at the end of last year (Fig. 7).
US Economy: Not Landing. Meanwhile, the US economy is continuing to grow at a solid “no-landing” pace. The Atlanta Fed’s GDPNow tracking model shows real GDP increasing 3.2% (saar) during Q1-2023 as of March 24. Most impressive is that real personal consumption expenditures is tracking at a 5.0% annual rate! It was last revised higher on March 15 after the release of retail sales, which dipped 0.4% during February, though January’s gain was revised up from 3.0% to 3.2%, the biggest monthly gain since March 2021.
Let’s review the latest batch of economic indicators that on balance supports the soft-landing scenario:
(1) Surprise index. The Citigroup economic surprise index (CESI) rose from a recent low of -24.7 on January 18 to 61.2 on Friday, the highest reading since April 27, 2022 (Fig. 8).
(2) Flash PMIs. The S&P Global flash estimate for the M-PMI in the US rose from a recent low of 46.2 during December to 49.3 in March (Fig. 9). The flash estimate for the NM-PMI rose from 44.7 to 53.8 over the same period (Fig. 10).
(3) Housing. New home sales rose in February, climbing for the third month in a row as mortgage rates eased off their highs of the past year and buyers looked to new construction amid historically low inventory of existing homes for sale. Sales of new single‐family houses were 640,000 (saar), up from a revised 633,000 in January (Fig. 11).
Existing home sales jumped 14.5% m/m during February to 4.58 million units (saar) (Fig. 12). It was the first monthly gain in 13 months and the largest increase since July 2020, just after the start of the Covid-19 pandemic. Sales might have been even higher were it not for what are still very low inventories of existing homes.
The monthly sum of single-family existing and new home sales closely tracks the four-week average of mortgage applications for purchasing homes, which is sensitive to mortgage rates (Fig. 13). Mortgage rates probably peaked along with the 10-year Treasury bond yield at the end of October (Fig. 14). If so, then housing activity may be starting to bottom.
(4) Durable goods orders. Nondefense durable goods orders excluding aircraft has been essentially flat for the past six months through February (Fig. 15). That’s the bad news. The good news is that it has stalled in record-high territory. Data available through January show that new orders for industrial machinery has also stalled at a record high in recent months, while new orders for construction machinery remain on an uptrend that started after the pandemic lockdowns (Fig. 16).
(5) Regional business surveys. Four of the five regional bank surveys conducted by the Federal Reserve’s district banks are available through March (Fig. 17). Unlike the S&P Global flash estimate, the average of their composite business indicators remained weak in March, which suggests that the national M-PMI might have fallen further below 50.0 in March.
(6) Bottom line. In the 1979 film “Being There,” Peter Sellers plays Chauncey Gardner, who is a middle-aged, simple-minded man named “Chance.” He lives in the townhouse of a wealthy old man in Washington, D.C. Chance has spent his entire life tending the garden and has never left the property. Other than gardening, his knowledge is based solely on what he sees on television. He is forced to wander outside the property when his benefactor passes away. Through various twists of fate, Chance the gardener becomes “Chauncey Gardiner” and is embraced by the upper echelons of society, business, and government. When asked by the president of the United States about the economic outlook, he says, “Yes, there will be growth in the spring!” That’s our forecast too.
‘Is It Safe?’
March 27 (Monday)
Check out the accompanying pdf and chart collection.
Executive Summary: The recent banking crisis has heightened fears of a recession. But still the S&P 500 is up ytd—buoyed greatly by the MegaCap-8 stocks. … The SVB debacle hasn’t changed our economic outlook, which pegs the odds of a recession at a relatively high 40%, as we’re not convinced it will lead to a credit crunch that triggers a recession. … We’ll know if the banking system isn’t as resilient as we think if we see deterioration in the Fed’s weekly H.8 data, showing the assets and liabilities of commercial banks. … So far, we think that the SVB crisis will be contained thanks to the Fed’s emergency liquidity facility. ... Dr. Ed reviews “Boston Strangler” (+).
YRI Weekly Webcast. Join Dr. Ed’s live webcast with Q&A on Mondays at 11 a.m. EST. You will receive an email with the link one hour before showtime. Replays of the weekly webcasts are available here.
Strategy: Market Dynamics. Rather remarkably, the S&P 500 is still up for the year to date, by 3.4%, notwithstanding the freefall in the S&P 500 Financials caused by the banking crisis (Fig. 1). It’s just above its 200-day moving average and just below its 50-day moving average. Eight of the 11 S&P 500 sectors are down ytd, led by an 11.1% drop in Energy and a 9.4% decline in Financials, while only three are up ytd, namely Communication Services (18.4%), Information Technology (17.5), and Consumer Discretionary (9.6) (Fig. 2 and Table 1).
The three outperforming sectors are doing well because they include the MegaCap-8 stocks, which as a group are up 26.5% ytd based on their collective market cap (Fig. 3). Excluding them, the market cap of the S&P 500 is up less than 0.1% ytd. Falling interest rates and aggressive cost cutting by the MegaCap-8 companies are boosting their forward P/E (Fig. 4). Some of them are also getting a boost from lots of hype about artificial intelligence.
The MegaCap-8 is also boosting the Nasdaq, which is up 13.0% ytd and 15.8% from its 2022 low on December 28. While the S&P 500 LargeCaps stock price index is up 3.4% ytd, the S&P 400 MidCaps index and the S&P 600 SmallCaps index are down 1.1% and 1.5%. They tend to be more sensitive to fears of a recession, which have been mounting recently.
US Economy: Getting Riskier? A few of our readers asked us why we didn’t raise the odds of a recession in response to the banking crisis. We thought about it. But we’re comfortable with our relatively high 40% subjective probability of a recession, leaving 60% for a soft landing. The former reflects the fact that the Fed has been tightening since early last year and leaves plenty of room for something to break in the financial system as long as that something doesn’t cause a credit crunch and a recession.
Now that something has broken, we aren’t convinced that it will cause a credit crunch and a recession, which leaves us at 40% for a hard landing and 60% for a soft landing. Only a few weeks ago, the consensus had flipped from hard landing to no landing. Now it seems to be flipping back to hard landing. We are staying put with our landing scenarios odds, for now.
Banks I: Are the Safes Safe? “Is it safe?” is the famous question asked by Dr. Christian Szell, played by Laurence Olivier, in the film “Marathon Man,” directed by John Schlesinger (1976). “Marathon Man” is the film that made everyone scared of going to the dentist, especially if said dentist was a secret Nazi war criminal. The patient being interrogated is Babe, a graduate student and avid runner played by Dustin Hoffman, who becomes involved in his older brother’s secret-agent conspiracy. He has a cavity that Szell pokes to torture the answer out of him.
To answer the question “Are the safes safe?” amid the current banking crisis, we all have a new job at 4:00 p.m. on Friday afternoons. That’s when the Fed’s H.8 release comes out showing the latest weekly data on the selected assets and liabilities of commercial banks in the US. The weekly levels are Wednesday values. The data for domestically chartered commercial banks and US branches and agencies of foreign banks are estimated by benchmarking weekly data provided by a sample of banks to quarter-end reports of condition (Call Reports).
Large domestically chartered commercial banks are defined as the top 25 domestically chartered commercial banks, ranked by domestic assets as of the previous commercial bank Call Report, to which the H.8 release data have been benchmarked. Small domestically chartered commercial banks are defined as all domestically chartered commercial banks not included in the top 25.
Banks II: Down and Out in the Valley. The Silicon Valley Bank (SVB) meltdown occurred on March 9 and 10. The latest H.8 release covers through the week ending Wednesday, March 15. SVB was closed on March 10 by the California Department of Financial Protection and Innovation, which appointed the Federal Deposit Insurance Corporation (FDIC) as receiver.
That same day, the FDIC issued a press release stating: “To protect insured depositors, the FDIC created the Deposit Insurance National Bank of Santa Clara (DINB). At the time of closing, the FDIC as receiver immediately transferred to the DINB all insured deposits of Silicon Valley Bank.
“All insured depositors will have full access to their insured deposits no later than Monday morning, March 13, 2023. The FDIC will pay uninsured depositors an advance dividend within the next week. Uninsured depositors will receive a receivership certificate for the remaining amount of their uninsured funds. As the FDIC sells the assets of Silicon Valley Bank, future dividend payments may be made to uninsured depositors.”
On Sunday, March 12, the Fed issued a press release implying that all depositors (not just insured ones) would be protected: “To support American businesses and households, the Federal Reserve Board on Sunday announced it will make available additional funding to eligible depository institutions to help assure banks have the ability to meet the needs of all their depositors. This action will bolster the capacity of the banking system to safeguard deposits and ensure the ongoing provision of money and credit to the economy.”
The Fed doesn’t have the authority to insure all deposits that are not insured by the FDIC (up to a maximum of $250,000 per account). So the Fed in effect guaranteed all deposits “through the creation of a new Bank Term Funding Program (BTFP), offering loans of up to one year in length to banks, savings associations, credit unions, and other eligible depository institutions pledging U.S. Treasuries, agency debt and mortgage-backed securities, and other qualifying assets as collateral. These assets will be valued at par. The BTFP will be an additional source of liquidity against high-quality securities, eliminating an institution's need to quickly sell those securities in times of stress.”
The FDIC press release noted: “As of December 31, 2022, Silicon Valley Bank had approximately $209.0 billion in total assets and about $175.4 billion in total deposits. At the time of closing, the amount of deposits in excess of the insurance limits was undetermined. The amount of uninsured deposits will be determined once the FDIC obtains additional information from the bank and customers.”
Banks III: Bank Book. To monitor the current banking crisis on a weekly basis, Mali and I compiled lots of charts based on the H.8 data into YRI’s US Commercial Bank Book. Here is what we see in the latest data:
(1) Deposits vs MMMFs. During the March 15 week, deposits at all banks fell $98 billion, with a decline of $120 billion at small domestically chartered banks and a gain of $67 billion at large domestically chartered banks (Fig. 5). Foreign banks in the US had deposit outflows of $45 billion. Some of these outflows may have gone to money market mutual funds (MMMFs), which had net inflows of $238 billion over the past two weeks through March 22, with $203 billion inflows into institutional MMMFs and $35 billion into retail MMMFs (Fig. 6).
(2) Borrowing. Commercial banks borrowed a whopping $475 billion during the March 15 week (Fig. 7). Borrowing jumped by $251 billion and $252 billion at large and small banks. Foreign banks in the US borrowed $28 billion less during the March 15 week.
(3) Securities. The Fed’s data include “all securities, whether held-to-maturity reported at amortized cost; available-for-sale reported at fair value; held as trading assets, also reported at fair value; or equity securities with readily determinable fair values not held for trading. Excluded are all non-security trading assets, such as derivatives with a positive fair value or loans held in trading accounts.”
This balance sheet item fell $10 billion during the March 15 week (Fig. 8).
(4) Loans. Loans and leases held by all banks edged up $63 billion during the March 15 week to a new record high, with large banks up $29 billion and small banks up $22 billion (Fig. 9). Loans at foreign banks in the US increased $12 billion that week. The following loans were on uptrends at record highs (excluding the pandemic spike in C&I loans): commercial real estate ($2.9 trillion), commercial & industrial ($2.8 trillion), residential real estate ($2.5 trillion), and consumer loans ($1.9 trillion) (Fig. 10).
Here are the March 15 values (in trillions of dollars) of the following loan categories at large and small domestically chartered banks: commercial & industrial (1.5, 0.8), commercial real estate (0.8, 2.0), consumer (1.4, 0.4), and residential real estate (1.6, 1.0) (Fig. 11 and Fig. 12). Here are small banks’ current shares of these loans: commercial real estate (67.4%), residential real estate (38.0%), commercial & industrial (27.9%), consumer loans (23.7%) (Fig. 13).
(5) Allowances for losses. Provisions for loan losses edged down during the March 15 week notwithstanding the SVB debacle (Fig. 14).
(6) Bottom line. We expect that the current banking crisis will be contained because of the Fed’s commitment to indirectly guarantee all deposits by providing banks with access to the new emergency liquidity facility. We will be tracking the weekly H.8 data to assess the situation.
Dustin Hoffman’s character, not knowing the right answer, said, “Yes, it’s safe. It’s very safe, you wouldn’t believe it.” However, as his dental torture was about to begin, his reply changed: “No, it’s not safe. It’s very dangerous. Be careful.” Hopefully, those of us who don’t anticipate much pain from the banking crisis won’t soon be changing our tune.
Movie. “Boston Strangler” (+) (link) is yet another serial killer movie, reminding us that there are too many psychos out there. In recent years, many psychos have opted for mass shootings. While there is a big debate about banning assault weapons, it’s clear that our society isn’t spending enough on taking care of the mentally ill among us. The movie is a docudrama about the two female reporters at a Boston tabloid who pursued the leads more diligently than did the police despite the dangers of doing so and the negative impact on their personal lives. One of them says, “Our job is to report the news, not to make it.” Too bad so many journalists have lost sight of that approach to their jobs.
Communication Services & AI
March 23 (Thursday)
Check out the accompanying pdf and chart collection.
Executive Summary: The S&P 500’s Communication Services sector has outperformed all ten of its counterparts so far this year, up 18% ytd. Jackie examines the constituent industries and companies that have been driving the sector’s strong showing, with a particular focus on Meta, up 68% ytd. … Also: Companies in diverse industries are harnessing the power of AI in manifold ways to help people work faster, smarter, and even more deceptively (beware of AI fakes!). This week’s disruptive technologies segment highlights some of the players in the AI space and the innovative products they’re turning out.
Communication Services: Tip of the Hat to Meta. While the S&P 500 Information Technology sector’s outperformance has been impressive during the recent weeks of market upheaval, its ytd gains are outpaced by the S&P 500 Communication Services sector’s. This top performing sector has produced a ytd gain of 17.9%, 1.5ppts better than the S&P 500 Information Technology sector’s. Were it not for these two tech-heavy sectors, the S&P 500 would be in negative territory ytd instead of up 4.3% through Tuesday’s close.
Here’s the performance derby for the S&P 500 and its 11 sectors ytd through Tuesday’s close: Communication Services (17.9%), Information Technology (16.4), Consumer Discretionary (12.6), S&P 500 (4.3), Industrials (0.5), Materials (0.0), Real Estate (-2.2), Consumer Staples (-2.5), Health Care (-6.0), Financials (-6.6), Utilities (-6.9), and Energy (-8.1) (Fig. 1).
The S&P 500 Communication Services sector has continued to lead the market in March, rising 8.3% mtd and nosing out the Information Technology sector’s 6.2% mtd gain. Here’s the performance derby for the S&P 500 and its sectors for the month of March through Tuesday’s close: Communication Services (8.3%), Information Technology (6.2), Utilities (1.5), Consumer Staples (1.1), S&P 500 (0.8), Health Care (0.7), Consumer Discretionary (0.2), Industrials (-1.9), Energy (-3.2), Materials (-4.9), Real Estate (-5.2), and Financials (-10.2) (Fig. 2).
Let’s take a deeper dive into Communication Services’ worlds of advertising and social networking:
(1) Thank Alphabet, Meta & Paramount. Within the S&P 500 Communication Services sector are many market-outperforming constituent industries with ytd gains that dwarf the S&P 500’s 4.3%.
Leading the pack with a 29.2% ytd gain is the S&P 500 Interactive Media Services industry—home to Meta Platforms (up 68.0% ytd) and Alphabet (up 19.3% ytd). Meta is having a banner year thanks to its new focus on cost cutting, its artificial intelligence (AI) initiatives, and the potential for its Reels platform to gain users if TikTok is banned in the US.
Not far behind is the S&P 500 Broadcasting industry, up 16.6% ytd, led by Paramount Global (CBS and Paramount Pictures), which has risen 25.9% ytd.
Here’s how all of the industries in the S&P 500 Communication Services sector are performing ytd through Tuesday’s close: Interactive Media Services (29.2%), Broadcasting (16.6), Movies & Entertainment (10.9), Advertising (8.5), Wireless Telecommunication Services (3.3), Interactive Home Entertainment (2.6), Integrated Telecommunication Services (-2.0), and Publishing (-11.1) (Fig. 3 and Fig. 4).
Many of these industries were hurt in 2022 on expectations that a sharp slowing of advertising spending at year-end would continue into 2023. Global advertising spending is expected to rise 3.8% this year, far below 2022’s 8.0% growth rate and 2021’s 19.6% surge, according to a December 14 report by Dentsu International. Here is how advertising spending is expected to perform this year compared to last year in various channels: Digital (7.2% in 2023, 13.7% in 2022), Cinema (6.1, 24.7), Out-of-Home (2.0, 9.9), Radio (2.0, 3.6), Television (0.2, 1.7), and Print (-3.6, -5.3).
But late last year, with much of the bad news priced into the stocks, investors began to look past the valley to 2024, when global advertising growth is forecast to grow 4.8%. More recently, ad-generated revenue in many companies hasn’t been as bad as feared. There’s also some excitement about Meta and other players using AI to improve the ads served to viewers on their apps. The technology helped Meta’s Q4 conversions rise more than 20%. AI “is the foundation of our discovery engine and our ads business,” Meta CEO Mark Zuckerburg said during the company’s Q4 earnings conference call on February 1.
The S&P 500 Advertising industry’s stock price index has risen 8.5% ytd, almost twice the S&P 500’s gain over the same period (Fig. 5). After slowing to 1.1% growth in 2022, the industry’s revenue growth is expected to climb 4.0% this year and 4.6% in 2024 (Fig. 6). Earnings growth is more subdued, in the 5.3%-5.6% range from 2022 through 2024 (Fig. 7).
(2) Meta course corrects. Meta’s shares have enjoyed quite a rebound from last year’s 64.2% drop, reflecting concerns that the company was overspending at a time when its revenue growth had stalled. Meta’s revenue declined in three of last year’s four quarters, an abrupt reversal from the growth the company had enjoyed for years. Q4 revenue fell 4%, and Meta projects Q1 revenue of $26.0 billion to $28.5 billion, flattish compared with Q1-2022 revenue of $27.9 billion. Meanwhile, Meta’s spending surged last year—up 23% y/y—as the company has been pouring money into developing the metaverse and AI.
CEO Zuckerburg began to rein in his spending ways late last year. He has announced two rounds of layoffs that will eliminate 21,000 jobs, or almost a quarter of the 87,314 people the company employed on September 30. In addition, 5,000 open jobs will go unstaffed, low-priority projects are being canceled, and costs throughout the organization are being slashed. The company expects 2023 expenses of $89 billion to $95 billion, below its previous forecast of $94 billion to $100 billion. Capital expenditures also are expected to be lower this year: $30 billion to $33 billion, down from management’s previous guidance of $34 billion to $37 billion. Analysts have sharply increased their 2023 earnings estimates, to $9.94 a share from $8.22 a share just three months ago.
(3) The TikTok opportunity. Congress is debating whether the US arm of TikTok should be allowed to continue its unfettered access to US citizens given its Chinese ownership and fear that the Chinese government could use the app to collect information on US users. The company said it has a risk mitigation plan to safeguard US users’ data, and its managers plan to testify before Congress today.
The US Committee on Foreign Investment in the US has told TikTok’s parent, ByteDance, to sell its shares in the app or the app could face a US ban, a March 15 WSJ article reported. If Congress prohibited or limited TikTok’s access to US customers, it could be a windfall for US social media competitors like Twitter and Meta’s Reels, a service similar to TikTok. TikTok has more than 150 million monthly active users in the US who could be up for grabs.
(4) Above-market growth. Analysts expect the S&P 500 Interactive Media industry to produce earnings growth that beats the S&P 500’s expected 0.3% earnings growth this year and 12.0% in 2024. The industry’s revenue is expected to increase 5.1% this year and 11.7% in 2024 (Fig. 8). Earnings are also expected to be higher by a respectable 12.7% this year and 20.7% in 2024 (Fig. 9). After more than a year in negative territory, net earnings revisions turned positive in March (Fig. 10). And while the industry’s forward P/E has rebounded to 18.3 from its low of 15.5 in early November, it’s far from its 32.3 peak in September 2020 (Fig. 11).
Disruptive Technologies: AI Everything. The announcements have come fast and furiously. Anyone who has anything to do with AI is broadcasting it to the world loudly. Chip manufacturers, software providers, social media companies, and the average Joe all are talking about how they’re harnessing the power of AI to work faster and smarter. This week’s news has been dominated by Nvidia’s impressive AI offerings unveiled at its software developer conference and Google’s rollout of Bard. Dare we suggest that it feels like the beginning of what will become the next big bubble?
This week has also brought the latest AI fake: A picture of former president Donald Trump resisting police arrest, an event that has not occurred but seems plausible given that a grand jury is considering whether to indict Trump over alleged hush-money payments to Stormy Daniels during the 2016 presidential campaign.
The fake picture was generated by Elliott Higgins, founder of Bellingcat, an independent international collective of researchers, investigators, and citizen journalists, a March 21 ARS Technica article reported. He used AI engine Midjourney V5 to generate the image he initially posted on Twitter. Even though Twitter prohibits users from sharing share synthetic or manipulated media, the picture has gone viral.
Here are some of the latest developments in the expanding world of AI:
(1) Nvidia wows the crowds. In the AI space, Nvidia has been investors’ darling; they’ve bid its shares up a steep 79.3% ytd through Tuesday’s close. The tech company held a software developer conference this week highlighting chips with various AI capabilities and revealing its DGX cloud service. Through DGX, companies will rent space on supercomputers that use Nvidia chips to develop AI technologies for the price of $37,000 a month, a March 21 Reuters article reported. The company is working with cloud providers Oracle, Microsoft, and Alphabet.
Nvidia also introduced three new services that companies can use to develop their own AI applications trained on their own data. NeMo generates language, Picasso can produce images and videos, and BioNeMo allows players in the life-science industry to “generate scientific texts using biological data,” a March 21 Venture Beat article explained.
(2) Google’s Bard now available. Google opened public access in the US and UK to Bard, its ChatGPT alternative. “Bard is designed to respond to written prompts using information sourced from websites such as Wikipedia and can handle follow-up questions in a conversational manner,” a March 21 WSJ article reported. Google still considers Bard an “early experiment” and posts the following disconcerting message at the bottom of its site: “Bard may display inaccurate or offensive information that doesn’t represent Google’s views.”
Meanwhile, OpenAI rolled out a new and improved version of ChatGPT, GPT-4, which will be used in Microsoft’s search engine, Bing. And not to be left behind is China’s search engine company Baidu, which introduced its chatbot Ernie earlier this month; but the lack of a live demonstration disappointed some observers.
(3) Software gets an AI facelift. Software companies are racing to infuse their existing software products with new AI capabilities. Microsoft is using ChatGPT throughout its enterprise software products—Word, Excel, and Windows—as well as its Bing search engine.
Business Chat is a new feature that can access information across Microsoft’s office products. For example, an employee could ask Business Chat for a customer update, and a response will be generated using information found in emails, meeting notes, and other documents, a March 16 NYT article explained. Copilot is a service that can write as guided in a Word document.
Google also plans to update Gmail and Google Docs with AI, allowing them to draft emails and other documents from simple written prompts. Google also introduced the Generative AI App Builder, so software developers can create their own chatbots for business and governments, just as developers created apps for the iPhone.
Adobe and Salesforce have introduced AI tools into their software products. Roblox envisions AI automating the basic coding tasks involved with creating a video game so that the programmer can focus on creative work. And C3AI was created to offer AI applications to companies.
(4) Consumers and companies get converted. Consumers are taking to ChatGPT like a fish takes to water. Who wouldn’t want a way to save time and look smart (assuming that ChatGPT’s answers are correct)? Software engineers appear to be big fans of AI, which helps them write code. Lawyers are using it to summarize case law, and workers are using it to rewrite drafts to sound more informative or concise, a March 22 WSJ article reported. Conversely, companies are scrambling to ensure that employees don’t reveal any trade secrets or produce material with incorrect information.
Investment bankers and investors might want to give AI a chance, too. PitchBook has launched VC Exit Predictor, a program that uses PitchBook data about the venture capital industry to forecast a startup’s growth prospects, a March 20 TechCrunch article reported. “It generates a score on the probability that it’ll be acquired, go public or not exit due to becoming self-sustaining or experiencing any event (e.g. bankruptcy) that prevents an exit,” the article explained. Developed using a machine learning algorithm, the program was 75% accurate when tested using historical data.
More than 75% of venture capital and early-stage investor executive reviews will use AI and data analytics by 2025, according to research firm Gartner. Venture capital firms SignalFire, EQT Ventures, and Nauta Capital already are using AI to flag potential winning investments. There are concerns that programs based on historical data may be disadvantageous to companies led by women or minorities.
Looking Ahead To Earnings Season
March 22 (Wednesday)
Check out the accompanying pdf and chart collection.
Executive Summary: Industry analysts and company managements have an optimism bias that blinds them to encroaching recessions. So when a recession looms, forward earnings’ reliability as an indicator of actual earnings to come falters. … While analysts have been cutting their 2023 and 2024 earnings estimates for S&P 500 companies since last summer, their expectations for next year are still higher than for this year. As long as that remains the case, forward earnings, which have been declining since last summer, soon should stop falling and start moving higher unless a recession happens. … And: S&P 500 earnings growth ex Energy sector could turn positive in Q2 as Energy de-energizes.
Strategy I: Looking Ahead vs Looking Forward. Joe and I were going to title this Morning Briefing “Looking Forward To Earnings Season.” But that would imply that we are expecting lots of positive surprises. In our lexicon, the word “forward” often refers to our focus on analysts’ consensus expectations for S&P 500 operating earnings per share over the next 12 months (or 52 weeks), calculated as the time-weighted average of their latest earnings forecasts for the current and coming years. More often than not, forward earnings suggests an upbeat story since it is driven by the upward trend in economic activity (Fig. 1 and Fig. 2).
Indeed, forward earnings tends to be a good leading indicator of actual earnings when the economy is expanding (Fig. 3 and Fig. 4). However, industry analysts collectively never see recessions coming; then when a recession arrives, they must scramble to lower their earnings estimates. That’s because they have an optimistic bias about the companies they follow. In addition, their expectations are heavily influenced by the guidance they receive from company managements, who also tend to have a positive bias.
The inherent optimism of industry analysts can be seen in our Earnings Squiggles, which track their annual earnings expectations on a monthly and weekly basis (Fig. 5 and Fig. 6). More often than not, analysts tend to be too optimistic during economic expansions; then their forecasts have to be lowered as the actual results come into view. Nevertheless, in this case, S&P 500 forward earnings may continue to rise as long as analysts’ consensus estimate for the coming year continues to exceed the one for the current year.
Strategy II: Pre-Season’s Greetings. Industry analysts have been lowering their earnings estimates for 2023 and 2024 since mid-2022. Their estimate for 2024 has exceeded their estimate for 2023 even as both were declining (Fig. 7). Forward earnings peaked at a record-high $239.93 last year during the week of June 23. It has been falling since then but stabilized recently at $227.30 during the March 16 week. The latest estimates for 2023 and 2024 are $221.63 and $248.43. There’s plenty of room for forward earnings to converge with a higher 2024 estimate by year-end, even if that estimate is shaved some more, as long as forward earnings doesn’t take a recession-induced dive. Here’s more:
(1) Q1-2023. The analysts’ consensus expectations for Q1-2023 was $50.84 during the March 16 week (Fig. 8). That’s down 7.3% y/y (Fig. 9). It’s also down 5.9% since the start of this year, mostly because managements guided down their expectations for Q1-2023.
Q2’s earnings are currently expected to be down 5.8% y/y, then up 2.2% in Q3 and 10.4% in Q4 based on I/B/E/S data by Refinitiv through the March 16 week.
(2) NERI. The analysts’ net earnings revisions index (NERI) for the S&P 500 has been in negative territory since July of last year through March of this year (Fig. 10). Negative readings tend to occur during recessions. They also occur during mid-cycle slowdowns like those in the mid-1990s and from 2014-16.
The NERI for the S&P 500 Financials sector has also been negative since July last year. As a result of the banking crisis, it is likely to go deeper into negative territory for the next few months (Fig. 11).
The recent drop in oil and gas prices is also likely to weigh on the results of S&P 500 Energy. The sector’s NERI turned negative during December (Fig. 12). It is likely to remain negative in coming months if the prices of oil and natural gas remain depressed.
(3) Financials. The results and guidance of the S&P 1500 Financials sector are likely to be depressed by increasing provisions for loan losses. The banks will want to show their regulators that they have enough set aside in reserves to cover losses if the banking crisis worsens. Melissa and I have been monitoring the weekly data on such allowances (Fig. 13). It’s been rising slowly since late 2022 through the latest data for the March 8 week, just before SVB hit the fan. We expect it will jump in coming weeks.
(4) Profit margins. While S&P 500 forward earnings has been falling since last summer, forward revenues has been rising to new record highs through the March 16 week (Fig. 14). Both are excellent weekly indicators of their comparable quarterly series for actual revenues and earnings (Fig. 15). They imply that the S&P 500’s forward profit margin might have continued to narrow during Q1-2023. It peaked at a record 13.4% during the week of June 9, 2022, falling to 12.3% during the March 16 week. Labor costs have been squeezing margins, causing some companies to pare their payrolls.
(5) Sectors. I asked Joe to calculate the latest (as of March 21) analysts’ consensus expectations for the y/y growth rates of Q1-2023 revenues and earnings for the S&P 500 and its 11 sectors (Table 1). Here are the results: S&P 500 (1.6%, -4.6%), Communication Services (-2.5, -13.5), Consumer Discretionary (5.9, 29.2), Consumer Staples (3.4, -4.1), Energy (-4.7, 15.9), Financials (9.4, 5.9), Health Care (1.0, -18.7), Industrials (5.6, 42.3), Information Technology (-3.5, -11.1), Materials (-8.5, -33.7), Real Estate (4.7, -8.0), and Utilities (1.9, -9.1).
Strategy III: De-Energizing Earnings. The Covid-19 pandemic and its resulting economic shutdown caused profits to quickly reverse to losses beginning in 2020 for a few select S&P 500 industries such as Hotels and Casinos. But the entire S&P 500 Energy sector was hit by the closure. The sector suffered heavy losses during Q2-2020 due to the shutdown and during H2-2020 due to the slow reopening of the economy. The cratering of oil demand forced energy companies that were unable to shut off their drilling and pipeline taps to store crude in anchored tankers, repurposed as floating oil-storage facilities.
Following the reopening of the global economy, the slimmed-down and more-productive S&P 500 Energy sector benefitted from oil prices that were higher than before the pandemic. Their results contributed to the S&P 500’s y/y revenue and earnings growth in a big way from Q2-2021 to Q4-2022.
Now this seven-quarter tailwind that had been boosting the S&P 500’s y/y revenue and earnings growth rates is about to become a headwind. The Energy sector’s positive contribution to the S&P 500’s revenue growth is expected to end in Q1-2023, and the sector should be a drag on the index’s revenue growth for the rest of the year (Table 2). On the earnings front, Energy’s positive contribution to the S&P 500’s y/y earnings growth is expected to linger for another quarter before the sector’s impact turns negative beginning in Q2-2023.
The overall S&P 500’s y/y earnings growth rate had turned negative in Q4-2022 for the first time in two years but had already been negative on an ex-Energy basis for two quarters beginning in Q2-2022. Based on analysts’ current forecasts, the S&P 500’s ex-Energy earnings growth rate is expected to be negative again for a fourth straight quarter in Q1-2023, before turning slightly positive in Q2.
Analysts’ estimate revisions for the Energy sector have turned decidedly negative in recent months. In the March data released on Tuesday, Energy’s NRRI (Net Revenues Revision Index) was negative for a third straight month, and its NERI (Net Earnings Revisions Index) was negative for a fourth month. Both readings deteriorated sharply m/m to 33-month lows, and Energy’s NRRI and NERI were the lowest of all 11 S&P 500 sectors’ readings. (See our “Stock Market Indicators: Net Revenue & Earnings Revisions By Sectors.”)
As for the broad S&P 500 index, its NERI reading of -7.3% in March was steady m/m and up from December’s 30-month low of -15.6%.
The recent drop in energy prices suggests more downward-revision pain ahead for the S&P 500 Energy sector. But this bad news for Energy is good news for other sectors, particularly their profit margins. Sectors and industries that were hammered by high fuel and transportation costs after the pandemic ended will benefit from lower energy prices.
The S&P 500’s forward profit margin peaked at a record-high 13.4% during the June 9, 2022 week, when Energy’s was at a then-record-high 11.8% (Fig. 16). Energy’s forward profit margin continued rising for another six months before peaking at a record-high 12.8% during the November 24, 2022 week, when it briefly exceeded the S&P 500’s forward profit margin for three weeks and for the first time since March 2009.
Both since have fallen from record highs during 2022 to new post-pandemic lows through the March 16 week. The S&P 500’s forward profit margin is now down 1.1ppts to 12.3%, and Energy’s has slipped 1.0ppt to 11.8%. Energy’s forward profit margin is now below the S&P 500’s again, where it has lingered for much of the past 20 years.
Giving Credit Where Credit Is Due
March 21 (Tuesday)
Check out the accompanying pdf and chart collection.
Executive Summary: The spread between the 10-year Treasury bond yield and the federal funds rate inverted in November; such inversions are predictive of credit crunches and recessions. They also tend to predict financial crises that halt Fed tightening. It’s too early to credit the yield-curve inversion for calling a recession, but it was spot on in presaging a crisis like SVB. … Small banks seem vulnerable now to depositor flight, which could prompt a credit crunch impacting small businesses. … But we don’t think a credit crunch would hurt consumer spending and homebuying as much as lower interest rates will boost them. … Our message to the FOMC: Give it a rest.
Weekly Webcast. If you missed Monday’s live webcast, you can view a replay here.
Credit I: Yield Curve Nails It, So Far. It is time to give credit where credit is due. The yield curve is on a roll so far. Consider the following:
(1) Calling another recession. The spread between the 10-year Treasury bond yield and the federal funds rate is available since 1954 monthly (Fig. 1). It is one of the 10 components of the Index of Leading Economic Indicators (LEI). Like the overall LEI, the yield curve has a good track record of calling recessions when it inverts. There have been 10 recessions since 1954.
The yield-curve spread did not invert prior to the first two recessions since 1954, though it did narrow significantly prior to those downturns. The first inversion of the yield curve occurred in the mid-1960s, but that coincided with a brief bout of disintermediation and an economic slowdown rather than a recession. There were also economic slowdowns in the mid-1980s and mid-1990s when the yield-curve spread narrowed significantly but stopped short of inverting. We’ve characterized those events as rolling recessions, mid-cycle slowdowns, growth recessions, and soft landings. (There was a mid-cycle slowdown during 2014 to 2016, but the yield spread remained relatively wide.)
The yield curve did invert before the past eight recessions. It did so by 14 months on average before the start of the subsequent recessions. Those were all great calls. This time, it inverted during mid-November 2022. A recession has yet to start, but the latest banking crisis could be what triggers one, just as the yield curve predicted.
We prefer the yield spread between the 10-year and 2-year Treasury notes because it reflects the market’s perception of where the LEI version of the spread is going (Fig. 2). It first inverted last year during the week of July 8. It is available both daily and weekly since mid-1976.
In fact, it is premature to give full credit to the yield curve now since a recession hasn’t started yet. While the LEI has been falling steadily since peaking at a record high at the end of 2021, the Index of Coincident Economic Indicators (CEI) rose to a record high during February of this year (Fig. 3).
Indeed, we remain in the rolling recession camp rather than the “roiling recession” one.
(2) Calling another financial crisis. Then again, the yield curve has been spot on in anticipating that the Fed’s latest monetary policy tightening cycle would end when it triggered a financial crisis, as tightening cycles often have after causing something in the financial system to break (Fig. 4).
Silicon Valley Bank may very well be that broken something this time around. Past banking crises triggered by Fed tightening include Penn Central (1970), Franklin National (1974), Mexico banking crisis (1982), S&L crisis (1990), subprime mortgage meltdown (2007), and now SVB (2023). All of these crises coincided with peaks in the federal funds rate (Fig. 5).
(3) Calling a peak in interest rates. Melissa and I have previously observed that inverted yield curves tend to signal peaks in the interest rate cycle. The 2-year Treasury yield tends to rise faster than the 10-year yield and exceed it during the tail end of monetary policy tightening cycles (Fig. 6).
In our October 18, 2022 Morning Briefing, we wrote: “Our bond market analysis suggests that the 10-year Treasury bond yield might peak at 4.00%-4.25%, probably in November after the Fed raises the federal funds rate by 75bps and possibly in anticipation of one final 75bps hike in December that puts the terminal federal funds rate at 4.50%-4.75%.” The yield actually peaked at 4.25% on October 24.
Since then, the 10-year yield is down to 3.47%. The 2-year yield peaked at 5.05% on March 8 (following Powell’s hawkish congressional testimony) and is now down to 3.92% (Fig. 7). Our timely forecast was mostly influenced by the inversion of the yield curve.
(4) Calling a bear market in stocks. While the yield curve gets two stars for calling a financial crisis, it’s too soon to give it all five stars for calling an economy-wide credit crunch and a recession. The stock market’s perma-bears are doing so, but we aren’t in their camp. Leading the growling ursine crowd is Morgan Stanley’s Michael Wilson. He deserves credit for having turned bearish in late 2021 and for anticipating a rally in October.
According to a March 20 Fortune article, Wilson now believes that the SVB debacle marks “the beginning of the end of the bear market as falling credit availability squeezes growth out of the economy.” He added: “This is exactly how bear markets end—an unforeseen catalyst that is obvious in hindsight forces market participants to acknowledge what has been right in front of them the entire time.” He expects analysts to slash their earnings forecasts as the next reporting season approaches, while corporations prepare to lower guidance significantly.
And what does the yield-curve spread have to say about bear markets? It tends to be inverted during such selloffs. But it also tends to turn positive near the tail end of bear markets (Fig. 8).
Credit II: Small Banks & Small Businesses Are Codependent. It’s not too hard to imagine what could cause the next credit crunch. Notwithstanding the Fed’s commitment to back 100% of all deposits, depositors might flee to better yielding money market mutual funds. At the end of Q2-2022, there was $17.9 trillion in deposits, with $7.4 trillion insured and $10.5 trillion uninsured (but now implicitly guaranteed by the Fed) (Fig. 9). The outflows might be especially challenging for small banks that had $5.5 trillion in deposits during the March 8 week compared to $10.7 trillion at the large banks (Fig. 10).
To stem the outflows, the banks might raise their deposit rates to remain competitive. That would certainly squeeze interest margins, especially among the smaller banks that might find it harder to pass their increased deposit costs through to their lending rates.
Small banks are an important source of credit for the economy. For some perspective, here are some relevant data points:
(1) Deposits & loans. Deposits at small banks accounted for a record 31.3% of all deposits during the March 8 week (Fig. 11). Small banks accounted for a record 37.6% of all bank loans.
(2) Loan shares. Small banks currently account for significant shares of the following loan categories: commercial & industrial (28.1%), consumer (28.1), residential real estate (37.5), and commercial real estate (67.2) (Fig. 12).
To assess the impact of the current banking crisis on the economy, we will be monitoring the weekly deposits and loans data of the large and small banks. To the extent that a credit crunch ensues, our guess is that it will mostly be seen in the data for small banks.
Small banks’ customers tend to be small businesses. So we will also be monitoring the monthly survey of small business owners compiled by the National Federation of Independent Business. Of particular interest will be the “percent borrowing at least once a quarter” (30% in February) and the “net percent reporting that credit was harder to get than last time” (5.0% in February) (Fig. 13 and Fig. 14). Both measures have risen since late 2021 along with interest rates, but both remain relatively low.
Credit III: Housing & Consumers Are Rate Sensitive. Debbie and I will also be monitoring the response of homebuyers and consumers to the banking crisis. Our hunch is that the drop in interest rates so far will boost their buying of homes and consumer goods and services more than any credit crunch will depress it.
The drop in mortgage rates during February did provide a short-lived increase in mortgage applications to purchase a home (Fig. 15). The problem so far in March is that the drop in Treasury yields hasn’t lowered mortgage rates, as the spread between the 30-year mortgage rate and the 10-year Treasury yield widened to a near record 366bps on Friday (Fig. 16).
We reckon that consumers still have plenty of pent-up demand for autos because of limited supplies attributable to the parts shortages during the pandemic. However, higher interest rates and tougher lending standards for auto loans could weigh on auto sales. The question is whether the recent drop in interest rates will trickle down to auto financing rates.
Consumer revolving credit is driven more by employment and actual sales of consumer goods and services than by interest rates, suggesting that for most Americans the rate is moot because they pay down all or most of their credit card debt every month. Of course, plenty of consumers don’t do so for various reasons. In any event, consumer revolving credit was only 7.6% of personal consumption in January (Fig. 17). It was equivalent to 6.2% of disposable personal income (Fig. 18).
Credit IV: The Fed Should Give It a Rest. In his previous press conference on February 1, 2023, Fed Chair Jerome Powell mentioned the word “restrictive” 10 times. It was mentioned mostly in the same context as the following: “And we said that we continue to anticipate that ongoing increases in the [federal funds] target range will be appropriate in order to attain that stance of sufficiently restrictive monetary policy that will bring inflation down to 2%.”
More specifically, Powell said, “So we’ve raised rates 4½ percentage points, and we’re talking about a couple of more rate hikes to get to that level we think is appropriately restrictive.”
Of course, there was no mention of a banking crisis, especially since Fed officials have claimed that banks are doing just fine. There undoubtedly will be lots of discussion about the banking crisis at Powell’s next presser on Wednesday. He will have to acknowledge that the crisis confirms that interest rates are sufficiently restrictive and that financial conditions are rapidly getting tighter. Further rate hikes are no longer warranted, in our opinion.
Other People’s Money
March 20 (Monday)
Check out the accompanying pdf and chart collection.
Executive Summary: Will SVB be the financial domino that sets off an economy-wide credit crunch that leads to a recession? Maybe not given the Fed’s intervention; but if so, we don’t see another Great Financial Crisis. … Why have banking crises been a recurring cause of US recessions anyway? The crux of the problem is that bankers tend to take excessive risks because it’s not their own money on the line and the government has their backs. … Also, we take close looks at: how Fed tightening has eroded the value of banks’ bond portfolios, the SVB blame game, and SVB’s economic ripple effects. … And: Dr. Ed reviews “Living” (+).
YRI Weekly Webcast. Join Dr. Ed’s live webcast with Q&A on Mondays at 11 a.m. EST. You will receive an email with the link one hour before showtime. Replays of the weekly webcasts are available here.
Banking Crisis I: The Latest One. The March 17 WSJ featured an article by Jon Hilsenrath titled “Bank Failures, Like Earlier Shocks, Raise Odds of Recession.” We aren’t raising our recession odds just yet, but we may have to do so if we see signs that the Fed’s efforts to stabilize the current banking crisis aren’t working.
During the week ended March 10, Silicon Valley Bank (SVB) experienced a crippling bank run as uninsured depositors fled the bank. To prevent a contagion of bank runs, the Fed announced in a Sunday, March 12, press release that a “new Bank Term Funding Program (BTFP), offering loans of up to one year in length to banks, savings associations, credit unions, and other eligible depository institutions pledging US Treasuries, agency debt and mortgage-backed securities, and other qualifying assets as collateral. These assets will be valued at par. The BTFP will be an additional source of liquidity against high-quality securities, eliminating an institution’s need to quickly sell those securities in times of stress.”
The press release was titled “Federal Reserve Board announces it will make available additional funding to eligible depository institutions to help assure banks have the ability to meet the needs of all their depositors.” A week ago, Melissa and I concluded that the Fed had in effect guaranteed 100% of deposits to 100% of depositors. That should stop a contagion of bank runs by uninsured depositors.
However, we all still remember the Great Financial Crisis (GFC) and how the financial dominoes fell rapidly one after another. The current banking crisis isn’t likely to be as wrenching as the GFC. However, it could cause a recession if it triggers an economy-wide credit crunch. Whether it will is the question we’re grappling with currently. Is SVB the initial financial domino—i.e., financial crisis resulting from tightening monetary policy—that precipitates a credit crunch and a recession? Or has the Fed’s intervention significantly reduced that risk?
The inverted yield curve has been forecasting a repeat of the chain of events that lead from tightening monetary policy to economic downturns (Fig. 1). The spread between the 10-year and 2-year Treasury yields has tended to invert before recessions and to start ascending again just before or during recessions (Fig. 2). It has been increasingly inverted since the July 8 week of 2022.
This time may be different than the GFC in many ways; but the result might still be a credit crunch if creditors hunker down and continue to tighten their lending standards, as they started to do at the end of last year (Fig. 3). The bankers’ lending standards have especially tightened for commercial real estate loans (Fig. 4). However, as we’ve noted previously, there’s no sign of a credit crunch in the weekly bank loan data through the March 8 week (Fig. 5). It rose to a new record high that week, but that was just before SVB hit the fan.
Banking Crisis II: Now & Then. Banking crises have been a recurring cause of recessions in the US. There have been five in recent history: the Penn Central (1970), Franklin National (1974), Continental Illinois (1984), the subprime lending meltdown (2007), and now SVB (2023) (Fig. 6).
The intrinsic problem with banks is that, as financial intermediaries, they manage other people’s money (OPM). Unlike most businesses, banks’ liabilities consist mostly of OPM. During economic booms, this leads them to take on too much risk. After all, bankers aren’t putting their own money in jeopardy. They do have some skin in the game, of course, as stockholders. During good times, that emboldens them to take on more risk because the leverage provided by OPM increases the upside returns. And during such times, the downside risks tend to be mostly ignored because the upside is so enticing and it's mostly OPM that’s at risk anyway.
So in this way, OPM sets the stage for banks’ eventual busts, which occur when their excesses become widely recognized.
To protect the public, the government provides deposit insurance, which currently stands at $250,000 per deposit account. The insurance money is provided by a fee on banks collected by the Federal Deposit Insurance Corporation (FDIC). In effect, the insurance is a government-sponsored subsidy for the bankers, allowing them to hold onto their insured deposits even as they take on excessive risk. The insurance might ostensibly seem as though it would maintain financial stability; but it also promotes instability by allowing bankers freer risk-taking reign.
Moreover, during good economic times, depositors tend to get careless and deposit much more in their accounts than what is insured by the FDIC. Then during banking crises, those who aren’t fully insured may have a collective OMG moment when they realize simultaneously that their money is at serious risk.
That’s what happened at SVB during the week ended March 10. About 90% of the bank’s deposits were not insured. FDIC data show that since Q3-2009, insured deposits of all financial intermediaries rose 64% from $4.5 trillion to $7.4 trillion during Q2-2022 (Fig. 7). Over that same period, uninsured deposits rose 275% from $2.8 trillion to $10.5 trillion. Over this period, uninsured deposits increased from 39% of total deposits to 59% (Fig. 8). The Fed may have succeeded in stopping a contagion of bank runs by uninsured depositors.
However, depositors, whether insured or uninsured, still may move their funds out of the banks to money market securities, especially Treasury bills since their yields have soared over the past year as the Fed raised the federal funds rate by 450bps from 0.00%-0.25% to 4.50%-4.75%. Prior to financial deregulation during the 1980s, the Fed imposed ceilings on deposit rates under Regulation Q. So whenever money market interest rates rose above those ceilings, banks would experience disintermediation, forcing them to cut their lending. The resulting credit crunch would cause a recession.
This time, there are no ceilings. To avert disintermediation, the bankers are forced to raise their deposit rates to compete with money market rates. However, that squeezes their interest margin since they can’t raise the rates on their outstanding loans and fixed-income securities.
Banking Crisis III: AFS vs HTM. In addition to squeezing their interest margins, the value of bond portfolios held by banks has been slammed as the Fed has tightened monetary policy. During the March 8 week, the banks held $4.3 trillion in US Treasury and agency securities and $1.1 trillion in other securities (Fig. 9).
The FDIC estimated that the banks had losses of $600 billion on those securities. Most of them are categorized as held-to-maturity (HTM) rather than available-for-sale (AFS) securities. Consider the following based on CPA Michael Holdren’s “Rising Rates and Considerations for Held-to-Maturity Classification”:
(1) Available for sale. According to Accounting Standards Codification (ASC) 320-10-35, debt securities classified as AFS are required to be measured and reported at fair value. The resulting unrealized gains or losses are excluded from earnings and reported in other comprehensive income until realized. As a result, the unrealized losses noted depress the book capital levels.
With the implementation of revised Basel III capital rules on the March 31, 2015 call report, banks were allowed to opt out of including accumulated comprehensive income (AOCI) as a component of common equity tier 1 capital. As such, unrealized losses, which are a component of AOCI, are excluded from regulatory capital calculations.
If an AFS security is sold, then the gain/loss is reported on the income statement.
(2) Held to maturity. When securities are reclassified as HTM from AFS, they must be held to maturity. They cannot be sold. The unrealized gain or loss is determined at the date of transfer and remains a component of equity. As market rates change and unrealized loss positions adjust, the institution may not be able to take advantage of strategic opportunities by repositioning HTM securities.
HTM securities are those securities that are expected to be held to maturity. They are reported on the balance sheet at cost—not at fair value. Any gain/loss on their sale is reported on the income statement, and so is any gain/loss if they are held to maturity.
(See also “Available for Sale? Understanding Bank Securities Portfolios,” Liberty Street Economics, February 11, 2015.)
Banking Crisis IV: Banking on the Fed. Our message to the Fed: Hold off on any further rate hikes. Financial conditions might have tightened significantly since the end of last week, as evidenced by the jump in borrowing at the discount window during the March 15 week (Fig. 10). In the past, Fed monetary tightening cycles always ended when the result was a financial crisis that rapidly morphed into an economy-wide credit crunch. The SVB debacle may or may not be the current cycle’s breaking point, but taking the foot off the monetary brakes for a while would be prudent.
Meanwhile, the blame game has started. The left is blaming President Donald Trump for deregulating the regional banks during 2018. The right blames corporate wokeness.
The Fed is already starting to be attacked for its failure to regulate and supervise SVB. The March 17 issue of the New York Post included an op-ed titled “Why woke ’Frisco Fed chief missed Silicon Valley Bank’s warning signs.” The author is Paul Sperry, the former Washington bureau chief for Investor’s Business Daily. He charges that San Francisco Fed Chief Mary Daly was too busy “pushing woke agendas to regulate rogue banks like SVB, the second-biggest bank failure on record.” He observes that Greg Becker, the chief executive who presided over collapsed SVB sat on the SF Fed’s board. “It was one big happy woke family.”
It’s interesting to note that in the Fed’s latest Financial Stability Report, dated November 2022, the word “disintermediation” is not mentioned once. Nor are the large losses incurred by banks in their bond portfolios. In other words, the Fed didn’t see this banking crisis coming.
Banking Crisis V: From Rolling to Roiling Recession? The US economy has been experiencing a rolling recession since early last year. The question now is whether it just rolled into the banking industry, thus making an economy-wide recession inevitable since banks provide some of the credit necessary to finance economic activity.
We aren’t ready to conclude that. Interest rates have plummeted in recent days as a result of the banking crisis, which we think will be contained by the Fed’s response to the SVB debacle. Lower mortgage rates could end the single-family housing recession, which has been underway since early last year. Multi-family housing construction should remain strong. Lower rates could also boost auto sales.
Consumer spending remains resilient thanks to the tight labor market, with wages starting to rise faster than prices. Consumers have been spending on services and may be starting to spend more on goods again. Capital spending is getting a boost from onshoring and lots of fiscal spending on infrastructure, new semiconductor plants, and green new deals.
Movie. “Living” (+) (link) is about the meaning of life, especially when one finds out that life is short, i.e., lasting just another six months due to a terminal illness. That’s the fate of Mr. Williams, a civil servant played by Bill Nighy. At first, he tries living a new friend’s idea of a good life—involving a wild nightlife—but he’s just not into it. Instead, he finds solace by overseeing the building of a playground as a legacy for the next generation. The world would be a much better place if we all lived to make a better world for our children and grandchildren. Instead, we are racking up bigger debts to accommodate our current needs at the expense of future generations. Greta: Climate change is just one of many messes we are leaving you to deal with.
Banks, Tech & Batteries
March 16 (Thursday)
Check out the accompanying pdf and chart collection.
Executive Summary: SVB wasn’t last week’s only bank run: Two crypto-friendly banks that served as the major gateways to the crypto world also succumbed to depositors deciding to take their money and run. Jackie performs brief autopsies and looks at their impact on the crypto markets and the banks positioned to take their place. … Also: Counterintuitively at this time of economic uncertainty, the Technology sector has been outperforming the broader index since its February 2 peak. … And our Disruptive Technologies focus today is on the quest to build a better EV battery.
Financials: Cryptos Lose Banking Partners. The recent demise of Silvergate Capital and Signature Bank have jolted the crypto world. Silvergate Exchange Network (SEN) and Signature’s Signet were the platforms that crypto players used to exchange crypto currencies for dollars and vice versa, 24/7. Since they went poof, investors have been scrambling to find new onramps and offramps to the crypto currency world.
Let’s take a look:
(1) Silvergate: First man down. With $11 billion of assets, Silvergate Capital was the first to go belly up on March 8. Its demise occurred about a week after Silvergate announced it was delaying its 10-K report due to questions from independent auditors and warned about its ability to be a going concern. Were that not enough, the bank was also facing inquiries from bank regulators and the Department of Justice about its relationship with FTX.
The bank’s problems started last year with the demise of FTX, Sam Bankman-Fried’s cryptocurrency exchange, which held about $1 billion of deposits at Silvergate in Q4. FTX’s unraveling and fears of potential fraud led Silvergate’s customers to pull deposits from the bank and/or exit the crypto market. Crypto-related players were Silvergate’s primary customers, accounting for about 90% of the bank’s total deposits, which peaked at $14 billion at the end of 2021. By the end of last year, deposits had fallen to $3.8 billion. To cover Q4 withdrawals, the bank sold $5.2 billion of debt and borrowed $4.3 billion from the Federal Home Loan Bank.
Silvergate’s plans to liquidate occurred less than a week after it shut down Silvergate Exchange Network (SEN). The bank “has said that $1 trillion has changed hands on its network since the bank first allowed crypto businesses to deposit their dollars at its bank,” noted a wide ranging article in Intelligencer on January 24. “It was one of the biggest gateways from the banking system to the crypto business,” said Porter Collins, portfolio manager of Seawolf Capital, according to the article.
Silvergate has provided services to more than a dozen crypto companies that ended up under investigation, shut down, fined, or in bankruptcy, the Intelligencer article claims. Both customer count and deposits boomed in recent years—from 804 customers with $1.2 billion of total deposits in 2019 to 1,381 with $14.1 billion in 2021, according to the company’s 2021 annual report. Customers included digital currency exchanges such as Coinbase and Galaxy Digital, and investors in the bank included Citadel Securities and BlackRock.
Silvergate’s deposits were very concentrated. Its 10 largest depositors accounted for $6.3 billion in deposits, or about 45.3% of the bank’s total deposits in 2021. And 99.5% of deposits were non-interest bearing. Its loans were also concentrated, with its 10 largest borrowing relationships accounting for about 60.1% of its total loans held for investment in 2021.
Silvergate was known for being a crypto-friendly bank, but it was an old-fashioned run on its deposits that brought the bank down.
(2) Signature: Bigger but not better. Signature Bank, with $110.4 billion of assets, was shut down by state regulators on March 12. Like Silvergate, Signature was considered a crypto-friendly bank because it too offered crypto players a real-time, 24/7 payment service, Signet, which could exchange dollars for crypto.
After the collapse of FTX in November, Signature Bank tried to reduce its crypto exposure. It severed ties with Binance, the biggest crypto exchange, and shed up to $10 billion of deposits from crypto clients, which was more than a fifth of its deposit base at the time.
But those moves weren’t enough to appease customers spooked by the sudden collapse of Silicon Valley Bank. Signature Bank’s customers withdrew more than $10 billion of deposits on Friday, a substantial amount relative to the $88.6 billion of deposits it held at year-end, a March 13 CNBC article reported. Regulators took control of the bank on Sunday, guaranteeing customers’ access to deposits and uninterrupted service as it tries to sell the bank.
The Department of Justice “was examining whether the New York bank took sufficient steps to detect potential money laundering by clients—such as scrutinizing people opening accounts and monitoring transactions for signs of criminality, the people said. The Securities and Exchange Commission also was taking a look,” a March 14 Bloomberg article reported. It is unclear whether the investigation had anything to do with regulators’ seizure of the bank.
(3) Who’s open for crypto business? The demise of two of the friendliest crypto banks presumably has made it tougher to get into and out of crypto trades and has left crypto players scrambling to find banking services. A March 14 Cointelegraph article listed some traditional banking players that have opened themselves up to crypto business. Whether other banks will jump in with offerings may be determined by regulators, who have been wary of US banking exposure to the cryptocurrency markets.
Circle Internet Financial, issuer of USD stable coin (USDC), was caught with 8% of its reserves at Silicon Valley Bank last week. Since then, Circle has turned to BNY Mellon and Cross River Bank. BNY Mellon launched on October 11 a digital custody platform for institutional clients to own bitcoin and ether. Cross River Bank also works with Coinbase.
Customers Bank offers instant payments for business-to-business transactions and instant settlement for cryptocurrency trading firms, institutional investors, and others on its TassatPay platform, the Cointelegraph article reported. Axos Bank began offering its commercial banking clients access to TassatPay in May 2022. And London-based BCB Bank has a SEN-like network that processes euros, British pounds, and Swiss francs. It said it would accelerate its plans to add US dollar payments.
Strategy: Tech Holding Up on a Tough Tape. Usually bad news comes in threes. This week, it came in fours. The troubles of Silvergate Capital, Signature Bank, and Silicon Valley Bank were followed yesterday by escalating concerns about Credit Suisse Group’s solvency. The European bank’s shares tumbled more than 20%, dropping below $2 a share, before Swiss regulators said they were ready to offer the bank liquidity if needed. The shares bounced back above $2 on the news.
The recent selloff has left the S&P 500 up 1.4% ytd through Wednesday’s close and eroded the 8.9% gain achieved from the start of the year through its peak on February 2. During the market’s selloff, traditionally defensive S&P 500 Consumer Staples and Health Care sectors have outperformed, as one would expect. More surprising is the outperformance of the S&P 500 Information Technology sector, which is typically more sensitive to the economy but may be benefitting from the recent drop in Treasury yields.
While the DJIA fell 0.9% yesterday, the Nasdaq rose 0.1%. Among the few stocks in positive territory on Wednesday were Advanced Micro Devices, Alphabet, Intel, Meta Platforms, Microsoft, and Netflix.
Here’s the performance derby for the S&P 500 and its sectors from the recent market peak of February 2 through Tuesday’s close: Information Technology (-2.4%), Consumer Staples (-2.5), Industrials (-4.1), Utilities (-5.1), Health Care (-5.2), Energy (-5.8), S&P 500 (-6.2), Materials (-8.1), Consumer Discretionary (-10.0), Communication Service (-10.7), Real Estate (-11.8), and Financials (-12.1) (Table 1).
Let’s take a look at what’s driving some of the results:
(1) Tech leading in a down market. For such a depressing tape, it’s interesting that the S&P 500 Technology sector and many of its industries have been leading the market. Only 12 S&P 500 industries have positive returns from the index’s February 2 peak through Tuesday’s close, and three are in the Tech sector: Communications Equipment (1.5%), Semiconductors (1.2), and Technology Hardware, Storage & Peripherals (0.6), with Systems Software (-2.2) not far behind.
Arista Networks is the standout member of the Communications Equipment industry: Its shares have risen 17.3% since the S&P 500’s February 2 peak. The networking equipment company counts cloud providers as its biggest customers and recently reported adjusted Q4 earnings of $1.41 a share, beating Wall Street analysts’ consensus estimate by 20 cents, a February 13 Barron’s article reported.
Overall, the Communications Equipment industry is expected to post revenue growth of 10.0% this year and 4.9% in 2024 (Fig. 1). Its earnings growth is forecast to be a solid 12.5% this year followed by 8.3% in 2024 (Fig. 2). The industry’s profit margin is forecast to improve slightly to 25.4% in 2023, up from 24.8% in 2022, and analysts’ net earnings revisions have been solidly positive since last July (Fig. 3 and Fig. 4). The industry also has a forward P/E of 14.3, well below the S&P 500’s 17.7 forward multiple (Fig. 5).
(2) Some industrials holding up. The Industrials sector is home to the S&P 500’s top performing industry: Construction & Engineering is up 5.3% since the S&P 500’s February peak through Tuesday’s close. Not far behind are Environmental & Facilities Services (3.8%), Aerospace & Defense (0.4), Agricultural & Farm Machinery (-1.0), and Electrical Components & Equipment (-1.7).
The sole constituent of the Construction & Engineering industry is Quanta Services, a provider of contracting services for construction projects in the electric power, oil and gas, and communications industries. Quanta has grown earnings quickly: 25.4% in 2021 and 28.5% last year. Its growth is forecast to slow a bit this year, to 11.3%, and next year, to 14.1% (Fig. 6). Its success is no secret to investors: The Construction & Engineering stock price index is up 109.7% since year-end 2020 versus the S&P 500’s 4.3% rise (Fig. 7). The industry also has an above-market forward P/E of 22.2 (Fig. 8).
(3) Financials flounder. Given the bank failures in recent days, it’s not surprising that Financials is the S&P 500’s worst performing sector since the index’s February peak and that Regional Banks is its second worst performing industry, down 38.3% since February 2. Not far behind are the sector’s Investment Banking & Brokerage (-15.7%), Asset Management & Custody Banks (-15.6), Life & Health Insurance (-15.1), Consumer Finance (-11.6), and Diversified Banks (-11.5) industries.
Conversely, the outperformance of the Reinsurance industry is eye catching. It’s the S&P 500’s second best performing industry since the index’s February 2 peak, up 5.0%. The Property & Casualty Insurance industry also has held up well, having fallen only -3.2% over the same period. The Reinsurance industry’s earnings have fluctuated sharply in recent years between gains and losses. But analysts are optimistic that the industry will grow earnings a hearty 76.4% this year and 14.7% in 2024 (Fig. 9). The industry’s profit margins have rebounded sharply from their 2020 lows, and more improvement is expected this year and next (Fig. 10). Meanwhile, the Reinsurance industry’s forward P/E has remained low at 7.9 (Fig. 11).
(4) One eye on Materials. When the S&P 500 was rallying from its October low to the February high, the Materials sector was its top performing sector, rising 24.1%, and Copper was the S&P 500’s third best performing industry, up 51.6%. The Steel industry was in eighth place (up 44.8%) and Gold (up 25.1%) a bit further back.
The winds have shifted since the S&P 500’s February 2 peak, however: Materials has lost its leading role and has lagged the overall S&P 500. Likewise, Gold (-14.4%), Copper (-13.0), and Steel (-10.3) are among the bottom half of performers.
The nearby futures price of copper remains 25% above its 2022 low, but it has lost 5% from its February 21 recent high (Fig. 12). The decline in the Steel industry’s stock price index is surprising given that the price of Midwest domestic hot-rolled coil steel remains near its recent high, up 65% from its low last year (Fig. 13). Likewise, the gold spot price remains near the top of its trading range over the past three years (Fig. 14). The price of palladium has crashed, falling 50% from its March 8, 2022 high (Fig. 15).
Disruptive Technologies: Searching for Better Batteries. It’s the Holy Grail: A battery made of inexpensive, easily available materials that are lightweight, energy dense, and can hold a charge longer than today’s lithium-ion batteries. This perfect battery would eliminate the current reliance on costly nickel and cobalt, which comes from mines tarnished by alleged human rights abuses. Several alternative materials look promising, including sulfur, iron, silicon, and sodium; funding from the US government’s Inflation Reduction Act may accelerate advancements.
Here's some recent news on the electrifying subject:
(1) Studying sulfur. A lithium-sulfur battery could theoretically be made less expensively and store more energy than today’s lithium-ion batteries. A lithium-sulfur battery could power an electric vehicle (EV) twice as far as today’s batteries.
A March 7 article in GreenBiz cited several examples of progress in this arena: Argonne National Laboratory has developed a lithium-sulfur battery that can charge and discharge on par with today’s batteries. Korea’s LG Energy Solution plans to commercialize a lithium-sulfur battery by 2025. German startup Theion plans to bring a lithium-sulfur battery to market soon, and US startup Lyten is adding graphene to its battery to hold the sulfur together and act as a conductor.
(2) Evaluating silicon. Using silicon instead of lithium-ion batteries’ graphite anode, Sila Nanotechnologies has increased battery energy density by 20%-40% as well as improved charging speed. Mercedes plans to offer the Sila technology in its new electric EQG in 2025, a July 16 CNET article reported. Group14 is also examining the use of silicon in batteries and partnering with Porsche.
(3) Looking at sodium. Pacific Northwest National Lab recently announced that its sodium-ion battery technology, which uses less cobalt than lithium-ion batteries, improves battery temperature management, allowing batteries to charge many times without degrading. But its energy density needs improvement, currently it’s less than that of today’s lithium-ion batteries, CNET reported. China’s CATL and Natron are also reportedly experimenting with the chemistry.
(4) Ford to use iron. Ford Motor plans to produce lithium iron phosphate batteries for its EVs to be produced starting in 2026. These batteries, which don’t use cobalt or nickel, can be produced faster and cost 20% less than lithium-ion batteries while storing the same amount of energy, a February 17 MIT Technology Review article reported. The technology—known as “lithium ferrous phosphate” (LFP)—is popular in China and is being developed by Ford in conjunction with Chinese battery company CATL. Tesla imports LFP batteries from China for some models, and Ford plans to use it in its Mach-E and F-150 Lightning models.
Among the startups involved in LFP are: ICL-IP America and American Battery Factory, planning to produce LFP batteries by 2025 and 2026; Form Energy, developing an iron-air battery that uses a water-based electrolyte and stores energy using reversible rusting; and ESS, with yet another type of iron battery in the works.
(5) Batteries getting solid. Solid-state batteries use tightly compressed hard materials instead of the electrolytes today’s batteries use. Under development for many years, solid-state batteries aim to deliver greater energy density, faster charging, a longer life cycle, and little chance of igniting, the CNET article explained. Solid Power is developing solid-state batteries for Ford and BMW, while QuantumScape has backing from VW. Toyota and ProLogium are working on solid-state batteries as well.
The Oscars
March 15 (Wednesday)
Check out the accompanying pdf and chart collection.
Executive Summary: Within days of the run on SVB, the Fed has donned its “lender of last resort” cape—guaranteeing all bank deposits by all depositors (!), creating a new emergency bank lending facility, and launching a review of what went wrong at SVB. As a result, we don’t see sufficient SVB ripple effects to alter our outlooks for the economy or financial markets. … Also: Inflation has proven both more transitory (consumer goods inflation) and more persistent (consumer services) than expected, but both types have moderated lately. … And: Joe examines the S&P 500 Growth index’s comeback relative to Value after more than a year as the underdog.
The Fed: Everything Everywhere All at Once. This past Sunday, while Hollywood was preparing for the 95th annual showing of the Academy Awards, banking regulators were scrambling to contain the Silicon Valley Bank (SVB) financial crisis. The movie “Everything Everywhere All at Once” won seven Oscars including Best Picture, Best Original Screenplay, Best Actress in a Leading Role, and Best Supporting Actor. The two directors of the film also won.
If there had been a Best Director of a Bailout award, it undoubtedly would have been shared by Fed Chair Jerome Powell and Treasury Secretary Janet Yellen. Together, along with FDIC Chair Martin J. Gruenberg, they fashioned the latest rescue plan for our banking system—which they previously had claimed was in great shape. But then last week, SVB hit the fan, threatening to set off runs on banks generally, particularly regional ones. That’s because the crisis serves a reminder to depositors broadly that the FDIC insures deposits only up to a maximum of $250,000. The money center banks face the same threat but lower stakes, as they are deemed to be too big to fail.
By law, the Fed’s job is to keep unemployment and inflation down. In addition to its legal “dual mandate,” the Fed is ultimately responsible for maintaining financial stability. Our central bank was established in 1914 to do just that as the so-called “lender of last resort.” On Sunday, the Fed effectively agreed to guarantee 100% of deposits for 100% of all depositors. That was in response to the bank run on SVB last week.
More than 90% of SVB’s deposits were not insured by the FDIC. Depositors were spooked when the bank revealed that it had to sell some of its bonds at a loss of $1.8 billion to raise cash. FDIC data show that during Q2-2022, deposits totaled $17.9 trillion, with $7.4 trillion insured and the remaining $10.5 trillion uninsured (Fig. 1).
To reduce the risk of additional bank runs by uninsured depositors (and mitigate the adverse consequences if they do happen), the Fed issued a press release on Sunday titled “Federal Reserve Board announces it will make available additional funding to eligible depository institutions to help assure banks have the ability to meet the needs of all their depositors.”
That certainly sounds like a guarantee to protect all depositors! The Fed announced the creation of a new emergency lending facility called the “Bank Term Funding Program” (BTFP). It will offer “loans of up to one year in length to banks, savings associations, credit unions, and other eligible depository institutions pledging US Treasuries, agency debt and mortgage-backed securities, and other qualifying assets as collateral. These assets will be valued at par. The BTFP will be an additional source of liquidity against high-quality securities, eliminating an institution’s need to quickly sell those securities in times of stress.”
Also: “[d]epository institutions may obtain liquidity against a wide range of collateral through the discount window, which remains open and available. In addition, the discount window will apply the same margins used for the securities eligible for the BTFP, further increasing lendable value at the window.” (Here is a link to the term sheet.)
Yesterday, we wrote: “Our conclusion is that the Fed Put is back. This time, it’s aimed at stabilizing the banking system, which should also stabilize the financial markets. Under the circumstances, the Fed may pass on a rate hike at the FOMC meeting next week. Or if it goes with a 25bps rate hike to 4.75%-5.00%, it might use the SVB debacle as proof that the federal funds rate then would be restrictive enough and opt to hold it there for a while.”
We also concluded: “In other words, the incident doesn’t change our economic or financial market outlooks. We remain in the soft-landing camp, giving this scenario a 60% subjective probability versus 40% for a hard landing. We remain convinced that the 10-year Treasury yield peaked at 4.25% last October 24 and that the S&P 500 bottomed on October 12.”
The Federal Reserve Board on Monday announced that Vice Chair for Supervision Michael S. Barr is leading a review of the supervision and regulation of SVB in light of its failure. The review will be publicly released by May 1. “The events surrounding Silicon Valley Bank demand a thorough, transparent, and swift review by the Federal Reserve,” said Chair Jerome H. Powell. “We need to have humility, and conduct a careful and thorough review of how we supervised and regulated this firm, and what we should learn from this experience,” said Vice Chair Barr.
Also on Monday, Moody’s Investors Service cut its view on the entire banking system: “We have changed to negative from stable our outlook on the US banking system to reflect the rapid deterioration in the operating environment following deposit runs at Silicon Valley Bank (SVB), Silvergate Bank, and Signature Bank (SNY) and the failures of SVB and SNY.” The rating agencies seem to have a history of “better late than never” when it comes to rating downgrades in the wake of crises.
US Inflation: Everything Everywhere All at Once But Less So. And the Academy Award for the Biggest Economic Surprise of 2022 goes to . . . inflation. It has defied Fed expectations by being both transitory and persistent: Consumer goods inflation has been transitory, while consumer services inflation has been persistent. In any event, overall measures of consumer inflation continue to moderate. Consider the following:
(1) Expected and actual inflation. The New York Fed’s consumer expectations survey was released on Monday with February’s results. It shows that the Fed has succeeded in lowering inflationary expectations. The one-year-ahead series is down from a peak of 6.8% during June 2022 to 4.2% in February (Fig. 2). The three-years-ahead annualized series is down from a peak of 4.2% during September and October 2021 to 2.7%.
Not surprisingly, the one-year-ahead expected inflation rate closely tracks the actual y/y inflation rates as measured by the CPI and PCED (Fig. 3). The CPI inflation rate peaked at 9.1% during mid-2022, falling to 6.0% in February. The PCED measure is down from 7.0% during June 2022 to 5.4% in January. Collectively, these three measures continue to show a moderating trend.
(2) Consumer goods inflation. The most transitory inflation rate has been the one for consumer durable goods (Fig. 4). The CPI shows it soaring from -0.9% during June 2020 to a peak of 18.7% during February 2022. Since then, it has plunged back below zero at -1.8% during February.
Much of that rapid round trip was attributable to a buying binge for durable goods fueled by the government’s pandemic relief checks. The demand shock overwhelmed global supply chains, sending prices soaring. Once pent-up demand was more than satisfied and supply chains normalized, inflation for consumer durable goods came tumbling down.
The CPI for consumer nondurable goods was mostly negative in the low single-digits during 2020 (Fig. 5). It soared to a peak of 16.2% during June 2022. It was back down to 6.4% during February.
(3) Consumer services inflation. While consumer goods inflation continues to disinflate, there is not yet a clear peak in the consumer services inflation. The services CPI rose 7.6% y/y through February (Fig. 6). That’s a new high for the current inflation cycle. The CPI for rent of shelter also rose to a new high of 8.1% over the same period. CPI services excluding rent of shelter seems to have peaked at a record high of 8.2% last September. It was down to 6.9% during February.
Strategy I: Growth Overtakes Value. The meltdown in regional bank stock prices following SVB’s failure and the rapid decline in Treasury bond yields suggest that investors believe the Fed rate-hike cycle is close to ending. The regional banks could be facing the same music that the larger, major banks were forced to listen to following the Great Financial Crisis. New calls for renewed and increased regulation of the regional banks could lead to dividend cuts and forced shoring up of capital, which underscores the earnings and valuation risk that they face in the future.
With two weeks left before the quarter closes, the newswires soon will be filled with pre-announcements of misses in Q1 results. Indeed, United Airlines surprised investors on Tuesday by warning of an expected Q1 loss. The company cited recent weaker demand growth and higher fuel costs. UAL’s stock price fell 5.4% on Tuesday on the news. The regional banks and airlines are members of the S&P 500 Value index, which has been underperforming S&P 500 Growth since January.
Within the S&P 500 Growth index, Meta announced yet more layoffs and reduced open-job postings on Tuesday in a continued effort to cut costs and shore up its bottom line. The effort appears to be working. Meta’s forward earnings and valuation are rising again after falling sharply since late 2021 (Fig. 7). Meta’s stock rose 7.3% on the news Tuesday and is now the S&P 500’s best ytd performer with a gain of 61.2%.
Meta isn’t alone in reducing its headcount, which nearly doubled after the pandemic from 45,000 to 87,000. Sizeable job reductions have also occurred at Alphabet, Amazon, and Microsoft, which could help improve their profits, valuation, and stock prices.
The S&P 500’s Growth index price has outperformed its Value counterpart after underperforming from November 30, 2021 to January 3, 2023 (Fig. 8). During that period, Growth tumbled 29.3% but Value dropped just 0.5%. Since January 3, when Growth’s price relative to Value bottomed at a two-year low, Growth is up 1.9%, while Value is down 1.4%.
From a valuation perspective, Growth’s forward P/E appears to be on the road to recovery. It had fallen from a peak of 30.3 in January 2021 to 17.6 on January 5 this year. Growth’s forward P/E relative to Value bottomed on January 4 at a generational 14-year low of 1.10, when the forward P/E ratios of Growth and Value were 17.8 and 15.9 (Fig. 9). The relative P/E is now back up to 1.20 as of Monday’s close, with Growth’s forward P/Es rising to 18.7 and Value’s falling to 15.6 (Fig. 10).
The Lender Of Last Resort
March 14 (Tuesday)
Check out the accompanying pdf and chart collection.
Executive Summary: While the Fed and FDIC have acted swiftly to contain the SVB debacle, could it still balloon into a financial crisis like previous ones that triggered a credit crunch and recession? It could if it set off a wave of disintermediation at banks broadly, but we doubt that will happen; we think the regulators’ actions will work. … So the incident doesn’t change our outlooks for the economy, stock market, or bond market. But it does revive the “Fed Put.” That’s because the Fed’s actions to stabilize the banking system also stabilize financial markets.
The Fed I: Something Broke. Melissa and I are ready to concede. The inverted yield curve has nailed it again! In the past and once again now, yield-curve inversions have signaled that if the Fed persisted in raising interest rates, something in the financial system would break. Sure enough, the SVB debacle may be that something this time around (Fig. 1 and Fig. 2).
We had been arguing that nothing bad may happen this time around, because the banking system is in much better shape now as a result of increased government regulation and supervision since the Great Financial Crisis. The SVB debacle reveals that might not be the case, as soaring interest rates are causing disintermediation. More depositors now may move their funds from their bank accounts to money market instruments. That in turn may force the banks to boost their deposit rates, narrowing their profit margins.
Exacerbating the problem is that the SVB crisis is putting more pressure on regional banks, as it reminds depositors that the FDIC insures deposits only up to a maximum of $250,000. The money center banks have a similar issue, but they are deemed to be too big to fail. So they actually may benefit from the crisis if depositors switch from accounts at regional banks to the money center banks.
There’s more: The FDIC estimates that soaring interest rates reduced the value of the bond portfolios of the banks by around $600 billion at the end of last year. Most of them are classified as held to maturity (HTM). The rest are classified as available for sale (AFS). HTM securities, which management has the intent and ability to hold until maturity, are carried at amortized cost. AFS securities are carried at fair value, and their unrealized gains and losses are reported as net increases or decreases to accumulated other comprehensive income.
So the losses on the HTM bonds aren’t a problem unless the banks are forced to sell them to raise money to pay fleeing depositors. That’s what happened at SVB. In the old days, it was easy to spot a bank run by the long line of depositors hoping to withdraw their funds outside the bank. Now it all happens over smartphones, raising the risks of “flash” bank runs.
Let’s have a look at the latest weekly balance sheet data for commercial banks, data that we intend to monitor closely in coming weeks:
(1) Loans. During the March 1 week, loans and leases at the banks totaled $12.1 trillion, consisting of $6.5 trillion at large domestic banks and $4.5 trillion at small domestic ones (Fig. 3). They were all at record highs. There’s clearly no sign of a credit crunch in the loan data, so far.
We doubt that will change as a result of the SVB situation as we currently understand it. The main sources of lendable funds for the banks are deposits, maturing securities, and borrowing. On a y/y basis through the March 1 week, deposits are down $477 billion, securities are down $369, borrowings are up $332 billion, and loans are up $1,179 billion (Fig. 4). Yes, we know, something is missing. Cash assets of commercial banks are down $725 billion over the same period mostly as a result of quantitative tightening (QT). (We will write more on this in the near future.)
(2) Securities. As of the March 1 week, US Treasury and agency securities held by commercial banks totaled $4.4 trillion, with $3.2 trillion held at large banks and $1.0 trillion at small banks (Fig. 5). On a y/y basis, they are down $343 billion, $324 billion, and $11 billion, respectively. We don’t have data to show the amounts of securities that are AFS and HTM.
(3) Deposits. Bank deposits peaked at a record-high $18.1 trillion last year during the April 13 week (Fig. 6). They are down $520 billion since then through the March 1 week, led by a $559 drop in deposits at large banks and $7 billion at small ones.
The period of decline coincides with the implementation of QT last summer. In addition to QT weighing on deposits, disintermediation also was going on, as suggested by the fact that retail money market funds are up $395 billion y/y through the March 8 week (Fig. 7).
(4) Borrowing. The Fed’s weekly commercial bank balance sheet includes borrowing from banks and nonbanks. It totaled $2.0 trillion during the March 1 week, with $638 billion at large banks and $428 billion at small ones (Fig. 8). (The remainder of the borrowing was attributable to foreign-related banks.)
(5) Bottom line. The question now is whether the implosion of SVB is a financial crisis that will trigger an economy-wide credit crunch and a recession. It could be, though we doubt it. We expect that the fallout will remain relatively contained by the actions taken by the Fed and the FDIC, announced on Sunday.
In other words, the incident doesn’t change our economic or financial market outlooks. We remain in the soft-landing camp, giving this scenario a 60% subjective probability versus 40% for a hard landing. We remain convinced that the 10-year Treasury yield peaked at 4.25% last October 24 and that the S&P 500 bottomed on October 12.
The Fed II: The Fed Put Is Back. Our ongoing positive predilections are predicated on our belief that the actions taken by the bank regulators over the weekend will work. They certainly will do so for all SVB’s depositors. The widespread fear is that these actions won’t stop depositors from pulling their cash out of uninsured bank accounts, which totaled $10.5 trillion during Q2-2023, according to FDIC data. That compares to $7.4 trillion of insured deposits of $250,000 or less (Fig. 9).
To reduce the risk of this happening (and mitigate the adverse consequences if it does happen), the Fed issued a press release on Sunday titled “Federal Reserve Board announces it will make available additional funding to eligible depository institutions to help assure banks have the ability to meet the needs of all their depositors.”
The Fed announced the creation of a new emergency lending facility called the “Bank Term Funding Program” (BTFP). It will offer “loans of up to one year in length to banks, savings associations, credit unions, and other eligible depository institutions pledging US Treasuries, agency debt and mortgage-backed securities, and other qualifying assets as collateral. These assets will be valued at par. The BTFP will be an additional source of liquidity against high-quality securities, eliminating an institution’s need to quickly sell those securities in times of stress.”
Also: “[d]epository institutions may obtain liquidity against a wide range of collateral through the discount window, which remains open and available. In addition, the discount window will apply the same margins used for the securities eligible for the BTFP, further increasing lendable value at the window.” (Here is a link to the term sheet.)
Our conclusion is that the Fed Put is back. This time, it’s aimed at stabilizing the banking system, which also stabilizes the financial markets. Under the circumstances, the Fed may pass on a rate hike at the FOMC meeting next week. Or if it goes with a 25bps rate hike to 4.75%-5.00%, it might use the SVB debacle as proof that the federal funds rate then would be restrictive enough and opt to hold it there for a while.
Run For The (Sand) Hill
March 13 (Monday)
Check out the accompanying pdf and chart collection.
Executive Summary: Tightening monetary cycles often end abruptly when “something breaks” and a financial crisis is triggered. If the Silicon Valley Bank run is that something, it could mean tightening ends sooner and bond yields have peaked. We can’t say for sure that’s the case but can say the debacle should keep the tech sector mired in its rolling recession for longer. While the SVB crisis doesn’t change our economic and stock market outlooks for now, it adds uncertainty until resolved in a way that minimizes systemic shock. … Also: A theory for why labor market demand so persistently exceeds supply points a finger at the Baby Boomers. … Dr. Ed reviews “Till” (+ + +).
YRI Weekly Webcast. Join Dr. Ed’s live webcast with Q&A on Mondays at 11 a.m. EST. You will receive an email with the link one hour before showtime. Replays of the weekly webcasts are available here.
Strategy: Financial Crises Now & Then. Sand Hill Road is an arterial road in western Silicon Valley, California, running through Palo Alto, Menlo Park, and Woodside, notable for its concentration of venture capital companies. Many of their start-ups and employees borrowed money from Silicon Valley Bank (SVB) and had large deposits there. The high-powered bank was closed by regulators on Friday to stop a very old-fashioned bank run that started on Thursday.
The S&P 500 dropped 3.3% on Thursday and Friday, led by money center and regional bank stocks. The index fell through both its 50-day and 200-day moving averages to close at 3861.59, just 0.6% above its 2022 close (Fig. 1). January’s big gains among the 11 sectors of the S&P 500 mostly evaporated during February and the first 10 days of March. Here is their ytd performance derby: Information Technology (9.0%), Communication Services (7.1), Consumer Discretionary (6.7), S&P 500 (0.6), Industrials (0.5), Materials (0.3), Real Estate (-2.7), Financials (-4.1), Consumer Staples (-4.9), Energy (-6.5), Health Care (-8.9), and Utilities (-9.3) (Fig. 2).
Last week’s rout in the stock market started on Tuesday, March 7, when the S&P 500 fell 1.5% following Fed Chair Jerome Powell’s congressional testimony that day. He came across as more hawkish than he had been at his February 1 press conference mostly because January’s economic and inflation data were stronger and hotter than expected. Market expectations for the federal funds rate decision when the FOMC meets later this month jumped from an increase of 25bps to 50bps following his testimony. In response to SVB’s debacle, expectations were back down to a 25bps rate hike.
The 2-year Treasury note yield rose from 4.86% on March 3 to 5.05% on March 8 (last Wednesday) on fears that February’s batch of economic indicators might confirm the strength of January’s batch, which they have so far. But the 2-year yield dropped to 4.60% by the end of last week when regulators pulled the plug on SVB (Fig. 3). The 10-year Treasury yield dropped from a recent high of 4.08% on March 2 to 3.70% by the end of last week. The 2-year versus 10-year yield-curve spread remained highly inverted at 92bps (Fig. 4).
As occurred in the past, the inverted yield curve signaled that investors thought tightening monetary policy could cause something to break in the credit system. In the past, the initial financial crisis often morphed into an economy-wide credit crunch and recession. This time, stock investors feared that SVB might be the financial crisis that turns into a contagion.
For now, Debbie and I see the SVB debacle exacerbating the rolling recession that has depressed the technology sector of the US economy. Tech firms hired too many workers during the pandemic when their business was booming. In recent months, they have been forced to cut their payrolls. Now, lots of tech start-ups that have been burning cash rapidly may be hard pressed to get another round of financing. That may force them to slash their payroll and capital budgets or shut down. If lots of tech startups start failing, it could be somewhat reminiscent of the dot.com implosion in the early 2000s.
In the here and now, the prospect of financial instability will likely make the FOMC more cautious about raising interest rates too aggressively. As happened a few times in the past, tighter monetary policies caused funds to flow out of bank deposits and into money market instruments. Such disintermediation forced financial intermediaries to reduce their lending activities, causing a credit crunch and a recession.
The big risk is that the SVB debacle triggers significant outflows from bank deposits exceeding $250,000 that are not insured by the FDIC into Treasury securities. More than 90% of SVB’s deposits, totaling approximately $200 billion, were uninsured. Investors and depositors tried to pull $42 billion from SVB on Thursday in one of the biggest US bank runs in more than a decade, according to a Friday regulatory filing. The run was sparked by a letter that SVB’s CEO Greg Becker sent to shareholders Wednesday. The bank had taken a $1.8 billion loss on the sale of US Treasuries and mortgage-backed securities and outlined a plan to raise $2.25 billion of capital to shore up its finances. We will be monitoring the weekly data on commercial bank deposits and money market mutual funds (Fig. 5 and Fig. 6). They are currently available through the week of March 1 and March 8, respectively.
The deposits of all commercial banks peaked at a record high during the April 13 week of last year (Fig. 7). They are down $520 billion since then. That’s attributable not only to disintermediation but also to the impact of quantitative tightening on the money supply and its components. Nevertheless, deposits remain 32% above the final week of February 2020, just before the pandemic.
Meanwhile, loans held by commercial banks rose to a record high of $1.21 trillion during the March 1 week. The banks funded some of those loans by reducing their portfolios of Treasury and agency securities as they matured. The problem at SVB is that the bank had to sell such securities at a loss to meet withdrawals. News of that turned the withdrawals into a bank run.
So where do we stand now? We obviously are more convinced that the 10-year bond yield peaked at 4.25% on October 24 of last year. We are less certain that the S&P 500 made a bear-market bottom on October 12, but that’s still our position. As for our economic outlook, we remain in the soft-landing camp. The risks of a credit crunch and recession may be increasing but we aren’t ready to raise our subjective probability of 40% for a hard landing until we see how the regulators resolve the SVB crisis, which we currently don’t expect will turn into a credit crunch.
Monetary Policy: Long Lags or Short Ones? Fed officials have often stated that monetary policy operates with a “long and variable lag” on the economy. Economist Milton Friedman first promoted this concept. He was referring to the growth rate of the money supply rather than to interest rates. He was defending his monetarism theory—i.e., that monetary policy shouldn’t try to manage the business cycle. Instead, policy should be aimed at maintaining a relatively constant growth rate in the money supply that would support real economic growth while keeping inflation subdued.
Theoretically, monetarism makes sense. Empirically, the theory has been challenged by the changing nature and definition of money. Financial deregulation since the 1980s has only reduced the feasibility of implementing monetarism.
In any event, our research over the years shows that tightening monetary policies—as defined by the troughs and peaks of the federal funds rate—tend to have relatively quick and abrupt impacts on subsequent economic activity, not delayed impacts after long and variable lags. In the past, the monetary tightening cycles ended when they resulted in financial crises (Fig. 8).
It's hard to say for sure whether the SVB implosion is the current tightening cycle’s “something” as in the expression “something will break if the Fed continues to raise interest rates.” If it is, then the federal funds rate has peaked or will do so very soon. The same can be said about the bond yield. That should be good news for stock investors. However, the uncertainty about the ultimate financial and economic fallout from SVB may keep us all in suspense for a while longer.
US Labor Market: A Baby-Boom Theory. The persistently strong demand for labor has surprised everyone from soft landers to hard landers. Fed officials are flummoxed. They’ve raised the federal fund rate by almost 500bps since early last year to cool labor demand and wage inflation. Yet the labor market remains hot.
During January, the demand for workers measured as the sum of employment and job openings totaled 171.0 million, 5.1 million more than the supply of workers as measured by the labor force (Fig. 9). The shortage of workers has hovered around 5.0 million since the end of 2021 (Fig. 10). Here's how Fed Chair Jerome Powell analyzed the employment situation using this framework in a November 11, 2022 speech titled “Inflation and the Labor Market.”
Lots of reasonable reasons have been offered to explain why the supply of labor hasn’t kept up with demand. However, no one seems to be asking why the demand for labor is so strong. As a card-carrying member of the Baby Boom generation, I blame my cohort for boosting the demand for workers in the restaurant, health care, and trucking & warehousing industries:
(1) Restaurants. Americans generally, not just Baby Boomers, are eating out more often. Having dinner at home with the family is occurring less often. Aging Baby Boomers are likely to go to restaurants more often since their kids are young adults with their own families. Quite a few of these kids may be single and more prone to eat out alone or with friends.
The percentage of the population 16 years and older that is single has exceeded 50% since around 2015, up from under 40% in the late 1970s (Fig. 11). The singles consist of 85.8 million who have never been married and 49.6 million who are divorced, separated, or widowed (Fig. 12).
These demographic trends might explain why retail sales of food services & drinking places has soared to new highs after the pandemic, well exceeding retail sales of food & beverage stores since then (Fig. 13).
Payroll employment in accommodation & food services rebounded dramatically since the pandemic, and the industry had job openings totaling 1.5 million in January (Fig. 14).
(2) Health care. Aging Baby Boomers are clearly increasing the demand for health care services and workers. That’s obvious. During February, a record 21.1 million people were employed in health care & social assistance (Fig. 15). In January, there were 1.9 million job openings in this industry.
(3) Trucking & warehousing. Among the industries that recovered fastest from the pandemic were transportation & warehousing. Employment in these two industries totaled 6.7 million during February, 0.9 million more than February 2020, just before the lockdowns (Fig. 16). What does that have to do with aging Baby Boomers? We can’t be bothered going to crowded malls and supermarkets. So we shop online and have the goods delivered to our homes.
(4) Bottom line. Fed Chair Jerome Powell has frequently acknowledged that the Fed has a limited set of blunt instruments for managing the economy. Fighting the Baby Boomers’ demand for labor is likely to be a quixotic mission that won’t be accomplished.
Movie. “Till” (+ + +) (link) is an outstanding docudrama with an outstanding performance by Danielle Deadwyler as Mamie Till-Bradley. She was an educator and a civil rights activist who fought for justice after her 14-year-old son Emmett was lynched in August 1955 in Money, Mississippi. The murder sparked national and international outrage after photos of his mutilated corpse were published. In 2022, Congress passed and President Joe Biden signed the Emmett Till Antilynching Act, which makes lynching a federal hate crime. A lot of progress has been made in improving civil rights in the US, but more needs to be done.
China, Defense & AI Videos
March 09 (Thursday)
Check out the accompanying pdf and chart collection.
Executive Summary: China’s economy has recovered after the country lifted its zero-Covid lockdowns. But that news has been eclipsed by the rising geopolitical tensions between the US and China. Jackie examines the escalating tensions. … Also: A look at projected defense spending in the US and China and how the S&P 500 Aerospace and Defense industry’s stock price index has been faring after a super-strong 2022. … Finally, our Disruptive Technologies segment focuses on how AI is transforming the production of movies and video games.
China: Rocky US Relations. The mainstream media coverage of China has been focused on the souring relationship between the US and Chinese governments. Meanwhile, China’s economy and stock market improved after the lifting of China’s zero-Covid policy. The China MSCI share price index has risen 40.1% since its October 31, 2022 low, though it’s down 10.9% from its recent high on January 27 (Fig. 1).
Here’s Jackie’s look at the many items causing tension between the two nations and the recent improved economic data out of China:
(1) Tense times. There have always been multiple points of disagreement between the US and Chinese governments, but this year the animosity between the nations has reached epic levels.
Specifically, the US and China have been on opposite sides of the Ukraine war since it began, but this year China reportedly has been considering supplying arms to Russia. Likewise, the US and China have always disagreed about who should control Taiwan, but this year the US has increased the number of troops on the island to train Taiwan’s military, and China has reacted to Lockheed Martin’s and Raytheon’s sale of arms to Taiwan by banning the companies’ goods from trade with China. Moreover, both countries have made recent military maneuvers around Taiwan: A US warship sailed through the Taiwan Strait in January, and Chinese air force planes regularly enter Taiwan’s air defense zone.
In the first step away from brinkmanship, Taiwan’s President Tsai Ing-wen convinced US House Speaker Kevin McCarthy to meet in California instead of Taiwan to avoid “an aggressive Chinese military response,” a March 6 FT article reported.
In addition to tangling over Taiwan, China isn’t happy about US government restrictions on the export of sophisticated semiconductor chips and equipment to China, nor does it agree with the threatened ban of TikTok. China has responded by initiating a trade dispute at the World Trade Organization.
The appearance of what seems to be a Chinese spy balloon drifting across the US sparked the ire of US politicians and nixed the US Secretary of State Anthony Blink’s planned visit to Beijing. And when the US military shot down the balloon and kept it, Chinese officials—who claim it’s a weather balloon blown off course—were none too pleased.
(2) Heated words. These aggressive actions have been accompanied by heated words. Chinese President Xi Jinping accused the US of pushing Western nations to “implement the all-round containment and suppression of China,” while China’s new Foreign Minister Qin Gang warned of “catastrophic consequences if the US fails to ‘hit the brakes’ and allows the relationship with China to continue to go downhill,” a March 7 South China Morning Post article reported. Qin blamed the US for escalating the Ukraine conflict and for harming emerging market countries by raising US interest rates so high. And perhaps most importantly, he warned the US not to cross China’s “red lines” on Taiwan.
(3) Xi consolidates power. China is establishing two new organizations to regulate the country’s financial industry and data, and it’s restructuring its science and technology ministry. The moves were widely seen as Xi’s attempt to consolidate and increase his power over each of these important areas.
The National Financial Regulatory Administration, the new financial regulator, will supervise the financial industry and report directly to the State Council, or cabinet. It will consolidate regulation that had occurred under three separate entities and eliminate loopholes. “The setting up of the new financial regulatory body comes as Beijing seeks to rein in large corporate and financial institutions that may bring systemic risks via regulatory arbitrage among multiple authorities,” a March 7 Reuters article explained.
It’s a bit ironic that a new financial services regulator is being created by a government that apparently has detained billionaire technology investment banker Bao Fan. Bao has been missing since late February. His company, China Renaissance Holdings, has been tight-lipped about his disappearance except to say that he is cooperating with Chinese authorities conducting an investigation.
China’s new data agency will centralize the management of China’s data, replacing a system where data are stored in multiple ministries, which each share responsibility for oversight of the data. The data agency will be run by the state planner, the National Development and Reform Commission, reinforcing China’s belief that data has become a strategic economic resource. The agency will control the flow of data within and outside of China.
The Ministry of Science and Technology is being restructured to focus resources on achieving scientific and technology breakthroughs. “It will also form a Central Commission on Science and Technology, increasing Communist Party control in the field,” the Reuters article stated. The agency is expected to help China become more self-sufficient in areas like semiconductors, where US trade sanctions and restrictions have hampered the company’s ability to manufacture the most advanced semiconductors.
Renowned emerging markets investor Mark Mobius warned that China is taking golden shares in many Chinese companies, implying that the country will try to control the companies in the future. These stakes—which may be given to the government in exchange for the ability to remain in business—may be small, but they often confer the right to board seats, voting power, and give the government sway over business decisions, explained a March 8 WSJ article.
(4) Slow growth anticipated. China expects real GDP growth of roughly 5% this year, which is sluggish for an emerging market economy. It is an improvement from the Covid-impaired 2.9% growth in GDP last year (Fig. 2). Economic growth has been helped by the elimination of Covid restrictions throughout China and by bank reserve ratio requirements that have been lowered in recent years (Fig. 3). China’s manufacturing PMI surged in February to 52.6, up from 47.0 in at the end of last year, and its non-manufacturing PMI jumped to 55.0 in February from 46.7 in November (Fig. 4 and Fig. 5). China’s bank loans also popped in January, up 5.5% m/m to a record high (Fig. 6).
Conversely, economic activity is being weighed down by falling exports and high debt. China’s exports fell 6.7% y/y during January and February, continuing a string of declines since October. Rising interest rates around the world could be pinching demand for Chinese-made items. Meanwhile, China’s imports fell 10.1% in January and February (Fig. 7). (China reports imports and exports for January and February together to eliminate the effect of the Lunar New Year holiday, which falls some years in January and some in February.)
China’s economic growth may also slow as global companies look to diversify where they manufacture goods, with India and Mexico among the contenders. There are reports that Foxconn Technology Group, an Apple supplier, plans to spend $700 million to build a new plant in India. And numerous semiconductor chip manufacturers are planning to build plants in the US, lured by government incentives.
(5) Debt high. Local municipalities are struggling with billions of dollars of debt due to the expenditures on Covid mass testing and lockdowns. And municipal revenue has fallen sharply because land sales have dropped due to the country’s faltering real estate market. “Two-thirds of local governments are now in danger of breaching unofficial debt thresholds set by Beijing to signify severe funding stress, with their outstanding debt exceeding 120% of income last year,” a March 6 WSJ article reported. About a third of China’s major cities are struggling to pay just the interest on the debt they owe, it continued.
Complicating the situation, 84% of the $84.2 billion of offshore debt owed by local government financing vehicles matures between this year and 2025. At best, this means cities will have to cut spending to service their debt. At worst, there will be defaults. The article relayed stories of bus drivers whose salaries were cut in 2021 and haven’t been restored, teachers who didn’t receive bonuses, and street sweepers who haven’t been paid at all.
(6) Odd development. Mark Mobius told Fox Business that he’s unable to withdraw funds he has at HSBC in Shanghai. The Chinese government hasn’t officially said he can’t transfer his funds; instead it has thrown up barriers, asking him for things like 20 years of records on how the money was made. China’s currency regulator said there hadn’t been any changes to policies regarding the country’s “cross-border remittance of funds,” and HSBC said its policies hadn’t changed either.
Industrials: Defense Spending Keeps Rising. The Biden administration is expected tomorrow to unveil its defense spending budget for fiscal 2024 (ending September 30, 2024). Given the Ukraine war and verbal hostilities with China, there’s no doubt that the amount spent will rise. A Bloomberg article yesterday reported that the administration will request more than $835 billion for the Defense Department, up from $816 billion this fiscal year. If that report is correct, the 2.3% jump wouldn’t even keep up with inflation.
The spending increase also seems paltry relative to the 7.2% jump in defense spending that China plans, to $224 billion, according to a March 5 WSJ article. China’s defense spending has been growing faster than the 5% growth expected for Chinese GDP this year. Moreover, the WSJ noted that “many Western experts believe China’s actual military spending greatly exceeds the official figure.”
The US defense budget does not include $113 billion in military and economic aid given to Ukraine since last year's Russian invasion, a February 28 Defense News article reported. The funding is expected to last through September but will then need to be replenished, as munitions are rapidly consumed by Ukraine.
The S&P 500 Aerospace and Defense industry was among the top performers last year, rising 15.5% compared to the S&P 500’s 19.4% decline. This year, the industry has had a sluggish start, falling 0.3% ytd through Tuesday’s close compared to the S&P 500’s 3.8% increase (Fig. 8). But it’s still expected to post solid revenues and earnings results this year and next. Revenue is expected to climb 7.6% this year and 7.7% in 2024 (Fig. 9). Earnings per share are forecast to jump 45.4% this year and 23.4% in 2024 (Fig. 10).
Something to keep an eye on, however, is the industry’s valuation. Its forward P/E is at a record high of 22.3 (Fig. 11).
Disruptive Technologies: AI on the Big Screen. Artificial intelligence (AI) is changing the way that videos, video games, and movies get made. It’s allowing creative types to focus more on the message as AI helps make the process of making the video or movie faster and more efficient. Let’s take a look:
(1) AI films look super-real. Epic Games’ Unreal Engine 5, once used just to create video games, is now being used to make short videos that look amazingly realistic. One user uploaded 1,500 pictures of an alley to Unreal Engine, and the software program turned it into a short video on YouTube. The user did the same thing with a castle, and this video switches back and forth between a real video of the castle and the Unreal Engines’ version of it. It’s very hard to see the difference.
RunwayML is another company that uses Gen-1, which harnesses AI to turn pictures into video or to dramatically change videos into whatever the creator desires. This video explains some of what Gen-1 can do.
(2) AI expedites film-making. AI is being used in many parts of the film creation process. ScriptBook analyzes film scripts to project movies’ potential box-office haul, predict audience demographics, and make recommendations to increase profitability, a March 6 article on Raindance.org stated.
AI can speed post-production tasks by automating color grading, visual effects, and sound design. Blackmagic Design’s DaVinci Resolve can automatically color-grade footage, remove unwanted objects, apply visual effects, and generate subtitles. ChatGPT can expedite marketing by quickly generating social media posts that promote the film.
(3) Gamers get in on the action too. Roblox is adding AI tools to lower the technical skills developers need to create games and allow them to create games more quickly, according to the company’s website. It’s also encouraging AI creators to put tools they’ve developed on Roblox. “[I]f you develop an AI model that builds the most expressive superhero characters based on a combination of text prompts, graphical queues, and photo examples, that capability is something you should be able to offer directly to those Roblox users who want an incredible superhero avatar. We envision the community as a force multiplier for generative AI, creating an ecosystem that our creators and users can leverage to create content and tools more effectively.”
Profit Margin Recession?
March 08 (Wednesday)
Check out the accompanying pdf and chart collection.
Executive Summary: Today, we examine S&P 500 companies’ revenues, earnings, and profit margins as reported for Q4-2022 and as estimated by industry analysts for 2023. Notably, Q4 revenues grew impressively to a record high, but inflation accounted for much of that. Operating earnings per share fell y/y, and just two S&P 500 sectors saw y/y earnings growth. Profit margins were squeezed by rising labor costs at a time of negative productivity growth. … While Q4 is behind us, its influence isn’t: It has caused analysts to chop earnings expectations for all four quarters of this year. Current 2024 estimates may prove too low if they reflect a recession that never arrives.
Earnings I: Season’s Greetings. The Q4-2022 earnings season is over. Joe reports that S&P 500 earnings data are out for the quarter. We weren’t surprised by the top-line or bottom-line numbers. That’s because we follow the weekly data series on forward revenues, forward earnings, and the forward profit margin. They continue to steer us in the right direction for assessing the near-term outlook for the comparable quarterly data (Fig. 1). (FYI: Forward revenues and earnings are the time-weighted average of analysts’ current and coming years’ consensus expectations, while forward profit margins are the imputed margins calculated from forward revenues and earnings.)
Consider the following:
(1) Revenues. There was no recession in S&P 500 revenues at the end of last year. The series was up 8.1% y/y to a record high (Fig. 2 and Fig. 3). S&P 500 forward revenues has been stalled at a record high since October, though it managed to edge up to a new record high during the February 2 week.
In aggregate (i.e., not on a per-share basis), S&P 500 revenues rose 6.9% y/y. Again, this isn’t surprising since nominal GDP increased 7.4% y/y during Q4 (Fig. 4 and Fig. 5). Over this period, real GDP rose 0.9% y/y, while the GDP deflator increased 6.4%. So inflation has been a major driver of revenues over the past year.
By the way, the 1.2ppt spread between S&P 500 revenues per share and aggregate revenues suggests that buybacks are not significantly boosting revenues per share and earnings per share. Indeed, the average spread between the two was only 0.1ppt per year on average since 2000 (Fig. 6).
(2) Earnings. The same goes for S&P 500 operating earnings per share and the comparable aggregate data series (using I/B/E/S data by Refinitiv). The average spread between the two was only 1.0ppt since 1995 (Fig. 7).
On a per-share basis, S&P 500 operating earnings fell 1.5% y/y during Q4 (Fig. 8 and Fig. 9). That’s the first negative reading since Q3-2020. It’s also down 8.1% from the record high during Q2-2022.
(3) Profit margin. With Q4 revenues rising to a record high and Q4 earnings down from its record high, the S&P 500 operating profit margin fell to 11.6% last quarter, down from a record high of 13.7% during Q2-2021 (Fig. 10 and Fig. 11). Economic recessions usually are the cause of margin squeezes, but that’s not the case this time. This time, the margin has been squeezed by rising labor costs as hourly compensation has risen rapidly, while productivity growth turned negative last year, as we discussed in Monday’s Morning Briefing.
In the past, companies typically would respond to labor-related margin squeezes by reducing their payrolls. That hasn’t been happening this time. Labor shortages have caused employers to hoard labor and post lots of help-wanted signs, even now.
(4) I/B/E/S vs S&P operating earnings. By the way, S&P and I/B/E/S each have their own polling services. S&P adheres to a stricter in-house definition of operating earnings, while I/B/E/S follows a consensus “majority rule” when deciding how to present a company’s consensus forecast. The industry analysts polled by I/B/E/S typically follow companies on an adjusted earnings basis (i.e., EBBS, or earnings excluding bad stuff), so I/B/E/S’s earnings series is higher than S&P’s earnings series.
We generally use the I/B/E/S data for quarterly operating earnings, especially because we use the data services’ measure of forward earnings. In our opinion, the stock market discounts majority-rule operating earnings over the coming 12 months.
During Q4, I/B/E/S’s operating EPS actual figure of $53.27 for the S&P 500 was 7.6% higher than S&P’s operating EPS of $49.51. That’s down from a recent peak difference of 23.6% during Q2-2022, when Berkshire Hathaway had a particularly large “mark to market” accounting loss that was not recognized by I/B/E/S. This accounts for a major part of the record-high $26.09 difference between S&P’s and I/B/E/S’s operating EPS actual for all of 2022’s quarters. Despite this, the percentage difference between the two remains below past cyclical peaks (Fig. 12 and Fig. 13).
(5) S&P 500 sectors’ revenues. Six of the S&P 500 sectors had revenues at a record high in Q4-2022: Communication Services, Consumer Discretionary, Financials, Health Care, Industrials, and Information Technology. Revenues rose y/y for all but the Consumer Staples sector, which posted its first decline since Q1-2019. However, the y/y revenue growth rate decelerated q/q for all but the Financials sector.
Here are Q4-2022’s y/y revenue growth rates for the S&P 500 and its sectors: Energy (18.7%), Utilities (17.9), Financials (15.9), Industrials (14.5), S&P 500 (8.1), Health Care (7.8), Consumer Discretionary (5.9), Communication Services (3.2), Information Technology (0.9), Materials (0.4), Consumer Staples (-0.3), and Real Estate (-0.5) (Fig. 14).
(6) S&P 500 sectors’ earnings. With respect to earnings, just two of the 11 sectors posted a y/y gain in earnings in Q4-2022, using I/B/E/S’s data. That’s down from five sectors doing so during Q3-2022 and is a marked turnaround from Q4-2021, when earnings rose y/y for all but Utilities.
These are the y/y operating earnings growth rates during Q4-2022 for the S&P 500 and its sectors, according to I/B/E/S and S&P: Energy (56.7% according to I/B/E/S, 49.8% according to S&P), Industrials (41.3, 40.2), Real Estate (-1.9, -30.0), Consumer Staples (-0.5, 5.6), S&P 500 (-1.5, -12.7), Utilities (-1.6, 10.5), Health Care (-3.3, -0.8), Information Technology (-8.3, -14.2), Financials (-12.5, -36.7), Materials (-17.2, -28.2), Consumer Discretionary (-18.6, -28.6), and Communication Services (-27.2, -31.3) (Fig. 15).
(7) S&P 500 sectors’ profit margins. Using the operating EPS from I/B/E/S, the quarterly profit margin improved q/q for three sectors: Consumer Staples, Industrials, and Information Technology. Among the remaining eight sectors with a weaker profit margin in Q4, only Consumer Discretionary managed to maintain a relatively high margin during the quarter, as most fell to their lowest levels in two years. The biggest laggards, Health Care and Utilities, saw their profit margins tumble to nine-year lows.
Here’s how the profit margin ranked for the sectors during Q4-2022: Real Estate (26.7%), Information Technology (24.3), Energy (12.8), Financials (12.7), Communication Services (12.1), S&P 500 (11.6), Materials (10.5), Industrials (9.7), Health Care (9.5), Utilities (7.9), Consumer Staples (7.3), and Consumer Discretionary (5.9) (Fig. 16).
(8) Write-offs. Write-offs tend to accelerate during the last quarter of the year as companies clear the deck of their past misguided business decisions. This is reflected in the reported EPS released by S&P, and the latest quarter was no different. S&P’s reported EPS of $172.24 for all of 2022 was 11.9% below its reported operating EPS of $196.09. While the write-off percentage is rising, for now it remains below the level during the Great Virus Crisis’ cyclical peak of 20% in 2020 and the 84% record during the Great Financial Crisis in 2008-09 (Fig. 17).
Earnings II: Looking Forward. The stock market looks forward, not backward. Joe and I reckon that investors discount the outlook for earnings over the coming 12 months. That implies that the Q4-2022 earnings results are largely irrelevant. In fact, they are very relevant to the extent that the reported results influence analysts’ expectations for earnings over the coming four quarters and the valuation multiples that investors are willing to pay for those earnings. Let’s review the latest relevant data:
(1) 2022. The Q4-2022 earnings results turned out to be about what analysts expected at the start of the earning season (Fig. 18). That’s actually bad news, since there is almost always an upside “earnings hook” in the charted data as quarterly results come out better than was expected. The exceptions to this trend tend to occur during recessions. So far, the widely expected recession is a no-show.
(2) 2023. Apparently, the actual Q4-2022 results and the guidance about 2023 provided during managements’ recent conference calls were bad enough to cause analysts to cut their earnings estimates for the four quarters of this year (Fig. 19).
(3) Forward earnings. As a result, 2023 earnings per share is now expected to be up just 1.3% to $222 from $219 during 2022 (Fig. 20). However, 2024’s earnings are expected to grow 12.0% to $248.
Forward earnings was $226 per share during the March 3 week. That’s down 5.7% from its record high during the June 23 week of last year.
Keep in mind that forward earnings will converge to the 2024 consensus forecast at the end of this year, which may continue to fall over the rest of this year but should remain above the current reading of forward earnings. At the end of this year, the stock market will be discounting next year’s consensus expectations.
We are thinking that there may not be much more downside to the 2024 estimate if it has already discounted a recession that continues to be a no-show.
Selected Sectors Short Studies
March 07 (Tuesday)
Check out the accompanying pdf and chart collection.
Executive Summary: Our base-case economic outlook is upbeat. Stock investors likewise seem optimistic about the economy given which S&P 500 sectors have led the index’s advance since October. We recommend overweighting five S&P 500 sectors this year: Energy, Financials, Industrials, Information Technology, and Materials. … Also: We zero in on the themes and data supporting two of these recommendations, Information Technology, which stands to benefit from companies spending on productivity-enhancing technologies in this tight labor market, and Industrials, which should benefit from strong spending on infrastructure construction, manufacturing capacity, and industrial machinery in a growing economy.
S&P 500 Sectors I: Leaders & Laggards. Joe and I believe that the latest bear market in stocks ended on October 12, 2022. We don’t expect the bear to make a comeback this year. We will be wrong about that if the economic releases in coming months support either the inflationary no-landing scenario or the hard-landing one, both of which are bearish. We will be right if the data support the soft-landing scenario or disinflationary no-landing scenario, both bullish. We are still assigning a 40% subjective probability to a soft landing and 20% each to the three alternatives.
The S&P 500 is up 13.1% since October 12, 2022 through Friday’s close, when it bounced off its 200-day moving average (dma) and closed above its 50-dma (Fig. 1). On Monday, it edged up 0.1%. Could this be the third major bear-market rally rather than the start of a new bull market? Could it be just another unsustainable short-covering rally? It could be. However, in our opinion, the S&P 500 sectors leading the latest advance are signaling that investors may be correctly turning more optimistic about the fundamental outlook for the US and global economies.
Here is the performance derby of the S&P 500 and its 11 sectors since October 12, 2022 through Friday’s close: Materials (23.3%), Industrials (21.9), Information Technology (19.6), Financials (18.7), Real Estate (14.1), S&P 500 (13.1), Communication Services (10.6), Energy (7.8), Consumer Staples (7.2), Utilities (7.2), Health Care (5.8), and Consumer Discretionary (3.6) (Table 1).
Our overweight recommendations for 2023 are Energy, Financials, Industrials, Information Technology, and Materials. They are consistent with our opinion that the US and global economies should continue to grow this year. Here is a scattershot of themes behind our picks:
Capital spending in the US will get a boost from onshoring and government spending on infrastructure and semiconductor plants. The S&P 500 Information Technology sector will also benefit from spending by many companies on productivity-enhancing technologies to solve their labor shortage problem. The proliferation of electric vehicles will increase the sales and earnings of companies in the Energy and Materials sectors. Artificial Intelligence, robotics, and automation will require many more data centers that also happen to require lots of electricity, supplied by both fossil and renewable sources of energy. The demand for cloud computing and data storage is likely to continue to grow rapidly. Spending on defense will also remain strong. The same can be said about spending on commercial aircraft. Financial intermediaries are well capitalized and have been increasing their reserves for loan losses in case of a recession. If it doesn’t happen, they will be able to reduce their reserves, thus boosting their earnings.
Let’s turn from this scattershot of themes to a closer look at two of our recommended sectors in the following sections.
S&P Sectors II: Not Your Father’s Tech Wreck. The S&P 500 Information Technology sector’s price index is up 19.6% since last year’s bear-market low. Leading the way have been the Semiconductors (47.0%), Semiconductor Equipment (40.4), and Application Software (20.8) industries (Table 1).
During the bear market, this sector’s price index fell 34.3%. It is currently still 21.4% below its record high on December 27, 2021 (Fig. 2). Its forward P/E fell from 28.7 on September 2, 2020 to 18.1 on October 12, 2022 (Fig. 3). The sector’s forward earnings peaked at a record high during the week of June 2 last year and fell 9.3% since then through the February 23 week. The sector’s forward revenues is down 3.4% over this same period, while its forward profit margin is down from a record high of 25.4% to 23.9% (Fig. 4).
Here is more on the sector:
(1) Revenues & earnings growth. Currently, industry analysts project that the sector’s revenues will be flat this year and grow 8.4% next year (Fig. 5). Earnings are expected to be down 3.1% this year and up 15.7% next year (Fig. 6).
(2) Tech Wrecks, now & then. Last year’s rout in technology stocks led a few bearish strategists to predict that it could turn out to be as awful as the Tech Wreck of the early 2000s. We didn’t agree. The forward P/E of the S&P 500 was 23.5 during February, down from December 2021’s peak of 28.1 (Fig. 7). Just prior to the Tech Wreck, the sector’s forward P/E exceeded 45.0. It eventually bottomed at 10.4 during November 2008. This time is also different because the current spread (5.9ppts) between the sector’s share of the S&P 500’s market capitalization (27.6%) and earnings share (21.7%) is well below the spread between the two at the height of the 1990s tech bubble in March 2000 (Fig. 8). Back then, the capitalization share peaked at 33.7%, while the earnings share was at 18.2%.
Back during the Tech Wreck, analysts’ consensus expectations for the sector’s long-term earnings growth rate (LTEG, over the next five years) peaked at a record 28.7%, boosting the LTEG of the S&P 500 to a record 18.7% (Fig. 9). That was unrealistic, to say the least. The S&P 500 can’t sustainably grow faster than nominal GDP (the source of revenues).
This time, LTEG peaked at the end of 2021 at 22.5% and 18.8% for the S&P 500 and its Tech sector. Both fell to about 11.0% at the end of last year, which still seems high but at least is more in line with expectations during market troughs, when analysts tend to be less exuberant.
(3) Mini Y2K. There is one similarity between the early 2000s Tech Wreck and the sector’s recent woes. The Tech Wreck was at least partly caused by the Y2K issue, which caused many companies to ramp up their spending on technology to fix their systems’ inability to handle the millennium date change before the new millennium began. So at the start of the 2000s, technology capital spending fell off a cliff.
This time, spending also dropped, but it was spending on technology by consumers that fell, after they purchased all the equipment and software they needed for their home offices during the pandemic.
(4) Forward earnings, now & then. We can see these developments in the forward earnings of the S&P 500 Information Technology sector and its major industries (Fig. 10 and Fig. 11). During the Tech Wreck, the sector’s forward earnings fell 61.4% from peak to trough, led by an over 100% fall in the Communications Equipment industry’s forward earnings to a loss.
This time, the sector’s forward earnings is down 9.3% so far from its record high during the June 2, 2022 week, led by declines of 32.1% and 17.5% in Semiconductors’ and Semiconductor Equipment’s forward earnings. This time, Communications Services’ forward earnings is still rising to new highs. The same can be said about Data Processing & Outsourced Services’ forward earnings.
(5) Semiconductor cycle. The worldwide sales of semiconductors tends to be very cyclical (Fig. 12). The figure falls sharply when the US economy is in a recession. It’s down sharply now by 20% from its record high of $620 billion (saar) during May 2022 to $496 billion at the start of this year. Industrial production of semiconductors is one of the areas hit by the economy’s rolling recession; the economy has yet to experience a widespread recession (Fig. 13).
The worst is likely over for the industry and for the stock price indexes of the S&P 500 Semiconductors and Semiconductor Equipment industries unless the US does fall into an official recession, which we don’t expect to happen (Fig. 14 and Fig. 15). Rolling recessions tend to be followed by recoveries rather than outright recessions, as we discussed in yesterday’s Morning Briefing.
(6) Relative performance. The S&P 500 Information Technology price index outperformed the broad S&P 500 index during the previous bull market (Fig. 16). The sector has been a market performer since the end of the pandemic lockdown. We expect it to outperform again as companies spend more on productivity-enhancing technologies.
S&P Sectors III: Industrials Outperforming. The 21.9% increase in the S&P 500 Industrials sector’s price index since October 12, 2020, has been led by Construction Machinery & Heavy Trucks (34.2%), Construction & Engineering (29.1), Airlines (27.6), Industrial Machinery (27.2), Industrial Conglomerates (25.6), Electrical Components & Equipment (22.2), Aerospace & Defense (20.7), and Air Freight & Logistics (20.5). These all will benefit from more capital and infrastructure spending, onshoring, better global economic growth, and more international travel.
Here is more on the sector:
(1) Relative performance. The S&P 500 Industrials price index was mostly a market performer in the recent years prior to the pandemic (Fig. 17). Its outperformance is a new development since the end of the previous bear market as investors are worrying less about an imminent recession and focusing more on long-term opportunities.
(2) Fundamentals. While US construction spending is likely to remain weak in the residential sector, the outlook for the nonresidential and public sectors is quite bright. Construction spending on commercial and manufacturing projects has been especially strong over the past 12 months through January, up 22.1% and 53.6%, respectively (Fig. 18). Orders for industrial machinery have been especially strong, more than doubling the past two years through January, while orders for construction equipment are up 25.9% y/y (Fig. 19).
(3) Forward metrics. The forward revenues of the S&P 500 Industrials sector has stalled at a record high over the past year but managed to edge up to a new record high during the February 23 week (Fig. 20). The sector’s forward earnings has also been stalled at a record high since mid-2022 (Fig. 21). The forward profit margin has edged down in recent weeks to 10.0%, which is still a relatively high reading for the sector (Fig. 22). There’s no recession going on in this highly cyclical sector.
The ‘Roaring 2020s’ Revisited
March 06 (Monday)
Check out the accompanying pdf and chart collection.
Executive Summary: Productivity was poor last year—declining more than it has since 1974—and growth in unit labor costs was high. But the final quarter of 2022 saw significant improvements in both, and we think the worst is over for both. If productivity continues to improve as companies increasingly solve their labor challenges with technological innovations, that should lead to lower inflation, higher real wages, and better profit margins. That’s the thesis of our “Roaring 2020s” outlook. … Also: The economy has been experiencing a rolling recession that started last year. Today, we examine rolling recessions, past and present. ... And: Dr. Ed reviews “The Whale” (+ + +).
YRI Weekly Webcast. Join Dr. Ed’s live webcast with Q&A on Mondays at 11 a.m. EST. You will receive an email with the link one hour before showtime. Replays of the weekly webcasts are available here.
US Inflation: Unit Labor Costs Peaking. The headline CPI inflation rate on a y/y basis closely tracks the comparable series for nonfarm business unit labor costs (ULC), which might have peaked during Q3-2022 (Fig. 1). The Bureau of Labor Statistics calculates ULC by dividing hourly compensation by productivity, both for the nonfarm business sector. On a y/y basis, productivity fell 1.8% through Q4-2022, the worst annual performance since 1974. Debbie and I think the worst is over, and better times are ahead for productivity, which augurs well for lower inflation, solid gains in real wages, and better profit margins.
Let’s have a closer look at the latest data and revisit our bullish outlook for the rest of the decade, which we still believe could turn out to be the “Roaring 2020s”:
(1) Labor market turnover. The aftershocks of the pandemic probably explain why productivity was so weak last year. During 2022, a record 50.5 million workers quit their jobs, i.e., nearly a third of payroll employment (Fig. 2)! Hires totaled 76.4 million, or nearly 50% of payroll employment (Fig. 3). Even though hires exceeded quits by 25.9 million, job openings averaged a near-record 11.0 million last year (Fig. 4).
All that labor market turnover must have weighed on productivity, as an unprecedented number of jobs went unfilled: Demand for labor exceeded the supply of labor by a record 5.3 million workers on average last year (Fig. 5 and Fig. 6).
(2) Productivity. Although last year’s productivity growth was the worst since 1974, it was mostly attributable to big declines during the first two quarters of 2022 and a weak third-quarter gain (Fig. 7). During Q4-2022, productivity rose 1.7% q/q (saar), a significant improvement over the prior three quarters’ readings. Debbie and I expect that productivity will continue to improve this year and over the rest of this decade assuming that our Roaring 2020s scenario works out. We believe that employers will solve their chronic labor shortage problem by spending more on productivity-enhancing technologies.
Over the past five years (60 months) through January, the average annual growth rate of the labor force was just 0.6% (Fig. 8). Over this same period, productivity grew faster—at a 1.5% average annual rate. We expect to see productivity growth rise to 3.0%-4.0% over the rest of the decade, comparable to the peak growth rates that occurred during the previous productivity booms in the US during the late 1950s, mid-1960s, and second half of the 1990s through the first half of the 2000s (Fig. 9).
(3) Hourly compensation. Hourly compensation is the broadest measure of labor compensation. It is also much more volatile than the other measures. In any case, it was up 4.9% q/q (saar) and 4.4% y/y during Q4-2022. It includes wages, salaries, and benefits for all workers, as well as imputed labor costs for proprietors. There are three measures of wages: average hourly earnings, wage growth tracker (WGT), and the wage & salary component of the employment cost index (ECI) (Fig. 10 and Fig. 11). The y/y inflation rates of all three peaked last year but they were still elevated at year-end.
Hourly compensation is a volatile series. A smoother measure of total compensation is the ECI, which includes wages, salaries, and benefits (Fig. 12). Both are available through Q4-2022. The ECI measure was up 5.1% y/y last quarter, while hourly compensation was up 4.4%. Both seemed to have peaked last year.
(For a comprehensive description of the alternative measures of wages and labor costs, see Appendix 4.1 from my 2018 book Predicting the Markets.)
(4) Unit labor costs. The good news is that while ULC was up 6.3% y/y last year, it was up only 3.2% q/q (saar) during Q4. That’s the slowest such pace since Q1-2021. The low ULC growth rate during Q4 reflects the fact that the 4.9% increase in hourly compensation was partially offset by the 1.7% increase in productivity.
As noted above, the CPI inflation rate closely tracks the ULC inflation rate, confirming that consumer price inflation is driven by inflation in the labor market. Again, both peaked last year but remain elevated. We expect to see both moving lower this year and next year.
(5) Labor market math. Fed Chair Jerome Powell has often said that monetary policy is aiming to reduce the demand for labor to cool off wages. He has yet to specify how low he would like to see wage inflation go. Let’s assume he believes that productivity growth is around 1.0%. We know that he and his colleagues are aiming to lower price inflation to 2.0%. This implies that the Fed is targeting 3.0% for wage inflation. That would leave workers with real wage gains of around 1.0%. That’s only going to happen if productivity grows 1.0%. We think it will grow faster than that, allowing for larger wage gains without adding to inflationary pressure on prices.
Interestingly, the trendline growth rate of real average hourly earnings for production and nonsupervisory workers (about 80% of payroll employment) has been 1.2% per year since 1995 (Fig. 13). Real AHE has been flat in record-high territory for the past year as prices rose as fast as wages. We think that the upward trend in real AHE might have started to resume late last year. That would be consistent with the improvement in productivity growth late last year.
(6) Labor market indicators. Debbie and I are monitoring several labor market indicators that closely track the y/y inflation rate in ECI wages and salaries in private industry. The quit rate leads this ECI inflation rate by about nine months, and it suggests that the latter will fall quite sharply in coming quarters (Fig. 14). The Atlanta Fed’s Sticky CPI inflation rate, which might have peaked late last year, tends to be a coincident indicator of the ECI wages and salaries inflation rate (Fig. 15). The monthly AHE and WGT inflation rates also seem to have peaked last summer (see Fig. 10 and Fig. 11, linked above).
One indicator suggesting that wage inflation will remain high is the “jobs plentiful” series from the monthly consumer confidence survey conducted by The Conference Board (Fig. 16). This series is also highly correlated with the JOLTS series for job openings and the NFIB series for small business with job openings (Fig. 17). All three of these measures of job openings peaked last year but remain high.
US Economy: A Brief History of Rolling Recessions. I’ve been asked more frequently recently to explain what I mean by a “rolling recession.” In my 2018 book Predicting the Markets: A Professional Autobiography, I discuss this concept. Here are some excerpts and subsequent writings:
(1) “There was a recession scare during 1986, which was mostly attributable to the plunge in oil prices during the second half of 1985 and the first half of 1986. Oil companies in Texas and other oil-producing states had responded to the OPEC oil spike by borrowing and expanding too much. The boom in the oil states, especially Texas, turned into a bust. I described it as a ‘rolling recession.’”
(2) “This time [in 1990], the rolling recession hit both residential and commercial real estate hard, while the overall national downturn was relatively short and shallow. That was my forecast after I thoroughly examined the nature of the thrift crisis and concluded that it would be relatively contained.”
(3) “Another rolling recession rolled through the oil industry from mid-2014 through early 2016 because of a freefall in the price of oil. Like the one during 1986, it did not spill over to other industries and the broader economy. My assessment at the time was that it wouldn’t, though a few other economists rang the recession alarm bells.”
(4) Last year, in the August 16 Morning Briefing, I wrote: “It’s possible that we might all collectively talk ourselves into a recession. It’s also possible that we are all hunkering down just enough that any recession will be mild since there won’t be too many excesses to worsen it. The downturn could be what we called a ‘rolling recession,’ during the mid-1980s for the US.” (See “Searching For Godot,” our August 22, 2022 Morning Briefing.)
Since then, I have written that the Index of Leading Economic Indicators “could be signaling a rolling recession that might not make it into the record books.” I also predicted: “So any recession that occurs is more likely to be a soft landing rather than a hard landing—i.e., a mild recession rather than a bad one. It could even be a ‘rolling recession’ hitting different sectors of the economy at different times, resulting in a shallow but protracted ‘growth recession.’”
(5) The latest rolling recession started in the single-family housing market early last year. Then industries that produce and distribute goods fell into a recession during H2-2022, as consumers—having binged out on buying goods during 2020 and 2021—pivoted to spending more on services. The tech industry was hit with recession too; tech companies hired too many workers during the pandemic when their sales were booming; now those companies are paring their payrolls, as sales have slowed. And the office real estate market is in an outright depression now that so many workers are working from home.
Movie. “The Whale (+ + +) (link) is an outstanding film with an outstanding cast of characters played by outstanding actors. Charlie, played by Brendan Fraser, suffers from obesity that started when his partner died, causing him to eat obsessively to deal with the pain. The result is that his health is poor, he can barely walk, and he never leaves his apartment. He works from home as an English professor who teaches online college writing courses. Charlie works on reconnecting with his estranged teenage daughter during most of the film. The novel Moby Dick is mentioned several times as a lesson in what not to do in life.
Consumer Discretionary, Utilities & AI Fake Voice
March 02 (Thursday)
Check out the accompanying pdf and chart collection.
Executive Summary: Retailers are wary about the effects of high inflation and rising interest rates on consumers’ discretionary spending. But Target this year stands to benefit from easier y/y comparisons and shoppers looking for alternatives to its rapidly shrinking competitor Bed, Bath & Beyond. Jackie examines. … Also: Will demand for electricity outstrip available supply over coming years with retiring fossil-fuel-powered electricity generation replaced by less reliable green alternatives? That’s what one transmission organization projects. . … And: With voice-cloning software readily available, its potential nefarious (as well as silly) uses may spark new opportunities in identity authentication.
Consumer Discretionary: Caution Prevails. The words “caution” and “uncertainty” were sprinkled throughout Target’s fiscal Q4 (ended January) earnings conference call on Tuesday. Rapidly “rising prices have put pressure on discretionary spending as consumers make room for higher prices on necessities. In addition, higher interest rates have further pressured budgets by increasing the cost of mortgages and car loans,” warned CFO Michael Fiddelke.
Target is responding by taking a “cautious stance on inventory commitments” in fiscal 2023 (ending January 2024), presumably not wanting a repeat of last year when the retailer had to slash prices to move excess inventory. Target ended Q4 with total inventory down 3% y/y and inventory in discretionary categories 13% lower y/y.
While Target’s revenue increased 2.8% to $109 billion in fiscal 2022, discounting to move excess inventory and higher expenses sent adjusted earnings per share tumbling to $6.02, less than half the $13.56 per share the company earned in fiscal 2021.
This year, Target will benefit from both easier y/y comparisons and the woes of competitor Bed Bath & Beyond. Let’s take a deeper look:
(1) Fewer discounts, cheaper shipping. Year-over-year earnings comparisons should be much easier this year if Target’s trimmed inventory position matches demand, eliminating the need for margin-killing sales that dented fiscal 2022 profits. In addition, “unusually high” freight and transportation costs last year should come down in 2023.
Headwinds continue to include inventory shrink, soft sales in the company’s highest-margin discretionary categories, and potentially increased promotional intensity across the industry, said Fiddelke. Target’s operating margin fell from 8.4% in fiscal 2021 to 3.5% last year, and it’s expected to rise to 4.0%-5.0% in Q1-2023 and 6.0% in fiscal 2024.
(2) Benefitting from Bed Bath & Beyond? What wasn’t discussed on the company’s earnings call was the potential benefit Target and other similar retailers will enjoy from Bed Bath & Beyond’s restructuring. The company pushed off a widely expected bankruptcy filing earlier this year by selling shares, but it still has closed or plans to close more than 200 of its namesake stores, five Buybuy Baby stores, and its entire chain of roughly 50 Harmon drugstores, a January 27 WSJ article reported. So the shuttered stores’ former customers will be looking for a new place to shop, and Target carries similar merchandise.
(3) Cautious guidance. Reflecting its caution, Target management offered earnings guidance wide enough to drive a truck through. Comparable-store sales for both fiscal Q1 (ending April) and fiscal 2023 are expected to range from a low-single-digit decline to a low-single-digit increase. And management’s new fiscal 2023 earnings-per-share guidance of $7.75-$8.75 fell short of analysts’ $9.23 consensus estimate, according to a February 28 CNBC article. Yet Q4 earnings per share of $1.89 beat analysts’ expectations of $1.40.
Target shares rose 1.0% on Tuesday to $168.50 but gave back their gains and then some on Wednesday after Lowe’s and Kohl’s reported disappointing fiscal Q4 (ended January) sales. Both retailers echoed Target’s concern about the strength of discretionary consumer spending in the current inflationary environment. Target shares are up 13.1% ytd through Tuesday’s close but still down on a y/y basis, by 15.7%, and 36.7% off their November 16, 2021 high of $266.39.
(4) Industry stats. Target is a member of the S&P 500 General Merchandise Stores industry along with Dollar General and Dollar Tree. The industry’s stock price index has fallen 25.3% from its April 20, 2022 peak but is 197.3% higher than its July 10, 2017 low (Fig. 1). The industry’s revenue is expected to inch higher, by 3.7%, this year and 3.8% in 2024 (Fig. 2). After hitting a peak of 6.6% early last year, the forward profit margin has fallen sharply to 4.8% (Fig. 3). But it is expected to stabilize, helping earnings to improve from a 32.8% decline last year to a 31.4% jump this year and more moderate 17.3% growth in 2024 (Fig. 4). The industry’s forward P/E is 18.1, not far from its recent peak of 21.9 during the May 6, 2021 week (Fig. 5).
Utilities: More Electricity Needed. PJM Interconnection warned in a recent report that the move to renewable energy and the mothballing of coal- and gas-powered electric plants could leave its region without enough electricity to meet demand within the next five years under certain scenarios. PJM is a regional electric transmission organization that coordinates the movement of wholesale electricity in all or parts of 13 states and Washington, DC. It does not own any transmission or generating assets. In the February 24 report, PJM calls on the regions it serves to “correct imbalances brought on by retirements or load growth by incentivizing investment in new or expanded resources.”
To put numbers to the problem, PJM’s region of operation has 192.3 GW of installed electricity-generating capacity—most from coal- and gas-powered plants (178.9 GW) and the rest from windmills, solar panels, and battery storage (13.3 GW). By 2030, PJM expects 40 GW of the current capacity to be retired at a time when electricity demand is expected to be 11-13 GW higher. Expected new electricity capacity of only 15-31 GW won’t come close to filling this 51-53 GW hole. And most of that new capacity (8-17 GW) comes from wind and solar power, which presents reliability problems due to its intermittency.
The bottom line: The excess electricity generation capacity in PJM’s territory is set to shrink from roughly 22%-25% this year to 3%-12% by 2030. Under certain scenarios, in just three years, PJM may not have enough capacity to meet projected peak demand without reducing usage (asking folks to turn down their air conditioning, etc.). And by 2028, even doing that may not be sufficient at times of peak demand.
Here are some of the report’s other highlights:
(1) Too many plants closing. The expected plant retirements between now and 2030 represent 21% of the installed capacity in PJM’s territory, and the pace is on par with that of the past decade. Most of the 47.2 GW of generation retired from 2012-22 represented coal-fired plants. PJM expects future retirements to reflect announced planned retirements (12 GW), retirements due to state and federal policies (25 GW), and deteriorating unit economics (3 GW).
The PJM report lists several government policies that it expects will prompt future plant closures. One is a 2021 EPA rule that ends the disposal of coal ash—which contains pollutants including mercury, cadmium, and arsenic—in unlined landfills and grows more restrictive through the end of this year. Another is the EPA Good Neighbor Rule, which requires plants to invest in new equipment to comply with its limitations on nitrogen oxide emissions; PJM believes plants generating a total of 4.4 GW of electricity will opt to close instead. Certain state rules—e.g., in Illinois and New Jersey—and green commitments by energy companies themselves could also contribute to capacity retirements.
(2) Not enough new capacity. PJM lays out a conservative estimate (15.1 GW) of new capacity that could come online by the end of the decade and a more optimistic estimate (30.6 GW).
Of the new generation coming online, by far the most, 94%, is expected to come from renewable sources and 6% from new natural-gas-fired plants. That expectation reflects recent years’ declines in the amount of electricity generated by new gas plants (8 GW during 2019-22 versus 23 GW during 2015-18) as well as fear of continued volatility in natural gas prices (a price spike in 1H-2022, owing to the US’s large war-related export volumes, has largely reversed since). After 2024, PJM assumes that no new coal or gas fired plants will come online.
The increased dependency on renewable energy is problematic due to its intermittency—i.e., wind and solar power doesn’t generate electricity as steadily as coal- and gas-fired plants. As a result, PJM believes it will need multiple megawatts of solar and wind generated electricity to replace 1 MW of electricity generated by coal or natural gas fired plants. In addition, only about 5% of renewable-energy projects typically reaches completion; so current proposals representing 290 GW of capacity suggest that only 14.5 GW may ever come online.
(3) Demand keeps rising. The study assumes demand grows 1.4% annually on average in the PJM footprint over the next decade. But regions with a large concentration of data centers—like Loudon County, VA—may experience annual demand growth as high as 7%.
(4) Reserve margin shrinking. PJM adds together the generation capacity coming offline, the capacity coming online, and demand growth when calculating capacity in excess of expected demand to arrive at a reserve margin. Excess capacity should shrink from roughly 22%-25% this year to 3%-12% by 2030. However, the estimates change based on assumptions about capacity additions, deletions, and demand requirements.
Some factors that could change the dour picture painted by the report include: 1) As capacity tightens, the market may self-correct. In a tight market, electricity prices could rise, encouraging producers to bring more electricity generation online more quickly than expected. 2) The Inflation Reduction Act incentives might spur creation of new wind and solar generation, which the report didn’t discuss. Conversely, 3) new supply could be less than anticipated if semiconductor or other supply-chain disruptions occur, if labor gets tougher to come by, or if getting the land for projects is an impediment.
(5) Electric utilities stats. The S&P 500 Electric Utilities stock price index had an impressive 76.7% run from its March 23, 2020 low to its recent high on September 12, 2022 (Fig. 6). Since the high, the index has fallen 16.4% and is down 9.5% ytd. Revenue growth in the industry is expected to be lackluster: 0.9% in 2022, -3.7% in 2023, and 2.0% next year (Fig. 7). While earnings growth is forecast to pick up from only 1.6% in 2022, to 9.7% this year and 8.5% in 2024 (Fig. 8). The industry’s forward P/E has climbed from a low of 9.4 in 2009 to a high of 21.9 during the April 7, 2022 week, only to fall back slightly to a recent 17.6 (Fig. 9).
Disruptive Technology: AI Copies Your Voice. We’ve written about artificial intelligence (AI) programs that can draw or make a video (see our November 3 Morning Briefing). And we’ve discussed ChatGPT’s wizardly ability to write an answer to just about any question as well as its potential for evil (January 19 Morning Briefing and February 9 Morning Briefing). This week, we came across AI programs that can imitate anyone’s voice and be used to say anything; they used voices ranging from Ariana Grande to Donald Trump in clips that appeared on Twitter and TikTok.
The examples we came across were harmless and often pretty funny, but nonetheless could theoretically be problematic for anyone trying to enforce copyrights or spot deep fakes. It’s also easy to imagine how these programs could be used for evil purposes and spur the development of a whole industry dedicated to the authentication of people and videos. Let’s take a look:
(1) Making Ariana sing. DiffSVC (or sometimes “Diff-SVC”) is an open-source software program that learns the characteristics of a voice and then uses that voice to sing/say other audio. “SVC” stands for “singing voice conversion,” and the software reportedly was developed by researchers at the Human-Computer Communications Laboratory at the Chinese University of Hong Kong and the Tencent AI Lab, according to a website.
Examples of DiffSVC’s output have appeared recently on Twitter: Ariana Grande, Ava Max, and Lady Gaga are singing songs in videos that they have never sung, a January 27 article in Maldita.es reported. One post has Ariana Grande’s voice singing “Prisoner,” a song first recorded by Miley Cyrus and Dua Lipa. Another recording uses Ava Max’s voice singing “Flowers” originally recorded by Miley Cyrus.
A Twitter user harnessed the DiffSVC program to make the “Flowers” video, the Maldita article reported. And while the creator of the “Prisoner” video, Marc C. (no last name given), didn’t tell Maldita.es which AI program he used, a February 24 article in The Information cited a Marc who claimed he used DiffSVC to create the video. Marc did tell Maldita that it took him “a couple of hours” to collect data on Ariana’s voice using isolated voice tracks from YouTube. “Once that data was collected, a friend helped me train the model, which took me about four days,” Marc C. explained. After that, the AI program can use the voice to “sing” almost anything.
(2) Making presidents play video games. Ever wonder what Presidents Biden, Trump, and Obama would say if they all sat down together to play “Fortnight” or “Call of Duty”? Someone did and created videos on TikTok that use copies of the presidents’ voices. While it’s unknown which software program was used to generate the voices, the author of a February 22 article in Dexerto speculates that it might be software from Murf.AI.
The company describes itself as an AI voice generator capable of voice creation or cloning. Murf.AI provides voices that customers can pair with animation or other visuals to create engaging e-learning programs, advertisements, explainer videos or presentations, podcasts, and the like.
On Valuation & Central Banks
March 01 (Wednesday)
Check out the accompanying pdf and chart collection.
Executive Summary: Today, we look at valuations for various investment style indexes. Notably, the S&P 400 MidCaps and S&P 600 SmallCaps—a.k.a. SMidCaps—haven’t been this cheap versus the S&P 500 LargeCaps since 2000. Growth and Value indexes underwent major shifts when the MegaCap-8 stocks were redistributed among them in December. Global markets have been outperforming the US MSCI. They’re collectively still cheap relative to the US. But we wouldn’t stray too far from home for long … And: The underlying structural issues keeping inflation aloft will be solved by market forces, not with monetary policy. … Also: The ECB has been tightening, but perhaps not enough yet.
ChatGPT: Good Sense of Humor. Melissa asked ChatGPT (Chatgee) the following: “Tell me a bear joke in the style of Ed Yardeni.” The AI algorithm came back with the following:
“Sure, I’ll give it a shot! Why did the bear invest in the stock market? To become a bull, of course! Chatgee added, “Okay, maybe that was a bit of a ‘bearish’ attempt at a joke. But in all seriousness, it’s important to remember that investing always involves some degree of risk. As investors, we need to stay informed and be prepared for market fluctuations, regardless of whether we’re feeling bullish or bearish.”
Now that’s truly freaky!
Valuation: What’s in Style? Yesterday, Joe and I reviewed the latest developments in valuation multiples for the S&P 500. Today, let’s drill down to the valuation stats for various investment styles. Consider the following:
(1) LargeCaps vs SMidCaps. The S&P 400 MidCaps and S&P 600 SmallCaps underperformed the S&P 500 during 2021 but outperformed during the bear market of 2022 (Fig. 1 and Fig. 2). The forward revenues of all three indexes rose to new highs around mid-2022, but have stayed near their record highs since then (Fig. 3). The same can be said about forward earnings, though they’ve been weaker than forward revenues since mid-2022 because forward profit margins have been narrowing (Fig. 4 and Fig. 5).
The forward P/Es of the SMidCaps peaked at the start of 2021 and continued to fall through the end of last year’s bear market (Fig. 6). Over this period, they fell from around 20.0 to 11.0. Since the end of the bear market, they’ve rebounded to about 14.0. The decline of the S&P 500’s forward P/E was less severe than for the SMidCaps during 2021 because it was boosted by the high multiples of the MegaCap-8. But the latter took it on the chin during the bear market of 2022, falling from a forward P/E of roughly 34 to 22. Over the same period, the S&P 500’s forward P/E dropped from 22 to 15.
By the way, the SMidCaps haven’t been this cheap relative to the S&P 500 LargeCaps since 1999 and 2000 (Fig. 7).
(2) Growth vs Value. The MegaCap-8 stocks also have had significant impacts on the S&P 500 Growth and Value stock price indexes, their fundamentals, and their relative valuations. The most recent event was the rebalancing of these two indexes by Standard & Poor’s last December. Before that, all of the MegaCap-8 stocks resided in the Growth index; the rebalancing moved some of the weightings for half of them into the Value Index.
As a result, the market-cap share of the MegaCap-8 in the Growth index dropped from 41.4% during the December 15 week to 36.8% during the December 22 week (Fig. 8). It bounced back to 40.9% during the February 16 week.
The rebalancing along with the bull run since October 12 also boosted the forward P/E of Value from 13.2 on October 12 to 16.5 on February 27 (Fig. 9). The ratio of the Growth P/E to the Value P/E dropped from a high of 1.88 in late 2021 (just before the bear market) to 1.16 on February 27.
(3) Stay Home vs Go Global. The underperformance of the MegaCap-8 during last year’s bear market weighed on the Stay Home investment strategy versus the Go Global one (Fig. 10). Significant rebounds in the MSCI stock price indexes for Europe and Emerging Markets (led by China) also explain why Go Global has outperformed its alternative. We doubt that there is much more potential in this trade and would aim to be overweighting the US again in global stock portfolios by mid-year.
Then again, the rest of the world is still very cheap relative to the US. During the February 16 week, the US MSCI forward P/E was 18.8, while the All Country World (ACW) ex-US was 12.8 (Fig. 11). In the past, the ACW ex-US forward P/E closely tracked (but slightly exceeded) the forward P/E of S&P 500 Value index (Fig. 12). But again, the December 19 rebalancing boosted Value’s forward P/E relative to the one for the ACW ex-US.
Central Banks I: What the Fed Can’t Fix. Fed officials continue to say that they are “not done yet” bringing inflation down; they have “more to do.” Yet some of them have been acknowledging that there are certain structural issues that monetary policy can’t fix supporting today’s elevated levels of inflation. Inflation may be a monetary phenomenon, but it isn’t exclusively determined by monetary policy. A recognition of what drives inflation might explain why Fed officials aim to get the PCED inflation rate down to their 2.0% target by 2025 rather than sooner, as they could by causing a recession. That’s according to the FOMC’s December Summary of Economic Projections.
In our opinion, market forces will fix some of the structural drivers of inflation over time. The Fed’s New York President John Williams seems to agree with us. In a February 14 speech, he said: “I expect PCE inflation to [move] closer to our 2 percent longer-run goal in the next few years.”
In remarks on Monday, Fed Governor Philip Jefferson said: “I’m under no illusion that it’s going to be easy to get the inflation rate back down to 2%.” He added: “I am committed to doing what it takes.”
Now consider the following:
(1) Supply chains’ disruption. “The Federal Reserve obviously can’t fix problems like supply chain issues,” the Philadelphia Federal Reserve Bank’s (FRB) President Patrick Harker said in a February 14 speech. People “care a lot more about what I have to say recently,” he added, because he is a voter on the FOMC this year.
Non-voting FOMC participant Loretta Mester observed in a February 16 speech that supply-chain disruptions have “improved but not uniformly across sectors and products.” Mester added: “Our business contacts tell us that transportation bottlenecks and delivery times have improved compared to last year but that certain products, including computer chips and electric generators, remain difficult to source.”
Indeed, the New York FRB’s Global Supply Chain Pressure Index fell during 2022, but it remains above its pre-pandemic level (Fig. 13). Williams, a permanent FOMC voter as the New York FRB president, pointed to this index in his February 14 speech, observing that “further improvement in global supply-chain disruptions has stalled.”
(2) US labor shortage. “Endemic” and “structural” are the ways that Harker and Mester, respectively, have described the problem of worker shortages. The ongoing tightness in the labor market continues to put upward pressure on inflation, Fed Governor Michelle Bowman, a permanent FOMC voter, told American bankers during a February 13 speech.
“The number of job openings moved down somewhat over the past year, but there are still 1.9 openings per unemployed worker,” Mester observed. She noted that a lower level of participation reflects the high level of retirements during the pandemic, reduced immigration, changes in preferences, and the difficulty of finding affordable childcare. “Today, the labor market remains extremely tight,” Williams noted.
(3) Russia’s war on Ukraine. “I expect that we will continue to be surprised by … geopolitical developments,” suggested Bowman. “Russia’s continuing war in Ukraine adds uncertainty to the inflation picture, particularly for food and energy prices,” Mester warned.
Because of skyrocketing inflation for agricultural chemicals last year, such as fertilizer, “farmers have been dealing with sharply rising input costs, and that is a significant factor driving up wholesale and retail prices for many food products,” voting Fed Governor Christopher Waller said in a February 8 speech to an agricultural audience. He added: “the price level of agricultural chemicals remains very high.”
We observe that higher agricultural prices reflect not only supply-chain shortages during the pandemic but also Russia’s war on Ukraine because Russia historically has been an important producer of the chemicals necessary to make fertilizers (see our May 18, 2022 Morning Briefing). Futures prices for soybeans, corn, and wheat have moderated in recent weeks but remain above pre-war levels.
(4) China’s reopening. “On the one hand, the reopening of China is helping to ease supply chain disruptions. But China is also a major world economy and increasing demand there will put upward pressure on commodity prices,” Mester pointed out. Indeed, commodity futures prices for metals surely have been affected by China’s reopening.
Central Banks II: What the ECB Wants. Since July, the European Central Bank (ECB) has raised interest rates by three percentage points, from -0.50% to 2.50%. Yesterday—the same day that its Chief Economist Philip Lane said that the ECB has started to win the inflation fight—Eurostat released data on France and Spain that unexpectedly signaled otherwise.
More than likely, the ECB will again raise interest rates by another 50 basis points in March to 3.0%. What comes next is not as clear, but the latest inflation data make more restriction more likely. Markets have priced in 150 basis points of rate hikes by the end of the year, which could lift the ECB’s deposit rate to 4.0%.
Here’s more:
(1) Eurozone’s price signals. French consumer prices rose 7.0% y/y during February, the highest rate since the 7.1% record high last November and October, driven by accelerated price increases in food and services. Spanish consumer prices rose 5.9% y/y during February despite the government’s efforts to temporarily cut taxes on food in January (Fig. 14 and Fig. 15).
February inflation data for the combined Eurozone is due out on Thursday. Mild winter temperatures in Europe pushed Eurozone inflation down to 8.6% y/y in January from a record 10.6% in October. But the latest data from France and Spain could indicate inflation may not slow for the combined group to the ECB’s 2.0% target anytime soon. Data from Germany is due to be released today (Wednesday). Tuesday’s data sent the yield on Germany’s two-year bond up to the highest level since mid-October 2008, at 3.13% (Fig. 16).
(2) Lane’s rate signals. Lane told Reuters in an interview on Tuesday: “[T]here’s significant evidence that monetary policy is kicking in.” Yet he said there is still a strong case for another 50bps interest-rate increase at the ECB’s next meeting. Rates could remain restrictive for “quite a long-lasting period, a fair number of quarters,” Lane added.
Lane suggested that the ECB is looking for more progress in slowing inflation for goods, services, energy, and food. Lane further suggested that the ECB’s three-year inflation forecasts would need to be lower before the bankers would consider a less restrictive monetary policy posture. Lower oil and gas prices, supply-chain troubles easing, and the ECB’s influence all could weigh on inflation eventually, Lane indicated.
The Inflation & Valuation Questions
February 28 (Tuesday)
Check out the accompanying pdf and chart collection.
Executive Summary: Are stock valuations too high for our inflationary times? Admittedly, last year’s bear market didn’t maul valuations as severely as most do. But inflation has been moderating in a host of areas, which we expect to continue. And if the economy sticks to the rolling-recession script, as we think it will, stocks aren’t overvalued but fairly valued, in our opinion. … Also: For more perspective on the valuation question, we look at various valuation models’ current readings in their historical context, including a valuation model that takes inflation into account.
Weekly Webcast. If you missed Monday’s live webcast, you can view a replay here.
Valuation I: Transitory Versus Persistent Inflation. In his famous December 5, 1996 speech, then-Fed Chair Alan Greenspan raised the valuation issue when he asked, “But how do we know when irrational exuberance has unduly escalated asset values, which then become subject to unexpected and prolonged contractions ... ?”
That sounded like he was concerned about a bubble in the stock market. However, he was just asking the question, not answering it. He was thinking out loud, essentially. Indeed, right before posing the question, he suggested that stocks were not irrationally exuberant given that “sustained low inflation implies less uncertainty about the future, and lower risk premiums imply higher prices of stocks and other earning assets.”
Today, we face a similar valuation question. However, this time the question is whether valuations are too lofty given that inflation is much more troublesome now than it was during the second half of the 1990s. Some of the latest inflationary pressures are turning out to be transitory, especially for consumer durable goods. Others are more persistent, especially for services and wages. Consider the following:
(1) Demand and supply shocks. In response to the pandemic, excessively stimulative fiscal and monetary policies in the US boosted demand, which caused a supply shock, thus boosting inflation over the last two years. Most of the demand shock occurred for goods since services activity was still curtailed by social restrictions. The PCED for consumer durable goods jumped from 1.4% y/y at the end of 2020 to peak at 10.6% during February 2022. It was down to 1.1% during January of this year (Fig. 1).
The PCED for nondurable goods (including food and energy) rose from -1.0% at the end of 2020 to peak at 13.2% during June 2022. It was down to 7.0% during January (Fig. 2).
We expect food and energy prices to remain elevated, sending the y/y inflation rate for nondurable goods falling toward zero over the remainder of this year. We also expect that the PCED for durable goods will fall into slightly negative territory in coming months, as the CPI for durable goods already has done.
(2) Rent. As a result of the pandemic, the demand for single-family homes soared. Rising mortgage rates clobbered affordability for first-time homebuyers, forcing them to rent (Fig. 3). So rent inflation soared from about 2.0% y/y in early 2021 to around 8.0% in both the CPI and during January of this year (Fig. 4). Rising mortgage rates also reduced the supply of homes. Since many homes have been financed at record-low mortgage rates in recent years, more would-be sellers than usual chose to stay put instead of sell and be subject to higher rates on their new home.
But rent inflation on newly signed leases has plunged since the middle of last year as more newly built apartments have become available and renters have resisted spending so much of their incomes on rent (Fig. 5). (See the February 27 WSJ article “Apartment Rents Fall as Crush of New Supply Hits Market. Declines signal tenants may be maxed out on how much income they can devote to rent.”)
(3) Labor market. Following the pandemic, labor turnover has been high as more workers quit their jobs for better paying ones, driving up wage inflation (Fig. 6). Employers may be starting to resist paying ever higher wages when their productivity has been depressed by high quits. They are likely to spend more of their money on productivity-enhancing technologies that augment the productivity of their workforce so they can afford to pay workers more.
(4) Geopolitics. The invasion of Ukraine by Russian President Vladimir Putin’s army on February 24, 2022 exacerbated the global inflationary outlook by driving up grain, crude oil, and natural gas prices. However, these commodity prices have been coming down in recent months as high prices stimulated the production of more supplies.
(5) Bottom line. As Joe and I discuss in the next section, valuation models mostly show that stocks did not get as cheap in last year’s bear market as they did during previous bear markets. That assumes, as we do, that the latest bear market ended on October 12, 2022.
Bearish strategists believe that the bear market isn’t over and that it won’t end until valuation multiples are much lower. During 2022, they mostly argued that the Fed’s tightening would cause a hard landing, which would put more downward pressure on both earnings and the valuation of those earnings. Now they are saying that even though recent data suggest a no-landing scenario, that’s still bearish. That’s because they expect that Fed officials will conclude that they must continue to raise interest rates to cause a recession as the only way to bring inflation down.
As Debbie and I observed before, an inflationary no-landing scenario is the long way to a hard landing, and bearish for stocks. That’s not our most likely scenario. We continue to see a rolling recession with inflation continuing to moderate. If that proves to be the case, then stocks are fairly valued, in our opinion.
Valuation II: Rounding Up the Usual Suspects. Now let’s review the latest valuation metrics. Joe and I don’t have a favorite one. They all have advantages and disadvantages. So we try to get an overall sense of valuation by looking at all of them. Here goes:
(1) Trailing versus forward P/Es. We are not fans of P/Es based on trailing earnings. We prefer P/Es based on forward earnings because investors tend to look forward, not backward, when they value stocks. They determine the valuation of the consensus S&P 500 forward operating earnings per share of industry analysts over the coming 12 months, in our opinion. The downside of forward earnings is that industry analysts collectively don’t anticipate the occurrence and duration of recessions.
The P/E based on four-quarter trailing earnings per share is available since 1935 (Fig. 7). It has averaged 15.5 since then. It was 19.6 at the end of last year, well above the average.
During February of this year, the forward P/E of the S&P 500 rose to 18.5 (Fig. 8). That’s relatively high, though it is down from the January 2021 peak of 22.6. This series is also available weekly.
(2) PEG ratios. We also monitor the S&P 500’s ratio of the forward P/E to the consensus analysts’ forecast of long-term earnings growth (LTEG), i.e., over the next three to five years (Fig. 9). Both the forward P/E and LTEG have declined since 2021, causing the PEG ratio to jump to 1.8 in mid-February (Fig. 10). This is a high reading, suggesting that the P/E is still too high relative to the diminished prospects for LTEG.
Then again, during the pandemic years of 2020 and 2021, both the P/E and LTEG were unsustainably high. The LTEG peaked at a record high of 23.9 during the February 4 week of 2021. Now it is back down to 10.0, which is a more normal reading for LTEG. Analysts certainly have an optimistic bias, since every economist knows that overall earnings can’t grow faster than nominal GDP.
(3) Buffett ratios. One of the most alarming valuation metrics before the latest bear market was the Buffett Ratio showing the market cap of all US equities (excluding foreign issues) divided by nominal GNP (Fig. 11). Another similar ratio is the market cap of the S&P 500 divided by S&P 500 revenues. Both are quarterly series and track each other very closely. Both peaked just below 2.0 during 2000 just before the tech bubble burst, triggering significant bear markets in the S&P 500 and the Nasdaq, led by plunging tech stock prices. During H2-2001, both ratios were in record-high territory at 2.77 and 2.79, respectively.
Joe and I found that the weekly price-to-sales ratio (P/S)—i.e., the S&P 500’s stock price index divided by its forward revenues—tracks the quarterly P/S ratio very closely. (“Forward revenues” is the time-weighted average of analysts’ consensus revenues estimates for this year and next.) The weekly P/S series was at 2.88 during the December 30, 2021 week, well above the 2.00 peak on the quarterly P/S ratio hit during Q4-1999 (Fig. 12). In mid-February, it was still high at 2.29.
(4) MegaCap-8. Some of the apparent overvaluation of the S&P 500 is attributable to the MegaCap-8 stocks, which remain relatively expensive. The collective forward P/E of the MegaCap-8 is down to 25.0 from a record-high 38.5 during the August 28, 2020 week (Fig. 13). Their collective forward P/S is 4.5 currently, down from a record-high 7.2 during the November 19, 2021 week (Fig. 14).
The S&P 500’s forward P/E with and without these eight stocks is 18.5 and 17.0. The index’s forward P/S with and without them is 2.3 and 2.0.
Valuation III: Adjusting for Inflation. The valuation multiples discussed above are variations of mean-reverting models of valuation. They don’t reflect the impact of inflation and interest rates on valuation.
One way to study the relationship between the valuation multiple and inflation is to subtract the annual CPI inflation rate from the nominal earnings yield (i.e., the reciprocal of the P/E based on S&P 500 quarterly reported earnings) to calculate the real earnings yield of the S&P 500 (Fig. 15 and Fig. 16). The data start in 1935.
The real earnings yield is an eye-opener. Since WWII, there have been 12 bear markets in the S&P 500. The real earnings yield coincidently turned negative during nine of those bear markets. With the benefit of hindsight, we can see that the real earnings yield turned negative during Q3-2021, raising a caution flag about a possible bear market. It was still negative during Q4-2022 at -3.08%.
March Madness?
February 27 (Monday)
Check out the accompanying pdf and chart collection.
Executive Summary: The stock market beat a hasty retreat in February, spooked by reports of January’s economic strength and the Fed’s dreaded possible reaction. So today we look at what March’s releases of economic data for February might bring. They could be bad news for the markets, but we actually expect the best—viewing January’s strength as anomalous and expecting February’s data to confirm our soft-landing outlook. Accordingly, we still think a new bull market was born last October; it’s just not bursting out of the gate as most bulls do. The market may remain volatile pending more clarity on what the Fed will do. … Also: Dr. Ed’s bearish review of “Cocaine Bear” (-).
YRI Weekly Webcast. Join Dr. Ed’s live webcast with Q&A on Mondays at 11 a.m. EST. You will receive an email with the link one hour before showtime. Replays of the weekly webcasts are available here.
Strategy I: A Market of Stocks. The S&P 500 was up 16.9% from last year’s low of 3577.03 on October 12, 2022 through this year’s high of 4179.76 on February 2 (Fig. 1). Joe and I still view last year’s low as the end of the bear market that started on January 3, 2022. We believe that the rally since then is the start of a new bull market, though we expect it to be U-shaped rather than V-shaped like the start of most previous bull markets. We also expect that it will be more volatile than most, at least until it’s clear that the Fed’s current monetary tightening cycle is over. Here are a few more of our thoughts on the market:
(1) February’s selloff. The S&P 500 is down 5.0% from its February 2 high through Friday’s close of 3970.04. It closed just below its 50-day moving average. It could easily test its 200-day moving average, which was 3938.42 on Friday. If so, it should find support at last year’s closing low of 3839.50. That would wipe out January’s impressive 6.2% gain which was fueled by visions of a soft economic landing, Fed pausing, and conversations with friendly AI versions of HAL 9000 computers. February’s selloff through Friday’s close was triggered by the release of January’s stronger-than-expected economic indicators. The equity put/call ratio rose from a recent low of 0.49 on February 2 to 0.82 on Friday (Fig. 2).
(2) Risk on and off. The market’s risk-off sentiment was also reflected in the performance derby of the S&P 500’s sectors from February 2 through February 24: Consumer Staples (-1.5%), Energy (-2.3), Financials (-2.7), Industrials (-3.2), Health Care (-3.5), Utilities (-4.3), Materials (-4.5), Information Technology (-4.9), S&P 500 (-5.0), Consumer Discretionary (-8.0), Real Estate (-8.9), and Communication Services (-12.5) (Table 1).
Despite February’s selloff, it has been a risk-on market since October 12 through February 24: Materials (18.6%), Industrials (18.1), Financials (17.7), Information Technology (16.2), Real Estate (12.4), S&P 500 (11.0), Utilities (7.9), Consumer Staples (7.7), Communication Services (7.1), Health Care (5.2), Energy (4.7), and Consumer Discretionary (1.9) (Table 2).
Consumer Discretionary has been the big underperformer. However, several consumer services-providing industries were at the top of the leader board since October 12: Casinos & Gaming (50.4%), Advertising (38.3), Hotels, Resorts & Cruise Lines (32.5), Airlines (22.9), and Movies & Entertainment (20.6).
(3) Sector picks. Our recommended S&P 500 sector over-weights this year are Energy, Financials, Industrials, Materials, and Information Technology. We would also overweight the S&P 400 MidCaps and S&P 600 SmallCaps.
(4) Feshbach’s market call. Here is Joe Feshbach’s latest trading call: “The market correction is going according to plan. The good news is that sentiment is starting to move in the right direction, i.e., more bearish. I still recommend patience before reestablishing a bullish posture as the shift to fear needs some more time to evolve.” He adds, “The market just needs a little more time because optimism got way overdone. Premature rallies would draw out the corrective process. Continued weakness without rallies would be a much better scenario.” Thanks, Joe. In other words, fear is good!
Strategy II: Investing by the Numbers. At the end of last year, the consensus view was that the economy was on the verge of a hard landing. So it was widely expected that the bear market in stocks would resume during the first half of this year and that the S&P 500 soon would test and possibly fall below its October 12 low. January’s 6.2% rally in the index was widely attributed to a rapidly growing consensus that a soft landing was increasingly likely. In this scenario, the Fed was expected to hike the federal funds rate by 25bps at both the March and May meetings of the FOMC and then pause, with a possibility of rate cuts later this year or early next year.
Sentiment changed again in February. It turned more bearish as a slew of strong January economic indicators and hot inflation stats heightened fears of an inflationary no-landing scenario that would force Fed officials to conclude that the only way to bring inflation down is to continue raising interest rates until they cause a recession. As we’ve observed before, an inflationary no-landing scenario is simply the long way to a hard landing.
We expect that the slew of economic indicators and inflation numbers to be released in March with February’s data will be weaker and cooler than January’s batch. We attribute quite a bit of January’s strength to anomalies—mild winter weather and possibly faulty seasonal adjustment factors.
But if instead the data released during March confirm the worst-case inflationary no-landing scenario, the resulting March madness could send the 10-year Treasury bond yield above its most recent high of 4.25% on October 24 and the S&P 500 tumbling toward its bear-market low of 3577.03 on October 12. That’s not our forecast, but it is our concern.
Let’s consider what might lie ahead:
(1) Purchasing managers. The madness starts on Wednesday, March 1 with the release of February’s M-PMI. It is likely to uptick from 47.4 during January but remain below 50.0. That’s based on the flash M-PMI estimate for February compiled by S&P Global (Fig. 3). It is also based on the small uptick this month in the average of the three regional composite business activity indexes compiled by the New York, Philadelphia, and Kansas City Federal Reserve banks (Fig. 4).
The weakness in these measures of industrial activity during both January and February suggests that the 1.0% m/m increase in factory output and 1.2% increase in aggregate hours worked in manufacturing during January might have been partially reversed during February (Fig. 5).
(2) Labor market. February’s ADP private payrolls report will be out on Wednesday, March 8. On Friday, March 10, the Bureau of Labor Statistics (BLS) employment report will be released. January’s JOLTS report will be released on March 8.
In a November 30, 2022 speech titled “Inflation and the Labor Force,” Fed Chair Jerome Powell indicated that he and his colleagues are aiming to reduce the demand for labor (defined as employment plus job openings) relative to the supply of labor (defined as the labor force). During December, the former exceeded the latter by 5.3 million workers (Fig. 6).
Therefore, January’s strong payroll employment report was not good news for the Fed or for investors in stocks and bonds. Private payrolls rose 443,000 according to BLS, while ADP reported an increase of only 106,000. When February’s BLS data are released, Debbie and I will be focused on this number as well as any revisions to the previous two months.
January’s JOLTS report is likely to show an uptick in job openings since this series closely tracks the National Federation of Independent Business series for “small business with job openings” and The Conference Board “jobs plentiful” series (Fig. 7 and Fig. 8). Both ticked up in January.
(3) Retail sales. February’s retail sales report will come out on March 15. Retail sales was up 3.0% m/m during January. Debbie and I aren’t convinced that January’s strength is sustainable. Adjusted for inflation, it was up 2.4% m/m but flat versus a year ago (Fig. 9). Core real retail sales, excluding building materials and food services, rose 1.1% m/m and fell 3.5% y/y.
In current dollars, retail sales of motor vehicles and parts jumped 5.9% m/m (but only 2.8% y/y) during January (Fig. 10). This series has been moving sideways in a volatile fashion for the past two years. January’s mild winter weather might have boosted auto sales as well as sales at food services & drinking places, which jumped 7.2% m/m (and 25.2% y/y!) during January (Fig. 11). February’s unit auto sales data will be released on Friday, March 3.
(4) Inflation. While January's m/m CPI and PCED inflation rates were hotter than expected, the y/y inflation rates are still disinflating overall (Fig. 12). The inflation rate for PCED goods clearly peaked last year at 10.6% during June. It was down to 4.7% during January. PCED services inflation has yet to peak, rising to 5.7% during January. It typically lags the goods inflation rate. We are expecting it will peak around mid-year.
February’s CPI will be coming out on March 14. The month’s PCED will be released along with personal income at the end of the month, on March 31.
Fed Chair Jerome Powell at his February 1 press conference said: “And it’s most welcome to be able to say that we are now in disinflation ... But we just see that it has to spread through the economy and that it’s going to take some time.”
(5) Fed’s March madness. The next meeting of the FOMC is scheduled for March 21-22. Fed officials constantly remind us that their policymaking is “data dependent.” It may be more so than ever at their upcoming meeting, since the outlook for the federal funds rate will depend on the next batch of economic data, which may determine whether we are heading for a soft or hard landing.
The FOMC will also release the latest quarterly Summary of Economic Projections. We will all be looking to see whether they change their previously projected path for the federal funds rate from 5.1% this year, 4.1% in 2024, and 3.1% in 2025. Of course, the clearest indication of how much the data influence their thinking will be whether they vote to raise the federal funds rate by 25bps or 50bps.
Movie. “Cocaine Bear” (-) (link) isn’t a must-see movie. My wife and I expected a comedy based on true events. So we couldn’t understand why all the trailers were for horror flicks. The movie was funny in some parts, but it was mostly grisly as the coke-snorting grizzly bear ripped off the limbs of various goofy characters. By the way, my favorite story about a bear was told by Dolly Parton to Jimmy Fallon. It’s a must-hear for sure.
On Earnings & Fuel Efficiency
February 23 (Thursday)
Check out the accompanying pdf and chart collection.
Executive Summary: For the S&P 500 index and many of its sectors, forward revenues are at record highs but forward earnings are below their record highs of last year. The disparity indicates a profit-margin squeeze, with several labor-cost-related sources; those stemming from pandemic aftereffects should abate in time. ... And: The fuel efficiency of automobiles has been climbing—with more miles traveled on fewer tanks of gasoline. Increasing use of electric vehicles may be driving this trend. Jackie collects the evidence from two places where EV adoption is ahead of the curve, California and Norway. It’s a nascent trend worth watching given the ramifications for global oil demand.
Strategy: Sector Earnings. Yesterday, Joe and I reviewed the latest data on S&P 500 forward earnings. Today, we examine the latest forward data for the 11 sectors of the S&P 500. (FYI: “Forward” earnings, revenues, and profit margins are data series we calculate from industry analysts’ consensus estimates for this year and next, time-weighting these estimates such that as a year goes on, months that have passed drop out of the calculation and the forward estimate converges toward the analysts’ consensus for the following year, finally matching it at year-end. We impute the forward margin series from their earnings and revenue estimates.)
As we noted yesterday, forward revenues for the S&P 500 remained in record-high territory during the February 16 week. So did forward revenues for several of the index’s sectors.
We also observed that S&P 500 forward earnings is down 5.7% from its record high during the week of June 16, 2022. Several of the sectors’ forward earnings are also down since then. That’s because profit margins have been getting squeezed—in all but the Energy sector, to some degree—as a result of rising unit labor costs, reflecting increasing wages and weakening productivity. We are expecting these cost increases to moderate to the extent that they were boosted by the aftereffects of the pandemic.
Let’s look at the latest data:
(1) S&P 500 forward revenues. Over the past 26 weeks though the week of February 16, here is the performance derby showing how much forward revenues grew or contracted for the S&P 500 and its 11 sectors: Utilities (4.6%), Financials (4.1), Consumer Staples (3.9), Health Care (3.8), Communication Services (1.4), Industrials (1.2), S&P 500 (0.7), Real Estate (-0.4), Consumer Discretionary (-1.0), Materials (-1.4), Information Technology (-2.5), and Energy (-7.4) (Fig. 1).
(2) S&P 500 forward earnings. Now let’s do the same analysis for forward earnings: Utilities (3.5%), Consumer Staples (2.6), Financials (0.0), Industrials (-1.7), S&P 500 (-4.2), Communication Services (-4.9), Consumer Discretionary (-5.5), Health Care (-5.5), Information Technology (-5.6), Energy (-6.8), Real Estate (-7.7), and Materials (-15.0) (Fig. 2).
(3) S&P 500 forward profit margin. Now let’s compare the sectors’ forward profit margins during the week of February 16 to those of 26 weeks ago (on August 18): Information Technology (23.8%, 24.6%), Financials (17.7, 18.4), Real Estate (17.0, 18.3), Communication Services (14.3, 15.3), Utilities (13.8, 13.9), S&P 500 (12.4, 13.0), Energy (12.3, 12.2), Materials (11.1, 12.9), Industrials (10.0, 10.3), Health Care (9.7, 10.6), Consumer Discretionary (7.1, 7.4), and Consumer Staples (7.1, 7.2) (Fig. 3).
(For tables showing the forward earnings and revenues data for the S&P 500 sectors along with 100+ industries, see our Performance Derby: S&P 500 Sectors & Industries Forward Earnings & Revenues. Similar tables with forward profit margins are available at Performance Derby: S&P 500 Sectors & Industries Forward Profit Margin.)
Energy I: US Still Pumping. US crude oil field production rose to 12.3 million barrels a day (mbd) during the February 10 week, the highest since April 2020 though still below the record high of 13.1mbd during the week of March 13, 2020 (Fig. 4). During the February 10 week, petroleum products supplied, which is a measure of demand, was 19.8mbd, while net imports of petroleum products was -0.5mbd. That implies that domestic production was 20.4mbd, exceeding domestic demand by 0.5mbd (Fig. 5). (Note that production is equal to crude oil field output plus natural gas liquids.)
The US is even more energy independent when it comes to natural gas. During October, the US imported 237 trillion cubic feet (tcf) of natural gas and exported 554tcf (Fig. 6).
Energy II: Auto Efficiency on a Roll. Auto efficiency is undergoing a renaissance, and that could have large implications for oil demand.
Even though Americans have been driving a near-record number of miles, US gasoline consumption has fallen sharply. Vehicle miles driven was 3.26 million in November, based on the 12-month sum, not far from the February 2020 peak of 3.28 million. Yet gasoline usage has fallen to 8.67 million barrels per day (mbd), down 4.5% from a recent peak of 9.08mbd at the start of April 2022 and down 7.1% from 2019 consumption peak of 9.33mbd (Fig. 7). Put another way, US drivers are using as much gas today as they were in mid-2020, yet we’re driving 7.5% more miles each day.
That alone attests to the fact that vehicle energy efficiency has improved. But for a sense of how greatly, consider data from the US Department of Energy, which reports that vehicle fuel efficiency has jumped to a new all-time high of 24.2 miles per gallon (mpg) as of November, up from 22.8mpg in December 2019 and 21.3mpg in December 2010 (Fig. 8).
For perspective, the last time gasoline consumption dropped this sharply was in 2020. But that decline was an anomaly, reflecting fewer miles driven during Covid shelter-in-place mandates. Both miles driven and gasoline consumed snapped right back—though not entirely—when the US economy recovered. A situation more analogous to today’s occurred in 2011, when gasoline usage dropped sharply AND vehicle miles traveled slowly increased. That year, the price of gasoline jumped, and more small, fuel-efficient cars were sold in 2011 and 2012. US gasoline fuel efficiency rose from 21.2mpg in 2011 to 22.4mpg by 2012. But over the next decade, major improvements in fuel efficiency stalled.
The gas price jumps of early 2022 and tax incentives encouraging the purchase of electric vehicles (EVs) presumably catalyzed the recent surge in fuel efficiency. The price of gasoline futures soared from the 2020 Covid lows of 41 cents per gallon to a 2022 peak of $4.28 per gallon, only to fall back recently to $2.42 per gallon (Fig. 9). Now that gas prices have settled back to more reasonable levels, we’ll be watching to see whether fuel efficiency plateaus or keeps climbing—which may depend on whether EVs gain traction.
With that in mind, we decided to examine how the widespread adoption of EVs in California and Norway has affected gasoline consumption. Their experience may foretell where gasoline usage in rest of the world is headed, albeit at a slower speed:
(1) EVs in the Golden State. California has adopted EVs more aggressively than any other state in the nation. In 2022, EVs represented almost 16% of new light-duty vehicle sales in the state, a February 10 article in Smart Cities Drive reported. Add in plug-in hybrid vehicles, and the number rises to 18%. That’s far above the 6% average for the nation, as EV adoption is encouraged by California’s high fuel costs and tax incentives. The state has also banned the sale of new light duty gasoline-fueled cars produced starting with the 2035 model year.
There are early indications that Californians’ EV adoption may be lessening demand for gasoline. Net taxable gasoline (including for aviation) sold in California fell most years since peaking in fiscal 2018 (ending June), dropping almost linearly: 2018 (15.6 billion gallons), 2019 (15.3 billion), 2020 (14.0 billion), 2021 (13.1 billion), 2022 (13.9 billion), according to the California Department of Tax and Fee Administration.
The US Energy Information Administration (EIA) tracks prime supplier sales of motor gasoline. Its data show 2021 sales in California were 16% lower than the state’s 2015-19 average—greater than the comparable declines in Texas (6%), New York (8), and the US as a whole (5). (The EIA defines a prime supplier as “a firm that produces, imports, or transports any of the surveyed petroleum products across state boundaries and local marketing areas and sells the product to local distributors, local retailers, or end users.”)
After adjusting for states’ population changes, the EIA determined that prime supplier gasoline sales per capita in 2021 were 15% lower in California compared to its 2015-19 average, exceeding the declines of 10% in Texas, 9% in New York, and 2% in North Carolina. Likewise, prime gasoline sales per 1,000 vehicle miles traveled in 2021 were notably below the 2015-19 average in some states, with California topping the list: California (-10%), Texas (-9), New York (-1), and North Carolina (2).
California’s marked decline in gasoline usage could reflect Covid-19 impacts, e.g., more people may continue to work from home in liberal-leaning states like California and New York. So we’ll continue to monitor the data to confirm whether EV uptake is driving California’s reductions in gasoline demand.
(2) EVs in the Land of the Midnight Sun. Norway has successfully encouraged its population to go green with a batch of tax incentives. Last year, 79.3% of new cars purchased there were battery EVs (BEVs), up from 64.5% in 2021, reported the Norwegian Electric Car Association. In addition, 8.5% of new cars sold in 2022 were plug-in electric vehicles (PEVs), which means that only 12.2% of cars sold in Norway last year ran exclusively on gasoline or diesel. As a result, Norway is close to achieving its goal of having all new cars sold be powered by electricity or hydrogen by 2025.
That said, it will take a while for Norway’s fleet of cars on the road to be entirely electric. Currently, BEVs represent 20.9% of passenger cars on Norway’s roads.
The percentage of EVs sold could decline this year because tax incentives won’t be as juicy. January’s auto sales dropped to less than 5% of December’s volume, as purchases were pulled forward in anticipation of the tax changes. The percentage of BEVs slumped to 66.5% of new cars sold, and plug-in hybrids represented 9.8% of car sales in January, reported CleanTechnica on February 3.
Norway’s enthusiastic adoption of EVs appears to be impacting gasoline demand. BP estimates that Norway’s consumption of oil fell from 221,000bpd in 2018 to 199,000bpd in 2021 (the latest data available).
BP’s recently published 2023 Energy Outlook projects that the large role oil plays in the global economy will continue but diminish. How quickly that drop occurs will depend on how rapidly the world’s drivers purchase EVs. BP estimates that global oil demand, which fell from its 2019 peak of 97.7mbd to 94.1mbd in 2021, will continue to decline to the 85-97mbd range in 2030 and 70-93mbd in 2035.
The US EIA isn’t as sanguine. It estimates that world consumption of petroleum and other liquids peaked at 100.9mbd in 2019, fell to a Covid low of 91.6mbd in 2020, resumed climbing to a projected 99.4mbd in 2022, and is bound for 100.5mbd in 2023 and 102.3 in 2024.
Car manufacturers are taking the move to EVs in Norway seriously. Norway is the first country into which Hyundai stopped selling gasoline-only fueled cars, in 2020, and the company pulled the plug on plug-in hybrids as of year-end 2022. Volvo plans to stop selling gasoline-fueled cars in Norway at some point this year. And VW has said it will sell only EVs starting in 2024, a December 30 Electrek article reported. The trend may extend throughout the EU, which plans to ban the sale of new gas and diesel cars in 2035.
On US Earnings & India’s Economy
February 22 (Wednesday)
Check out the accompanying pdf and chart collection.
Executive Summary: This earnings season stands out from most, and not in a good way: Hearing managements discuss their companies’ Q4 results on conference calls has sent analysts back to their spreadsheets. Consensus earnings estimates for all four quarters of this year have been falling. … Looking at valuations in the context of falling estimates suggests that the S&P 500 isn’t cheap after its runup since October. SMidCaps and overseas stocks are cheaper. ... Also: India aims to usurp China as the go-to nation for outsourcing, hoping to shed its “developing” status and become a global trade leader. But first, it may need to clean up its act.
Weekly Webcast. If you missed yesterday’s live webcast, you can view a replay here.
Strategy I: Earnings Hooks & Upticks. The Q4 earnings season is almost over now that retailers are reporting their results. Since the first week of January through the February 16 week, the S&P 500’s Q4 earnings forecast fell 0.5% from what was expected by industry analysts to what was reported (Fig. 1). Often when the economy has been growing in the past, the charted data series showed “earnings hooks,” as the actual results turned out to be better than the expected ones. That did not happen during the latest earnings season.
The forward guidance that managements provided to industry analysts during companies’ latest earnings reporting conference calls was negative on balance. We can see that from the steady declines in consensus earnings estimates for each of the four quarters of this year that occurred during the latest earnings season (Fig. 2). The only sign of life was the small upticks during the latest week for the Q3 and Q4 estimates.
The annual consensus S&P 500 operating earnings-per-share estimates for 2023 and 2024 stopped falling during the February 16 week at $222.85 and $249.42 (Fig. 3). Earnings per share was $218.16 in 2022. So the expected 2023 and 2024 growth rates are now 0.3% and 11.8% (Fig. 4). These expectations for earnings are consistent with the scenario for the economy that we most expect, involving a soft landing this year and a recovery next year.
Strategy II: Thinking Forward. S&P 500 forward earnings edged up to $226.43 during the February 16 week. This is the time-weighted average of analysts’ consensus expectations for 2023 and 2024 earnings. The time weighting is such that the series gradually converges toward the 2024 estimate throughout this year, and by year-end it is identical to the 2024 estimate. The stock market discounts forward earnings, in our opinion. The recent 16.8% rally in the S&P 500 from the October 12 low (3577.03) through the February 2 high (4179.76) seemed to reflect investors’ focus leaping over all the concerns about the economy and earnings this year to the bullish expectations for next year. Consider the following:
(1) Forward fundamentals. S&P 500 forward revenues remains close to a record high as of the February 16 week (Fig. 5). During that same week, forward earnings edged up from the lowest reading since the January 27, 2022 week. It is down 5.7% from its record high during the June 16 week of 2022. As a result, the forward profit margin has dropped from a record high of 13.4% during the June 9 week of 2022 to 12.4% during the February 16 week.
(2) Forward valuation. During the rally since October 12, 2022, the S&P 500’s forward P/E and forward P/S (price-to-sales) ratios rose. The forward P/E was at 18.5 as of February 17 (Fig. 6). Excluding the MegaCap-8 stocks (with a collective forward P/E of 25.8), the forward P/E was 17.0. The forward P/S was up to 2.3 as of February 17 (Fig. 7). It was 2.0 excluding the MegaCap-8 (with a forward P/S of 4.6).
At such valuations, stocks aren’t cheap unless investors are willing to fully discount analysts’ consensus expected 2024 earnings per share of $249. Even so, that would put the S&P 500 forward P/E at 16.8 (based on the recent high of 4179).
Current forward valuation multiples are more attractive for S&P 400 MidCaps (14.4) and S&P 600 SmallCaps (14.0) (Fig. 8). S&P 500 Value had been a good value at 13.0 on September 30, 2022. But the index was rebalanced to include some share of the MegaCap-8 at the end of last year and now trades around 16.9 (Fig. 9). On a relative valuation basis, the MSCI All Country World (currently at 12.8) looks especially cheap.
India I: Growth Story. India’s economy is poised to outpace most other major world economies over the next decade. It’s been “remarkably resilient to the deteriorating external environment,” according to the World Bank. Indeed, India’s investment story is gaining appeal for geopolitical reasons: Many Western companies are starting to regard the friendly democracy as an outsourcing alternative to China. That’s a narrative India promotes, as it’s positioning itself to become the premier bridge between the East and West. The nation sent so many emissaries to the 2023 World Economic Forum, CNN reported, that one investor described the main road leading to Davos as “Little India.”
However, India’s growth story is not perfect. The nation continues to face high unemployment and inflation despite its impressive post-pandemic growth recovery. India’s growth story has been described as “K shaped,” with legs going both up and down, because small businesses are struggling while large prosperous companies drive domestic growth. Additionally, income inequality is worsening, and the increasing concentration of wealth and power at the top has fostered cronyism and corruption.
But global investors have been attracted to India’s size, young and growing population, and democratic political system. Last quarter, India’s Sensex index traded at the highest in a decade versus the S&P 500. Indian MSCI equities have soared since hitting a pandemic low during 2020 and are now trading at historically elevated multiples (Fig. 10).
Here’s more on economic conditions in India:
(1) Outperforming output. “India is expected to be the world’s fastest growing major economy [in 2023],” predicts the World Bank (see Global Economic Prospects Table 1.1). India’s real GDP growth is projected at 6.6% next fiscal year (ending March 31, 2024) compared to 0.5% for the US and 4.3% for China—but that’s a slowdown for India from the 6.9% projected this fiscal year and 8.7% last year. For the latest quarter of available data, India’s real GDP grew 6.7% y/y, outpacing the US (1.0%), China (2.9%), and Japan (0.6%) (Fig. 11). As a recent government survey put it, the Indian economy “has nearly recouped what was lost, renewed what had paused, and re-energized what had slowed during the pandemic and since the conflict in Europe.”
Looking ahead, Bloomberg Economics sees India’s GDP growth peaking at 8.5% in the next decade. At the current trajectory, India could become the world’s third-largest economy (with GDP of $10 trillion) by 2035, up from fifth largest ($3.5 trillion) currently, according to the Centre for Economics and Business Research.
(2) Populating working age. India’s population growth is expected to surpass China’s this year. Currently, over 900 million Indian people are of working age, a cohort that could reach more than 1 billion over the next decade (Fig. 12). India’s workforce is known to be entrepreneurial, digitally literate, and English speaking.
Unlike other Indian economic indicators, which are healthy, unemployment is elevated. Nearly 37 million workers looked for work in December, the most since June 2021 at the height of the pandemic, reported Reuters. Urban unemployment hit 10.1% in December (Fig. 13). That’s up from 6.0%-7.0% before the Covid lockdowns.
Part of the problem is a skills mismatch: Much of India’s young workforce is highly educated and looking for white-collar jobs, while the growing manufacturing sector is looking for low-skilled workers. Small businesses, which employ the majority of workers, were battered during the pandemic, as a 2020 NYT article discussed.
(3) Banking on inflation. Like other central banks around the world, the Reserve Bank of India (RBI) reversed its pandemic-induced ultra-loose monetary policy when Russia’s war on Ukraine worsened inflationary pressures. More recently, the bank has indicated that borrowing costs are likely to remain higher for longer.
On February 8, India’s central bank raised its policy rate by 25 basis points to 6.50% (Fig. 14). It was the sixth and smallest increase since May 2022, when the rate stood at 4.0%, observed Barron’s. The bank’s governor Shaktikanta Das kept the door open for further tightening, saying in a webcast that while consumer inflation declined in November and December 2022, core inflation “remains sticky.”
India’s consumer inflation rate hit 6.5% during January (Fig. 15). A recent government survey said it’s projected to reach 6.8% this fiscal year and said that level is neither so high that it would deter consumption nor so low that it would weaken investment, even though it’s above the central bank’s 2.0%-6.0% target range.
(4) Optimistic consumers. Despite current inflationary pressures, consumer optimism over India’s economic situation, employment, and income for the next year has improved sharply, the RBI’s consumer confidence survey has shown (Fig. 16). Future expectations hit a two-year high in January, and the current situation index also increased. Around 83% of survey respondents expects inflation to moderate over the next year, while more than half expects improvement in the general economic situation and employment conditions.
(5) Battling inequality. Many consumers are optimistic, but surely not all. “If we do not take care of inequality, we can’t get very far with growth,” said former RBI governor Duvvuri Subbarao in January, according to Bloomberg.
Since 1995, India’s wealth gap between the top 1% and bottom 50% has increased about three times more than the equivalent metric for the US. As of fiscal 2022/23, the wealth of India’s billionaires accounted for nearly 30% of GDP, wrote Fortune India. However, while inequality has increased along with India’s growth over the past several decades, the poverty level has decreased.
(6) Capitalizing cronies. Still, the concentration of wealth has fostered corruption in the nation. The allegations against the powerful and well connected Adani Group reported by the National Review are a prime example. Whether they’re true or not, the story highlights how a businessperson’s close relationship with India’s Prime Minister could make it easier to cross ethical lines and get away with it.
India II: Modi's Moment. In an August speech, Prime Minister Narendra Modi told his nation to settle for nothing less than to “dominate the world,” reported the January 22 Bloomberg article linked above. Once dubbed “Ronald Reagan on a white horse,” Modi’s goal for India is to achieve developed nation status within the next 25 years. He is planning reforms with an eye toward promoting India’s economic growth and geopolitical position.
Modi’s united majority party has a better chance of leading India to growth than any prior government over the past three decades—all of which had coalitions of disparate political parties—according to Reform Nation author Gautam Chikermane. “The conviction of Narendra Modi is fast trickling down to governments and business,” he said in the book.
Consider the following:
(1) Made in India. Modi’s government has succeeded at implementing infrastructure projects on scale and at speed. Nearly 20% of the country’s budget this year is directed at capital investments, the most in a decade, wrote Bloomberg in the January 22 article linked above.
Modi’s “Made in India” campaign aims for manufacturing to contribute 25% of domestic GDP. The ratio rose to 17.4% in 2020 from 15.3% in 2000, according to McKinsey data, reported Bloomberg.
Over the next few years, the government is providing more than $24 billion in incentives in more than a dozen industries to compete with China. Some will support the production of mobile phones, semiconductors, and solar panels. “In the coming decade, manufacturing productivity has the potential to rise by about 7.5 percent per year, contributing to more than one-fifth of the incremental GDP in our estimates,” McKinsey wrote in a comprehensive 2020 report.
(2) Seven Indian priorities. Earlier this month, Finance Minister Nirmala Sitharaman underscored the government’s seven highest priorities in fiscal 2023/24: inclusive development, reaching the last mile, infrastructure and investments, unleashing potential, green growth, youth power, and the financial sector, according to The Financial Express. The public-sector investments are anticipated to have an output-multiplier effect. New tax regimes proposed should leave more disposable income in the hands of the people.
(3) Sustainable green sweep. At the forefront of India’s capital investments are green technologies. Pollution is a major problem in India’s urban areas, and the government wants to make Indian cities more sustainable.
India has committed to reach net-zero emissions by 2070, with renewables accounting for 50% of the country’s energy by 2030, reported CNN in the article linked above. Soon, the government’s incentive program will be extended to manufacturers of electrolyzers and other equipment needed to make green hydrogen.
(By the way, the National Review article linked above observes that Adani Group energy corporations stand to benefit from Modi’s green-energy pledges.)
(4) Biden Boom coming. Earlier this month, US Commerce Secretary Gina Raimondo told CNBC that the US is looking to collaborate with India on manufacturing jobs to boost competition against China. Raimondo will visit India in March with US CEOs to discuss an alliance on manufacturing semiconductor chips. Biden’s August CHIPS and Science Act supplies $52 billion for US companies to invest in chip manufacturing.
The constructive business investment sentiment between the two countries is mutual. Air India recently signed a mega-deal to purchase 200 American-made aircraft from Boeing. Upon announcing the deal, Biden affirmed that he was looking forward to deepening US ties with India and with Modi.
(5) Culture of corruption will no longer do. In return for inclusion in a 13-country Indo-Pacific framework, the US wants India to promise to abide by certain labor, environmental, anti-corruption, and rule-of-law standards. That’s necessary to unlock US business and capital flowing to India. So India will need to break with its past—when nepotism and cronyism at the top of government flourished—and check corruption at the door if it aspires to become a global market leader.
Four Landing Scenarios
February 21 (Tuesday)
Check out the accompanying pdf and chart collection.
Executive Summary: What’s next for the US economy? Of four potential outlooks, we see the greatest odds (40%) of a soft landing in which inflation moderates, the Treasury bond remains below last year’s peak, and the S&P 500 ends the year at a new high. We also see two no-landing possibilities—one disinflationary, one inflationary (20% each)—and a possible hard landing (20%). The first two scenarios would be optimistic for the economy and bullish for stocks, the last two negative and bearish. … Also: We examine data supporting the relatively new no-landing scenarios as well as the latest inflation data. … And: Dr. Ed reviews “Vikings: Valhalla: Season 2” (+ + +).
YRI Weekly Webcast. Join Dr. Ed’s live webcast with Q&A Tuesday morning at 11 a.m. EST. You will receive an email with the link one hour before showtime. Replays of the weekly webcasts are available here.
US Economy I: Take Your Pick. Debbie and I think we coined “rolling recession” back in the mid-1980s to describe the economic slowdown that many feared would turn into an economy-wide recession. We think the phrase accurately describes the performance of the US economy since early last year. It’s similar to a “growth recession,” “mid-cycle slowdown,” and “soft landing” but includes the concept that different areas of the economy are experiencing the slowdowns at different times.
We think we were among the first to raise the possibility of the “no landing” scenario for this year. Here is what we wrote in the January 9, 2023 Morning Briefing about this now possible scenario: “There will be no landing for the economy this year. Instead, real GDP will grow by 2.0% or more. Inflation will moderate without a recession down to 3%-4% based on the PCED measure of consumer prices. By the end of this year, it will be closer to the bottom end of this range.”
Nevertheless, the soft-landing scenario remained our most likely outlook. Then came January’s strong batch of economic indicators during the first two weeks of February. In our February 6 Morning Briefing, we wrote: “Last week, there were more no-landing economic indicators than either soft-landing or hard-landing ones. … Debbie and I don’t recall a happier batch of economic indicators than the ones that came out last week.” Suddenly, we along with lots of other economists and strategists had to assess the odds of no landing.
Previously, we had been assigning subjective probabilities of 60% to a soft landing and 40% to a hard landing. We tried to keep things simple last year, but we have to acknowledge that there are now four possible scenarios for this year:
(1) Soft landing (40%). In the soft-landing scenario, economic growth slows to a crawl this year, with real GDP rising around 0.5%-1.5%. The PCED inflation rate moderates to 3.0%-4.0% this year and is closer to the bottom end of this range by year-end. The Fed raises the federal funds rate two more times, by 25bps each time, to 5.00%-5.25% and leaves it there through the end of this year. The 10-year Treasury bond yield this year remains below the 4.25% at which it peaked last year. The S&P 500 rises to 4500 this summer and closes the year at a new high of 4800 as investors anticipate stronger earnings in 2024. S&P 500 earnings per share rises from $215 last year to $225 this year, and investors discount $250 next year by the end of this year. Life is good.
(2) Disinflationary no landing (20%). In this version of the no-landing scenario, real GDP rises around 2.0%-3.0%. However, inflation continues to moderate. Productivity makes a comeback. Price inflation falls faster than wage inflation so real wages increase, providing consumers with more purchasing power as employment gains slow. The Fed continues to hike the federal funds rate in 25bps increments. The terminal federal funds rate rises to 5.50%-5.75% by mid-year and remains there through year-end. The 10-year Treasury bond yield rises to 4.50%-4.75%. The S&P 500 is range bound between 4000 and 4500 most of the year. The earnings outlook is at least as good as in the soft-landing scenario, but higher interest rates weigh on valuation multiples.
(3) Hard landing (20%). In this scenario, an official recession occurs. As we’ve noted before, if that happens, it will be the most widely anticipated recession of all times. Hard-landers keep pushing it out as their dire predictions don’t pan out, especially now that the no-landing scenario has made a surprising comeback as a result of January’s stronger-than-expected economic indicators.
A hard landing has been mostly promoted by stock market bears who believe that last year’s bear market isn’t over and has another leg down this year to a new low, maybe before mid-year, in anticipation of a recession during H2-2023. If that doesn’t happen, there is always H1-2024 or H2-2024. A hard landing may be an inevitable result of the lagged effect of the Fed’s extraordinary monetary tightening last year. Or else, it could result because the Fed makes the classic mistake of overdoing what it has done so far.
(4) Inflationary no landing (20%). The new version of the hard landing is that inflation either persists or rebounds because there is no landing. This may be the most bearish scenario of them all because Fed officials would have to raise interest rates much higher as they conclude that only a recession can bring inflation down. In other words, the inflationary version of the no-landing scenario would simply be the long way to a hard landing, resulting in an even deeper recession and more bearish outlook for stocks.
(5) Our bottom line. The first two scenarios add up to a 60% subjective probability, in our opinion. They are optimistic outlooks for the economy and bullish for stocks and bonds. The second two scenarios add up to 40% subjective probabilities, in our opinion. They are pessimistic outlooks for the economy and bearish for stocks.
(6) The Fed’s bottom line. The party line at the Fed has called for a soft landing according to the FOMC’s December 2022 Summary of Economic Projections (SEP). Real GDP was expected to rise 0.5% in both 2022 and 2023 followed by 1.6% and 1.8% growth in 2024 and 2025. The longer-run trend of growth was deemed to be only 1.8%. The PCED inflation rate was expected to fall from 5.6% in 2022 to 3.1% this year, 2.5% next year, and 2.1% in 2025. The longer-run trend of inflation was judged to be 2.0%. The federal funds rate was expected to rise to 5.1% this year and fall to 4.1% and 3.1% over the next two years, closer to its longer run rate of 2.5%. (See our handy FOMC Economic Projections.)
The next SEP will be released on March 22. Between now and then, there will be releases for February’s CPI and employment and plenty of other economic and financial indicators that are likely to influence the next SEP. January’s economic indicators suggest that Fed officials will stick with their soft-landing scenario but will signal that it might take a higher-for-longer trajectory for the federal funds rate to get there. However, February’s batch of economic indicators collectively might favor one of the other four scenarios.
For now, we remain in the soft-landing club and have applied for membership in the disinflationary no-landing one.
US Economy II: Still Flying. Now that the no-landing scenario is widely considered a credible alternative to the soft- and hard-landing ones, let’s have a closer look at the latest data that has provided support for it:
(1) Production and warm winter. It’s possible that some of the strength in the latest batch of January’s economic indicators was attributable to the mild winter weather. According to the Fed’s industrial production release, the output of utilities fell 9.9% in January, as a swing from unseasonably cold weather in December to unseasonably warm weather in January depressed the demand for heating (Fig. 1). As a result, industrial production (unchanged in January) was weighed down by the drop in utility output. Manufacturing output was actually up 1.0% m/m, and mining output rose 2.0%, following two months with substantial decreases for each sector.
The Fed reported that consumer energy products, commercial energy products, and energy materials all recorded substantial decreases because of the drop in the output of utilities. The output of most other market groups advanced. The indexes for consumer non-energy nondurables, business equipment, defense and space equipment, and nondurable materials all rose more than 1%; the indexes for consumer durables, construction supplies, non-energy business supplies, and durable materials increased between 0.5% and 1.0%.
Some industries are likely to continue to grow, thus favoring the soft- or no-landing scenarios. Output of defense & space equipment rose 1.8% m/m (10.6% y/y) to a record high in January (Fig. 2). Aerospace & miscellaneous transport equipment jumped 1.1% m/m (10.2% y/y) last month, the highest since mid-2018 (Fig. 3). While semiconductor output has been falling since March 2022’s record high, production of computers & peripheral equipment and communication equipment both rose to record highs during January (Fig. 4). There’s no sign of a “tech wreck” in these data series.
It's worth noting that industrial production of construction supplies edged up 0.8% m/m in January and is down only 0.4% y/y (Fig. 5). So far, the recession in the housing industry isn’t decimating the construction supplies industries, as it had during the 2008 recession. That’s because multi-family housing construction and nonresidential construction remain strong (Fig. 6).
(2) Retail sales and discounting. Last year, consumers rushed to do their holiday shopping during October, when retail sales jumped 1.1% m/m. They did so because they feared that the stores might run out of merchandise in November and December, when retail sales fell 1.1% for both months. However, retailers received deliveries of lots of the merchandise they had ordered for the holidays that had been delayed by the jam at West Coast ports. As a result, their inventories piled up at the end of 2022. They discounted them during January, which boosted department-store sales by 17.5% during the month.
That’s the way we explain some of the strength in January’s retail sales. Last week, in the February 15 QuickTakes, we also observed that our Earned Income Proxy (EIP) rose 1.5% m/m during January, as the average workweek jumped 0.9%, payrolls increased 0.3%, and average hourly earnings rose 0.3% (Fig. 7).
Furthermore, auto sales soared from 13.6 million units (saar) during December to 16.2 million units in January (Fig. 8). That might have been partly attributable to the mild weather that month. In addition, parts shortages have abated in the auto industry, so orders have been getting filled faster.
Real retail sales (using the CPI goods index) rose 2.6% m/m during January but remained stalled since mid-2021, when consumers pivoted from their buying binge for goods to purchasing more services (Fig. 9). Core real retail sales (excluding building materials and food services) also rose during January but remained on their downward trend since mid-2021.
In current dollars, consumers’ pivoting to services can be seen in the food services & drinking places component of retail sales. It was up 7.2% m/m and 25.2% y/y during January (Fig. 10 and Fig. 11). The mild weather partly explains this surge, as does the jump in our EIP. In addition, Social Security payments were raised to reflect higher inflation in 2022, and several states sent their taxpayers inflation relief checks using surplus funds that weren’t spent during the pandemic.
(3) Leading indicators and coincident ones. Meanwhile, the Index of Leading Economic Indicators continues to signal an impending recession. It fell for a tenth straight month in January. It peaked at a record high during December 2021.
On the other hand, the Index of Coincident Economic Indicators (CEI) rose 0.2% m/m in January to yet another record high (Fig. 12). The CEI was up 1.3% y/y during January, confirming that real GDP is growing at about the same pace (it was up 1.0% y/y during Q4), consistent with a soft landing (Fig. 13).
US Economy III: Still Disinflating. The m/m increases in the headline and core PPIs were hotter than expected, at 0.7% and 0.6% during January. However, they were 6.0% and 4.5% on a y/y basis, well below their 2022 peaks of 11.7% and 7.1% (Fig. 14). PPI goods inflation peaked at 17.7% last year and fell to 7.5% during January, while PPI services fell from a peak of 9.4% last year to 5.0% in January (Fig. 15). The underlying trend remains a disinflationary one.
Fed officials have acknowledged that consumer goods prices are disinflating. However, they are concerned that services prices aren’t doing so. While they are expecting rent inflation to moderate during the second half of this year, they are much less sanguine about the outlook for the core PCED excluding housing costs inflation rate (Fig. 16). It has been hovering between 4.0% and 5.0% since early 2021. It ran at half that pace prior to the pandemic.
There are two other conceptually similar measures of core services consumer prices excluding housing that paint a mixed picture. The inflation rate of the core CPI services excluding rent of shelter peaked last year at 6.7% during September. But it remained elevated at 6.1% during January. The core PPI final demand for services (which does not include rent) peaked at 9.4% during March 2022 and plunged to 5.0% during January.
Movie. “Vikings: Valhalla: Season 2” (+ + +) (link) in many ways could have been titled “The Life & Times of Leif Erikson.” The only problem is that there’s no mention of any of Leif’s exploits in the Wikipedia account that matches his adventures in the Netflix series. It’s all good fun, with lots of intrigue and sword fights between Christians and pagans and between kings and would-be kings. It reminds us that eighteenth-century philosopher Jean-Jacques Rousseau’s Noble Savage really was a warmongering, blood-thirsty, insecure savage rather than his romanticized ideal of a virtuous, peace-loving denizen of our planet living a life of natural simplicity and harmony until corrupted by society.
Industrials, Chinese Spies & MIT’s Picks
February 16 (Thursday)
Check out the accompanying pdf and chart collection.
Executive Summary: Three pieces of recent legislation incentivize manufacturers to produce their goods on US soil, and the amount being spent on the construction of new factories has risen sharply, presumably in response. Jackie examines the projects planned by three such companies—a solar panel maker, a semiconductor manufacturer, and Ford Motor. … Also: We recap the DOJ’s recent efforts to stop Chinese spies intent on stealing US technology and defense secrets. … And: A look at several innovations on MIT’s short list of life-changing new technologies.
Industrials: Government-Fueled Manufacturing Boom. Tax and other incentives in the Infrastructure Investment and Jobs Act, the Inflation Reduction Act, and the CHIPS and Science Act are having the desired effect: Companies are making plans to manufacture more of their goods in the US. This is particularly true for companies that manufacture semiconductors or “green things”—like solar components, batteries, and electric vehicles—and that process lithium and green hydrogen.
It's early days, but the new projects may already be having an impact. The amount spent on the construction of manufacturing facilities has risen sharply, to $122.2 billion in December (saar), up from $80.2 billion in December 2019 (Fig. 1). Spending on commercial construction has also jumped, to $122.4 billion in December (saar) up from $83.9 billion in December 2019 (Fig. 2). The jump in nonresidential construction is helping to offset the drag from the decline in residential construction (Fig. 3).
Payrolls in construction and manufacturing are also rising. Construction payrolls are near all-time highs. Manufacturing payrolls are far from the levels during the 1970s boom years, but they have bounced back from their Covid-affected lows and are at their highest level since November 2008 (Fig. 4 and Fig. 5).
This week brought more news from manufacturers and investors planning to develop new US manufacturing plants. I asked Jackie to take a look at what they had to say:
(1) Making US solar panels. SolarEdge Technologies manufactures and sells solar panels and batteries to individuals and companies around the world. During its Q4 earnings conference call on February 13, the company announced it will move forward with plans to manufacture inverters and optimizers in the US through a combination of contract manufacturing and manufacturing in company-owned facilities.
“We expect [the] first products to be manufactured in the third quarter of 2023 and are aiming for the majority of the [Inflation Reduction Act] credited residential and commercial products for the U.S. market to be manufactured domestically by the second half of 2024. Some of the details of this plan are still dependent on the impending clarifications from the Treasury,” said CEO Zvi Lando. The company is also ramping up manufacturing in Mexico of its products for the US residential market.
Ironically, SolarEdge has experienced a slowdown in the US market—Q1 sales are only expected to be flattish y/y in North America—because of higher interest rates and a new rule in California that sharply reduces the credit homeowners receive when they sell solar-generated electricity to utilities. But SolarEdge sees a silver lining in the new rule: It should encourage homeowners to purchase the company’s solar panels and battery systems, as they provide homeowners with the option either to store excess electricity produced to use themselves at a later time or to sell it back to the utility at a time when it garners top dollar.
Company officials are optimistic that the California market will adjust to the new rule. “We have seen such transitions happen in the past in Europe, in countries like the U.K., Germany, and Belgium. And while it takes the market time to adjust to the new reality, we typically experienced significant growth in PV-plus-battery installation rates following such tariff transition,” said Lando.
Meanwhile, demand in Europe exceeds the company’s ability to produce and deliver the products demanded. There’s also a shortage of installers, which is “becoming a significant bottleneck for growth.” SolarEdge forecasts 20%-30% y/y growth in Europe this year.
(2) US bricks, Chinese technology. Ford Motor is the latest company to announce the construction of a battery plant in the US. It’s investing $3.5 billion to build a plant in Michigan, and it will license the battery technology from China’s Contemporary Amperex Technology (CATL). “Ford considered sites for the battery plant in Mexico and Canada, but ultimately settled on Michigan in part because of the federal subsidies available under the [Inflation Reduction Act],” a February 13 WSJ article reported. CATL employees will be at the factory, and some of the materials will be shipped from China, but Ford will control the plant’s operations.
(3) New financing methods. Intel will tap into the incentives provided by the CHIPS and Science Act when building its giant new semiconductor fab in Arizona. But to provide additional funding, it turned to Brookfield Infrastructure Partners LP. Brookfield committed $15 billion of funding—$2 billion of equity and $13 billion of debt—a February 2 Bloomberg article reported.
Funding the construction of a semiconductor plant is a first for Brookfield Infrastructure Partners, which normally provides funding for the construction of projects that are affiliated with utilities, transportation, midstream energy, or data centers. Semiconductor plants may involve more risk than its traditional infrastructure projects because the plant’s technology can quickly become obsolete. Intel provided Brookfield with some downside loss protection; and if the plant is more profitable than expected, the benefits will accrue to Intel, Bloomberg reported.
The novel deal structure has received attention from governments, companies, and other investments funds that are evaluating whether the structure can finance the construction of manufacturing plants that produce semiconductors, batteries, or other items, said CEO Samuel Pollock on Brookfield Infrastructure’s February 2 conference call. It’s a deal structure he thinks Brookfield “should be hopefully doing a lot more [of].”
There’s a huge demand for capital to fund the construction of new and refurbishment of old infrastructure. The “infrastructure super cycle is creating long-term investment opportunities that will require trillions of dollars. This is generating large-scale opportunities for well-capitalized players that can invest in growing operating platforms or be a partner of choice for government or corporate entities that have less access to the capital markets,” said Pollock. And Uncle Sam is providing a lot of funding to make sure that infrastructure is built in the USA.
China: Balloons & Spies. The wayward balloons shot down by the US military and questions surrounding their origin (Chinese?) and purpose (spy craft or weather research?) prompted us to check the Department of Justice’s (DOJ) efforts to charge those spying on behalf of Chinese government or Chinese companies. The pace of press releases seems to have slowed from a few years ago, when the agency brought numerous cases against US professors with mixed results. But new DOJ cases indicate the Chinese government hasn’t ended—or even slowed down—its Cold War efforts to illegally obtain information about US technology and defense. Here are some recent DOJ reports:
(1) Spies sentenced. Ji Chaoqun was sentenced in January to eight years in prison after being convicted by a jury in the Northern District of Illinois for acting as an agent of the People’s Republic of China (PRC) and making false statements to the US Army. Ji was providing biographical information on individuals for possible recruitment by a Chinese state security agency. The targeted individuals were working as engineers and scientists in the US. Some of them were Chinese nationals, and some worked for US defense contractors. The Chinese security arm was looking to “obtain access to advanced aerospace and satellite technologies,” a January 25 DOJ press release states. Ji enlisted in the US Army Reserves and hoped to gain US citizenship and join the CIA, FBI, or NASA in areas that would give him access to their databases.
Ji’s Chinese “handler” was also arrested and sentenced to 20 years in prison for espionage crimes and attempting to steal commercial and military trade secrets, a November 16 DOJ press release states. Yanjun Xu worked in China as an intelligence officer and used aliases to recruit US aviation employees to travel to China under the guise that they were traveling to give a presentation to a university. While there, Chinese security personnel would enter the US target’s hotel room and hack or copy the contents of that person’s computer. Xu also recruited insiders in a French aircraft engine manufacturer’s facility in China who were willing to plant malware in a French employee’s work computer to infiltrate the company’s computer network in France.
(2) American caught. Shapour Moinian was a US Army helicopter pilot from 1977 through 2000 and then worked for several defense contractors cleared to work on projects handling classified information. He was sentenced to 20 months in prison for accepting thousands of dollars from representatives of the Chinese government in return for aviation-related information from his defense contractor employers, a November 7 DOJ press release states.
He was contacted by an individual in China who claimed to be working for a technical recruiting company but who Moinian subsequently knew was employed by or working with the PRC. Moinian provided information to his handlers via a thumb drive and a cell phone. Money was paid in multiple transactions through Moinian’s stepdaughter’s South Korean bank account and via cash that Moinian and his wife smuggled back into the US.
(3) Charges pending. In three separate cases, the DOJ alleges that 13 people acted on behalf of the PRC to steal information or to force a Chinese national residing in the US to return to China. Two PRC intelligence officers attempted to bribe a US government employee with $41,000 of bitcoin to provide information about an ongoing federal criminal investigation and prosecution of a global telecommunications company based in China.
Charges were also brought against four Chinese nationals attempting to recruit individuals to act on behalf of the PRC in the US by providing information, materials, equipment, and assistance to further China’s intelligence objectives, an October 24 DOJ press release states. The recruitment efforts targeted professors at universities, a former federal law enforcement and state homeland security official, and others.
One individual was given an all-expenses-paid trip to China and while there was recruited by two Chinese intelligence officers charged by the DOJ. The indictment reads like a spy novel: The Chinese intelligence officers and others requested that the individual “provide sensitive fingerprint technology, information and assistance with stopping planned protests along the 2008 Olympic Games torch route in the United States” which would embarrass China. The individual was also “requested to sign a contract for purported consulting services with a Chinese company” with the goal of building sources and channels by which to collect security information.
Disruptive Technologies: MIT’s Tech Picks. MIT Technology Review kicked off 2023 by picking 10 breakthrough technologies its editors think will have a big impact on our lives. Some of these—like AI technology that makes images and the James Web space telescope—are already in operation. Others are still under development. Three technologies in particular caught our attention: CRISPR that cures high cholesterol, royalty-free semiconductors, and unlimited organs for transplant. Here’s what’s notable about each:
(1) CRISPR cures high cholesterol. Gene-editing technology CRISPR has been used to edit genes and cure rare diseases. Now it’s set to have a much wider impact. It was used last year to treat and permanently lower a woman’s cholesterol.
Verve Therapeutics developed a treatment using base editing, or CRISPR 2.0. “It’s a more targeted approach—instead of simply making cuts to shut off specific genes, scientists can now swap a single DNA base for another. In theory, this should be safer because you’re less likely to cut an important gene by mistake, and you can avoid potential errors that may occur when DNA repairs itself after being cut,” a January 9 MIT Technology Review article reported. Another form of CRISPR—Prime editing—allows scientists to add parts of DNA into a genome. Scientists hope these new versions of CRISPR editing could cure ailments that affect far more people, but that might not happen for another decade.
(2) Open standards come to semis. Companies have long paid to license chip designs from semiconductor companies such as Intel and ARM Holdings. But now an open standard has been developed, called “RISC-V,” that makes it easy for anyone to program a chip, MIT Technology Review reports.
China’s Alibaba Group Holding is using RISC-V chips in its data centers and is selling versions of it, a January 11, 2021 WSJ article reported. Alibaba’s chip isn’t cutting-edge, but it’s much less expensive than traditional chips because no royalty payments are owed. Western companies have experimented with the chip too. Qualcomm and Samsung Electronic have used RISC-V in some smartphone chips, and Western Digital has used it as well.
Developed by the University of California, Berkeley with some backing from the Defense Advanced Research Projects Agency, RISC-V originally was envisioned as a way for academics to work on projects without paying royalties. The global body overseeing the standard relocated from the US to Switzerland to ensure that it wouldn’t fall under US export restrictions. The goal, the WSJ article states, is to have the standard used by chips in high-end computers in roughly five years.
That likely would be very bad news for today’s chip manufacturers—perhaps jeopardizing their investments in plants they’re planning to build in the US.
(3) Organ manufacturing. Scientists are trying to make more organs available for transplants. One strategy they’re working on is editing the genes of pigs and other animals so that their organs don’t have sugars on the surface that cause humans’ immune systems to reject the animals’ organs. Some researchers are also experimenting with 3D-printing to create scaffolds in the shape of lungs to use in artificial lung transplants. Others are using stem cells to cultivate “organoids,” MIT Technology Review reports.
Just last month, a 3D-printed ear made of human cells was transplanted onto a patient with microtia, a condition in which people are born with an underdeveloped or absent ear. 3DBio Therapeutics took cells from the woman’s existing ear tissue to grow additional cells in the lab and used them as “bio-ink” to 3D print a new ear, according to a January 18 article in the UK’s Daily Star. The company is conducting clinical trials with another 11 patients and hopes the process can be used to print other replacement body parts, such as spines, noses, and ultimately vital organs.
On Consumer Inflation & Housing Activity
February 15 (Wednesday)
Check out the accompanying pdf and chart collection.
Executive Summary: Yesterday’s CPI report for January showed inflation continuing to moderate but slowly. The new information isn’t likely to moderate Fed officials’ hawkishness, though, and doesn’t much change the economic outlook. We continue to see a soft landing with disinflation as the Fed continues to raise the federal funds rate to 5.10%, then keeps it there through year-end. So the stock-market implications of the CPI results are minimal. But stocks and bonds might be ready for some consolidation after their runups since October. … Also: Melissa homes in on why home prices have been holding up and looks at housing market trends.
US Inflation: Moderating Slowly. January’s CPI release yesterday showed that inflation is continuing to moderate, though perhaps more slowly than it did during H2-2022. Fed officials are likely to remain hawkish. It’s unlikely that the latest inflation report will turn any of them more dovish; a few may turn more hawkish and start talking about a higher terminal federal funds rate. The FOMC’s December 2022 Summary of Economic Projections (SEP) showed a median forecast of 5.1% for the end of this year, falling to 4.1% in 2024 and 3.1% in 2025. (See our FOMC Economic Projections.)
The next SEP will be released on March 22. A lot can happen between now and then. For now, we expect that the majority of the FOMC members will continue to favor incremental rate hikes of 25bps during the March and May meetings of the committee. We also still expect them to pause after the federal funds rate range is raised to 5.00%-5.25% at the May meeting. That’s because we expect that level will be restrictive enough that the headline PCED inflation rate will continue to moderate from 5.0% during December to 3.0%-4.0% as the year progresses (Fig. 1). Let’s review the latest CPI report:
(1) Headline & core. The headline and core CPI rose 6.4% y/y and 5.6% through January down from 6.5% and 5.7% during December (Fig. 2). The FOMC’s SEP focuses on the headline and core PCED, which were up 5.0% and 4.4% in December. January’s update will come out on February 24.
(2) Goods. The CPI for all consumer goods rose 4.5% y/y in January, down from 4.8% in December and down from the March 2022 peak of 14.2% (Fig. 3). Consumer nondurable goods prices edged up to 7.5% in January, down from last year’s peak of 16.2% during June (Fig. 4). Consumer durable goods inflation peaked at 18.7% last February and was down to -1.3% in January (Fig. 5). Fed Chair Jerome Powell recently remarked that consumer goods prices are disinflating. They certainly are doing just that.
(3) Services. On the other hand, CPI services inflation mostly remains sticky. In some services industries, rates haven’t peaked at all but continue to rise. Fed officials acknowledge that much of the stickiness of rent inflation is attributable to the way this category is measured in the CPI. Inflation in new rental leases has been falling sharply since mid-2022. The CPI’s rent categories rose to new highs during January, although their three-month annualized rates have stabilized over the past five months (Fig. 6).
The Fed’s focus in recent months has been on core PCED services inflation excluding housing costs. Fed officials are troubled that it has been stuck around 4.0%-5.0% over the past year (Fig. 7). The CPI version of this series didn’t provide any relief. It was up 6.1% y/y during January, only slightly below its 2022 near-record high of 6.6% during September. It was mostly boosted by transportation services (14.6%), recreation (5.7%), and other personal services (5.3%) (Fig. 8).
(4) Market implications. We have been in the disinflation soft-landing camp for a while. Our outlook has been relatively in sync with the FOMC’s SEP scenario. As a result, we’ve followed the SEP’s guidance (and Powell’s) that the federal funds rate would be raised to 5.10% early this year and remain there through year-end. We don’t believe that yesterday’s CPI report changes that outlook significantly. Furthermore, we still believe that the S&P 500 bottomed on October 12 of last year and that the 10-year Treasury bond yield peaked at 4.25% on October 24 of last year. We’ve had nice rallies in both stocks and bonds since then. Both may be due for some consolidation.
We asked Joe Feshbach, our trading consultant, to update his views on the stock market. He reiterated his comments from last week: “The sentiment indicators were not supportive enough of a major breakout, but more in line with a breakout that would fail. The corrective process I anticipated is underway and will be resolved either through time or lower prices. I reiterate that price strength should be used as an opportunity to pare back holdings.”
US Housing I: Sticky Prices. During 2022, housing sales volume dropped as mortgage rates rose above 7.0% and affordability plummeted. The high rates of housing price inflation triggered by the pandemic have declined along with sales volume. Yet price levels haven’t dropped much, remaining sticky owing to constrained supply. Melissa and I expect that housing supply-side dynamics will continue to support housing prices at least until mortgage rates normalize.
The supply of new and existing homes on the market is tight for a couple of reasons: Even if mortgage rates fall this year to nearly 5.0%, as expected by the National Association of Realtors (NAR), that’s still too high to entice many potential home sellers carrying mortgages at rates around 3.0% to consider putting their homes on the market. Rates of 3.0% and lower were the norm from mid-2020 through the end of 2021. And keeping the supply of new homes on the market tight has been the trend of underbuilding that began even before the pandemic. Many homebuilders have lowered their prices from the pandemic peak, however.
Here’s more on where home prices are at now:
(1) Existing single-family home price inflation drops. Based on the 24-month percent change, the median existing single-family home price inflation rate rose to an all-time record high of 45.0% during May of last year, at the height of the pandemic housing boom, falling to 18.8% in December 2022 (Fig. 9).
(2) New home single-family price inflation falls, too. Median new home inflation has fallen to 14.7% y/y (based on the 12-month moving average) in December from a recent peak near 20.0% in April 2022 (Fig. 10).
(3) New and existing single-family home prices remain sticky. Even with the latest slowdown in housing price increases, the 12-month moving average for new home prices still topped a record $450,000 in December 2022 (Fig. 11). Existing home prices neared a record $400,000 for the equivalent series.
US Housing II: Turning Point. Some would-be homebuyers who walked away from the housing market last year may be starting to come back. Melissa and I doubt that the few signs of increased activity presage a strong resurgence in housing demand, but we don’t see a continuation of last year’s bust ahead either.
Let’s take an updated tour of the housing market data:
(1) Mortgage rates take a breath. The 30-year fixed mortgage rate probably peaked in October at its 20-year high of 7.41%, up from 2.83% in February 2021. It since has dropped to 6.72% as of February 13 (Fig. 12). As rates have dropped, mortgage applications to purchase homes have started to move higher in recent weeks (Fig. 13).
(2) Affordability is still squeezing buyers. Home price increases may be trending down. But housing affordability remains challenging. The NAR’s Housing Affordability Index sank below 100.0 to 91.3 during October. It moved up in December to 101.2 (Fig. 14).
(3) Green shoots. Existing home sales continued to drop through December. But pending home sales edged up in December by 2.5% after a six-month drop of 24.7% (Fig. 15).
Traffic of prospective new homebuyers sank during November nearly to 2020 lows, according to the National Association of Homebuilders’ Housing Market Index (Fig. 16). It since has also edged up in response to lower mortgage rates and housing inflation.
(4) Homes for sale mixed. Continuing to support prices, the months’ supply of existing homes on the market remained puny at 2.9 months during December (Fig. 17).
New homes inventories, conversely, have been holding at around a nine months’ supply, up from a pandemic low near three months’ (Fig. 18). Homebuilders aiming to take advantage of the pandemic buying spree were stuck with completed homes that couldn’t be sold as mortgage rates were rising.
Housing starts and permits both dropped in December as builders pulled back to wait out the market (Fig. 19).
US Housing III: The Road Ahead. The housing market’s next big turning point will come when the Baby Boomers finally downsize into more manageable spaces or assisted living facilities over the coming years. That will leave younger generations to support single-family home demand. They haven’t aspired to homeownership as older generations have and aren’t having as many children. So smaller and more affordable housing will likely be most in demand.
In response to these demographic trends, builders are moving on the multifamily market. While multifamily housing is forecast to be oversupplied for the next few years, that situation should be short-lived. Consider the following:
(1) Boomers graying. By 2034, the elderly will outnumber children for the first time in US history, according to Census Bureau projections. There’s an estimated 70 million Baby Boomers (born from 1946 to 1964) in the US. By 2030, all Boomers will be at least 65 years old. The ranks of over-65 people grew rapidly last century, from 3 million in 1900 to 35 million in 2000, according to the Census Bureau. Their share of the population is expected to continue to grow, reflecting longer lives and record-low birth rates.
Many Baby Boomers have chosen to “age in place,” a trend that the pandemic further supported. But their sheer numbers suggest rising demand for other forms of senior housing as well, such as senior living communities and multifamily living.
Recent market commentary from Fannie Mae observed that it takes years to develop institutional seniors housing facilities, but the seniors housing industry will likely “not be growing its inventory at rates approaching the speed its target population will be growing over the forecasted period.”
(2) Millennial buyer blues. Millennials (born 1981-96) are now 27-40 years old. The 62 million cohort is now at or above prime homebuying age (early 30s). Millennials entered the labor force during a difficult recession spurred by the housing crisis. Now they’re entering the housing market at a time when affordable housing is in short supply, because of both the pandemic-induced trends discussed above and Baby Boomers’ desire to hang onto their homes for as long as possible. As a result, the share of first-time homebuyers hit an all-time low of 26% in 2022, down from 31% in 2021, according to NAR.
Guides to Inflation & the Economy
February 14 (Tuesday)
Check out the accompanying pdf and chart collection.
Executive Summary: How investors interpret this morning’s CPI release for January could move the markets; but assessing what the data say about inflation’s stickiness may be tricky given BLS’s new CPI calculation methodology. All eyes will be on services inflation in particular since it hasn’t yet peaked, buoyed by wage inflation. … The long-running hard-vs-soft-landing economic debate now includes a no-landing prospect, which itself has two scenarios—an inflationary version (possibly the long route to a hard landing?) and a disinflationary one. The latter would be ideal, and we think it’s possible. … Also: The economies of Europe and China both dodged bullets this winter, to widespread surprise.
Inflation Guide: Valentine’s Day Massacre? Have you heard? January’s CPI will be released this morning at 8:30 a.m. A bad number could result in a Valentine’s Day Massacre in the bond and stock markets. A good number would allow investors who own bonds and stocks to share their joy (along with a bouquet of flowers and a box of chocolates) with their significant others.
Everyone in our business will be holding their breath. Will the number confirm that disinflation is spreading, or will it show that inflation is sticky? Debbie and I are in the disinflation camp. We’re holding our breath simply because month-to-month changes in the CPI tend to be volatile and less predictable than usual. Today’s number is especially tricky to forecast—and will be tricky to assess once it comes out—because the Bureau of Labor Statistics (BLS) started out the new year with new seasonal adjustment factors and new weights for the components of the CPI. Here are some things to watch out for:
(1) Good vs bad numbers. What numbers have been discounted by the financial markets for January’s CPI? The Bloomberg consensus is that the headline and core CPI inflation rates will be 0.5% and 0.4%, respectively. Those prints will be compared to December’s 0.1% and 0.4%.
More important will be the y/y comparisons since they will more clearly show whether inflation is continuing to moderate or not. The y/y consensus forecasts for January’s headline and core CPI inflation rates are 6.2% and 5.5% versus 6.5% and 5.7% in December (Fig. 1). If those estimates are on target, the markets should remain calm and move on to the next BIG number, i.e., February’s payroll employment, which will be released on March 3.
(2) Seasonal adjustments. December's CPI inflation readings of 0.1% and 0.4% were upwardly revised from -0.1% and 0.3% by the BLS on Friday. October and November were also revised higher. These revisions were attributable to new seasonal adjustment factors. So the y/y comparisons remained the same. Nevertheless, there was some Internet buzz that the revisions were a major setback for the disinflation story. That’s not correct given that the y/y comparisons didn’t change, as noted above.
(3) New weights. Starting with the January 2023 data, the BLS plans to update the weights of the CPI’s components annually based on a single calendar year’s worth of data, using consumer expenditure data from 2021. This reflects a change from its prior practice of updating weights biennially using two years’ worth of expenditure data. Debbie and I will have a look and let you know if we find anything worth mentioning.
(4) Goods vs services. We noted in the February 6 Morning Briefing that the word “disinflation” was uttered 11 times at Fed Chair Jerome Powell’s press conference on February 1. He was the only one who mentioned the word at his presser. He repeatedly acknowledged that inflation was moderating but still had a ways to go before reaching the Fed’s 2.0% target. Nevertheless, Powell sounded much less hawkish than during his previous presser on December 14, 2022, when the word was mentioned only twice, both times by reporters.
Powell explained that while goods prices clearly have disinflated, inflationary pressures have remained too high in services. Indeed, the headline and core CPI goods inflation rates peaked at 14.2% y/y and 12.3%, respectively, during March and February 2022 (Fig. 2). They were down to 4.8% and 2.1% during December.
The headline and core CPI services inflation rates have yet to peak. They were 7.5% and 7.0% during December (Fig. 3). Fed officials have acknowledged that the rent components of the services CPI are lagging indicators because they reflect rents of all current leases. Rents for tenant and owners’ occupied residences in the CPI rose 8.3% y/y and 7.5% during December (Fig. 4). Meanwhile, newly signed leases have been showing significant disinflation since the start of last year (Fig. 5).
As a result, all eyes will be on the core CPI services excluding shelter inflation rate coming out tomorrow (Fig. 6). It might give us a clue about the core PCED services excluding housing inflation rate, which has become the new obsession for Fed officials. It has been stalled around 4.0%-5.0% y/y for the past year. However, the CPI version clearly peaked last February at 7.6% y/y and has been falling since, to 4.4% during December.
(5) Wage inflation. Powell recently observed that core services-providing industries excluding housing are more labor intensive than are goods-producing industries. He concluded that it might be harder and take longer to bring inflation down in the former than in the latter because wage inflation tends to be sticker than inflation in most prices. He might be right. However, the data show that average hourly earnings (AHE) of all workers in private services-providing industries peaked at 6.1% y/y during March 2022 and fell to 4.5% by January. So far, this wage disinflation seems to have brought down the core CPI excluding shelter inflation rate more than it has the comparable PCED inflation rate (Fig. 7 and Fig. 8).
Interestingly, the AHE data for production and nonsupervisory workers actually show that wage inflation has moderated significantly in services-providing industries—from last year’s June peak of 7.3% to 5.0% by January 2023—while wage inflation has been stuck just south of 6.0% for goods-producing industries over the same period. For all workers, wage inflation has disinflated in both goods-producing and services-providing industries (Fig. 9 and Fig. 10).
(6) Real interest rates. Real interest rates have increased significantly in recent months as a result of the surge in the federal funds rate and in the 10-year US Treasury bond yield along with the disinflation in the CPI since last summer (Fig. 11, Fig. 12, Fig. 13, and Fig. 14). The real federal funds rate is up from a record low of -8.3% during March 2022 of last year to -2.4% during December. The real 10-year US Treasury bond yield is up from -6.4% during March 2022 to -2.8% during December.
(7) Inflationary expectations. Real rates actually are positive now if we use the three-years-ahead inflation expectations data collected by the Federal Reserve Bank of New York (Fig. 15). It was down to 2.7% during January, the lowest since October 2020. That’s well below December’s 6.5% headline CPI inflation rate. It is also below the current readings of the federal funds rate (4.75%), the 2-year Treasury (4.52%), and the 10-year Treasury (3.72%).
US Economy Guide: Landings or No Landing? The debate over a soft versus hard landing of the US economy landed in a WSJ article fittingly titled “Hard or Soft Landing? Some Economists See Neither if Growth Accelerates” and dated February 12, 2023. Debbie and I have discussed this issue in recent weeks, observing that while the debate has been raging about soft or hard landings, the economy remains airborne and shows few signs of actually landing. Here is what we wrote in the January 3 Morning Briefing:
“In recent months, the economic indicators have supported the ‘no-landing’ scenario rather than either the hard-landing or soft-landing alternatives. Surprisingly resilient economic growth might cause inflation to persist at high levels rather than to moderate. If so, the Fed will have no choice but to hike the federal funds rate higher for longer. The narrowing path to a soft landing would no longer be an option for the Fed. Instead, Fed officials likely would conclude that the only way to bring inflation down is by causing a recession. In this scenario, they might have to raise the federal funds rate much closer to the inflation rate (or even above it) until that does the job.”
In other words, the inflationary no-landing scenario may turn out to be the long way to a hard landing. That leaves the question of whether a disinflationary no-landing scenario is possible. We think it is. We think that the economy has been in a “rolling recession” since the start of 2022. We first started to write about this scenario in the August 16, 2022 Morning Briefing: “It’s possible that we might all collectively talk ourselves into a recession. It’s also possible that we are all hunkering down just enough that any recession will be mild since there won’t be too many excesses to worsen it. The downturn could be what we’ve called a ‘rolling recession’ during the mid-1980s for the US.”
Housing fell into a recession in early 2022 as the 30-year mortgage rate soared from 3.32% at the start of the year to peak at 7.41% on November 3 of that year. It is now showing signs of bottoming, as lower home prices and a slight easing of mortgage rates have boosted affordability.
Consumer spending on goods has been flat since mid-2021 following the post-lockdown buying binge. As a result, goods-providers were stuck with inventories that had to be discounted to be sold. Meanwhile, consumers have been increasing their spending on services.
Technology industries went on a hiring spree during the pandemic, expecting to be among the few beneficiaries of the calamity. They are now paring their bloated payrolls. So far, these cuts have been too small to boost overall initial unemployment claims, which remain historically low.
Global Economy Guide: A World of Less Trouble? While the US economic outlook has been a source of dissention since early last year, few disagreed last summer that both Europe and China would be in recessions by now. Europe was expected to go dark and freeze during the winter months because of a shortage of natural gas resulting from Russia’s attack on Ukraine. China’s recession was expected to result from the government’s zero-Covid lockdowns. Instead, Europe succeeded in finding other sources of natural gas and Beijing simply ended its Covid restrictions.
Here are some recent relevant developments in Europe and China:
(1) Europe. The Economic Sentiment Indicator for the Eurozone fell below 100 last year during July and fell to a low of 93.7 during October (Fig. 16). That suggested that real GDP could be headed for a hard landing. However, the index has recovered since then back to 99.9 in January, consistent with a soft landing.
(2) China. The Chinese government not only reversed course on its zero-Covid policy but also refocused on stimulating the economy. That’s evident in January’s bank loans, which increased by a record $725.3 billion during the month (Fig. 17). That isn’t an annualized number: It’s what was lent in one month!
Financial Conditions
February 13 (Monday)
Check out the accompanying pdf and chart collection.
Executive Summary: Perversely, the financial markets’ vote of confidence in the Fed’s ability to subdue inflation without getting the economy into trouble represents a threat to those very efforts, in Fed officials’ eyes, loosening financial conditions as the Fed tightens them. So Fed officials have been trying to squelch investor optimism. … A close look at the data relevant to financial conditions reveals them as tight, but in a good way—tight enough to bring inflation down without a recession but not tight enough to provoke a credit crunch that results in a recession. We continue to stand behind our disinflationary soft-landing forecast. ... Also: Dr. Ed reviews the film “Mr. Jones” (+ + +).
YRI Weekly Webcast. Join Dr. Ed’s live webcast with Q&A on Mondays at 11 a.m. EST. You will receive an email with the link one hour before showtime. Replays of the weekly webcasts are available here.
The Fed I: Fighting the Markets. Fed officials have indicated that they’d rather see stock and bond prices fall than continue to rise, as they’ve been doing since October of last year. In their opinion, financial markets’ strength has eased financial conditions in the economy, offsetting some of their efforts to tighten financial conditions to bring inflation down.
Joe and I question their logic. In our opinion, the drop in bond yields since late last year and the increasing inversion of the yield curve are suggesting that the Fed’s monetary tightening policy is likely to work to bring inflation down without much further tightening. The same can be said about the stock market rally since October 12: It implies that investors believe that the federal funds rate is close to its terminal rate and that the Fed might succeed in bringing inflation down without causing a recession. If investors thought that the Fed’s tightening had already set the stage for a recession, bond yields would continue to fall and so would stock prices.
In effect, Fed officials have been reminding investors of the adage “Don’t fight the Fed.” Rhetorically speaking, the Fed heads have been fighting the markets’ optimism that the Fed can pull off a disinflationary soft landing. The Fed’s campaign to squelch such optimism started early this year. Consider the following:
(1) During his November 2, 2022 press conference, Fed Chair Jerome Powell mentioned “financial conditions” 10 times in the context that they were sufficiently tight. For example, he said, “Financial conditions have tightened significantly in response to our policy actions, and we are seeing the effects on demand in the most interest-rate-sensitive sectors of the economy, such as housing. It will take time, however, for the full effects of monetary restraint to be realized, especially on inflation.”
Powell said that in the past monetary policy worked with “long and variable lags” and that it worked first on financial conditions, then the economy, and “perhaps later than that even on inflation.” What he didn’t say is that very often in the past, Fed tightening triggered a credit crunch, which caused a recession that brought down inflation. In any event, he suggested that the lags might be shorter because “financial conditions react well before in expectation of monetary policy [actions].”
(2) During his December 14 presser, Powell said that “it is important that over time” financial conditions “reflect the policy restraint that we are putting in place to return inflation to 2 percent.” CNBC’s Steve Liesman directly asked Powell whether the rallies in the bond and stock markets since the November meeting had eased financial conditions and impeded the Fed’s effort to bring down inflation. Powell didn’t directly answer the question but reiterated that monetary policy works through financial conditions.
(3) During his February 1 presser, Powell also reiterated a point that he had made at his previous one: “[F]inancial conditions have tightened very significantly over the past year. I would say that our focus is not on short-term moves but on sustained changes to broader financial conditions.” That implied that he wasn’t overly concerned about the rallies in the stock and bond markets.
At this same presser, Greg Robb of MarketWatch noted that the December FOMC minutes released on January 4 implied that these rallies were of concern to the committee: “Participants noted that, because monetary policy worked importantly through financial markets, an unwarranted easing in financial conditions, especially if driven by a misperception by the public of the Committee’s reaction function, would complicate the Committee’s effort to restore price stability.”
At first, Powell punted saying, “It’s something we monitor carefully.” But then he said, “It's important that the markets do reflect the tightening that we're putting in place. As we've discussed a couple of times here, there's a difference in perspective by some market measures on how fast inflation will come down. We're just going to have to see. I mean, I'm not going to try to persuade people to have a different forecast, but our forecast is that it will take some time and some patience and that we'll need to keep rates higher for longer. But we'll see.”
(4) In a live interview at The Wall Street Journal’s CFO Network Summit in New York on February 8, Federal Reserve Bank of New York President John Williams warned, “So looser financial conditions or more supportive financial conditions ... might imply a higher interest rate to make sure that we’re getting to the goals that we’re trying to achieve.”
We have been warned.
The Fed II: Assessing Financial Conditions. Now let’s assess the current state of financial conditions. Frankly, we aren’t big fans of indexes that purport to measure whether conditions are easy or tight. We much prefer to look at the trees than at the forest in this case. We all know when credit is easy to get and when it is getting harder to get. We are almost always surprised when it suddenly becomes almost impossible to get credit even for borrowers with good credit histories. So let’s have a look at some trees:
(1) Yield-curve spreads. In the past, we’ve often tracked the yield-curve spread as a useful measure for assessing credit conditions. In our 2019 study The Yield Curve: What Is It Really Predicting?, Melissa and I concluded that inverted yield curves predicted that if the Fed continued to tighten monetary policy by raising the federal funds rate, something would break in the financial system. Sure enough, in the past financial crises occurred soon after yield-curve inversions. Often, they would morph into a widespread credit crunch and a recession, forcing the Fed to reverse course and lower the federal funds rate.
Since the mid-1960s, financial crises occurred at or just before the peaks in the federal funds rate (Fig. 1). The yield curve inverted before the crises as well, with the spread between the federal funds rate and the 10-year Treasury yield at its most negative reading just when the crises occurred and marking the end of the tightening cycles (Fig. 2).
Melissa and I prefer to monitor the yield spread between the 2-year and 10-year Treasuries, but it is only available since 1976, so it misses the 1970 Penn Central crisis and the 1974 Franklin National Bank crisis (Fig. 3). The spread is currently -80bps, which is the most negative since the early 1980s. It first inverted last summer. In the past, inversions occurred near the end of Fed tightening cycles when the 2-year yield rose above the 10-year yield, then both fell in unison for a short while before the 2-year’s fall outpaced that of the 10-year (Fig. 4).
The yield curve is currently signaling that financial conditions are very tight. However, so far, the recent financial crises have been minor ones (including last year’s cryptocurrency, SPAC, and ARKK crashes), and they certainly haven’t triggered a credit crunch. That’s because the epicenter of previous financial crises tended to be financial intermediaries. However, since the Great Financial Crisis, financial institutions have been more tightly regulated and closely supervised by government regulators.
This raises an interesting question: If there is no credit crunch and therefore no recession just ahead, will the Fed have to raise interest rates much higher to subdue inflation? We think not, as we think inflation is already moderating sufficiently to reduce the risk of the inflationary no-landing scenario. However, the possibility of that scenario does pose risk to our disinflationary soft-landing scenario. That’s why we are still assigning a 40% subjective probability to a hard landing and 60% to a soft landing.
(2) Credit spreads. Another widely followed indicator of financial conditions is the yield spread between the high-yield corporate bond composite and the 10-year Treasury (Fig. 5). It and other credit-quality spreads tend to widen rapidly during credit crunches and recessions. Unlike the yield spread, however, the credit-quality spreads are coincident rather than leading indicators of trouble. In any event, while credit-quality spreads were widening moderately during H1-2022, they’ve been narrowing since mid-2022.
On the other hand, the spread between the 30-year mortgage rate and the 10-year Treasury yield widened dramatically during 2022, by 130bps from 169bps at the start of the year to 299bps at the end of the year (Fig. 6). However, that didn’t reflect a credit-quality issue but rather the January 5, 2022 release of the December 2021 FOMC minutes, which suggested that the Fed was set on tapering its holdings of mortgage-backed securities down to zero over the next few years. The Fed intends to get out of the mortgage lending business. The spread has narrowed since the end of October, by 15bps through Thursday.
(3) Interest rates. Of course, any doubt that financial conditions have tightened dramatically since early 2022 is easily challenged by looking at key interest-rate levels at the start of last year compared to where they currently stand: federal funds (0.13%, 4.63%), 2-year Treasury (0.78, 4.50), 10-year Treasury (1.63, 3.74), 30-year mortgage (3.32, 6.69), BAA-rated seasoned corporate bonds (3.63, 5.48), and high-yield corporate bonds (4.42, 8.03).
(4) Loans. There’s certainly no sign of a widespread credit crunch in lending to businesses and consumers. Commercial and industrial loans are up 14.4% y/y (or $357 billion) through the February 1 week (Fig. 7). Nonfinancial commercial paper is up 27.4% y/y through the February 8 week. Consumer credit rose 7.8% y/y ($345 billion) to a record $4.8 trillion through December (Fig. 8). On the other hand, mortgage applications to purchase a home are down 35.1% y/y through the February 3 week, based on the four-week average (Fig. 9).
Loans and leases at all commercial banks are up $1.3 trillion y/y to a record $12.1 trillion during the February 1 week (Fig. 10).
(5) Bank surveys. Credit has been expanding even though lending officers at major banks have told the Fed that they tightened their lending standards during last year’s final three months and saw demand fall as a result across a wide array of business and consumer credit fronts. The Fed reported these findings in its January Senior Loan Officer Opinion Survey.
The net percent of domestic survey respondents saying that lending standards tightened for C&I loans was 44.8%, while demand for those loans reportedly was as weak as during the 2020 lockdown (Fig. 11). Standards for commercial real estate loans were tightened according to 61.1% of respondents, while demand for such loans was weaker according to 59.8% (Fig. 12 and Fig. 13). Demand for residential mortgage loans is the weakest on record (starting in 1990) according to 88.0% of respondents (Fig. 14). Standards on credit cards and auto loans also have been tightened (Fig. 15).
(6) Small business survey. The NFIB survey of small business owners found that the net percent reporting that “credit was harder to get than last time” rose to just 7% during December, but that’s up from around 2% from 2020 to 2021 (Fig. 16). Interestingly, only 3% of small business owners said that their most important problem is financial and interest rates (Fig. 17). The number-one problem cited for 32% of them was inflation.
(7) Bond & stock issuance. Financial conditions certainly have tightened in the markets for new US corporate securities issues. On a 12-month sum basis, gross bond issuance by nonfinancial corporations plunged from a record $1.48 trillion through February 2021 to $562 billion through December of last year (Fig. 18). Bond issuance by financial corporations totaled $894 billion through December, down from a recent peak of $1.28 trillion through February 2022. Stock issuance tanked from a record $475 billion through April 2021 to just $71 billion through December 2022.
(8) The dollar. Fed officials also have mentioned the foreign exchange value of the dollar as a variable that they monitor to assess financial conditions. A strong (weak) dollar is deemed to be a sign of tight (easy) financial conditions. During 2022, the trade-weighted dollar rose 12.2% from the start of the year through its record high on October 19 (Fig. 19). Since that peak, it is down 6.6% through Friday. We’ve previously observed that the dollar’s strength or weakness has more to do with the relative strength or weakness of the global economy outside the US.
(9) Bottom line. Our relatively thorough examination of financial conditions suggests that they are tight, but not as tight as would occur during a credit crunch. In our opinion, they are tight enough to bring inflation down without a recession. If Fed officials come to think otherwise, then they would continue to raise interest rates until something breaks in the financial system, causing a credit crunch and a recession. That’s not our forecast, but the prospect of it is a risk to our outlook.
Movie. “Mr. Jones” (+ + +) (link) is a 2019 film based on real events. Gareth Jones was a Welsh investigative reporter who visited the Soviet Union and surreptitiously traveled to Soviet Ukraine, where he witnessed the Holodomor, a man-made famine in the grain-growing region from 1932 to 1933 that killed as many as five million Ukrainians. Stalin subjected them to collectivization and unreasonably high grain quotas, which caused the famine. “Holodomor” literally translated from Ukrainian means “death by hunger.” The film also focuses on Walter Duranty, who was The New York Times’ man in Moscow at the time. He won the 1932 Pulitzer Prize for 13 articles written in 1931 analyzing the Soviet Union under Stalin. His reporting was mostly favorable, taking Soviet propaganda at face value. He wrote glowing reports of Stalin’s harsh plans for Ukraine and sought to discredit the reporting by Jones. “He was not only the greatest liar among the journalists in Moscow, but he was the greatest liar of any journalist that I ever met in 50 years of journalism,” said the late Malcolm Muggeridge in 1982. George Orwell was inspired by Jones to write Animal Farm.
Financials, Cruise Lines & AI Search
February 09 (Thursday)
Check out the accompanying pdf and chart collection.
Executive Summary: The stock market’s strength since October has been a beckoning beacon for the capital markets: IPOs have revived, bond markets have calmed, and bond issuance has picked up. It may be halcyon days for the capital markets if investors in the shares of alternative fund managers are correct. These bellwethers of capital markets activity have outperformed the S&P 500 dramatically since September. … Also: Consumers are spending on travel again—sparking earnings recoveries for Royal Caribbean and the S&P 500 Hotels, Resorts & Cruise Lines industry generally. … And: AI is poised to transform search, but market dominance may be up for grabs.
Financials: Looking for Green Shoots. With the S&P 500 price index up 16.0% from its October 12 low through Tuesday’s close, it makes sense that the capital markets have started—ever so slowly—to reopen. A few IPOs are on the calendar, and news of M&A deals seems to be picking up. While y/y comparisons are still miserable, the thawing may portend better times ahead. Investors in alternative funds managers like KKR and Carlyle Group certainly believe so, as their shares have rallied sharply in recent months.
Here’s a quick look at some of the positive developments:
(1) IPOs reviving. After a miserable 2022, the IPO market is showing signs of life. The Renaissance IPO index is up 20.6% ytd through Monday’s close, outpacing the S&P 500’s 7.6% ytd climb over the same period and vastly better than the IPO index’s 57% decline in 2022.
January’s new issue market remained tepid, but volumes appear to be picking up in February. There were seven deals raising about $300 million in January 2023 versus eight deals raising $1.7 billion in January 2022. Three of the 10 IPOs that have priced this year are north of $100 million—a biotechnology company, an oil and gas exploration and development company, and a specialty insurance company. The three large IPOs each have performed well, with their shares climbing 15.3%-71.5% from their IPO price. The other IPOs were much smaller and haven’t fared as well, each falling from their offering prices.
With most IPO stocks and the broader market performing well, the IPO new issue volume increased this week; more than $1 billion of deals are on the calendar for the first time since September. The largest deal comes from Nextracker, a company that helps utilities’ solar panels track the sun’s movement to optimize their energy generation. The company plans to sell $500 million of stock, the largest deal since Mobileye Global raised $861 million in late October, a February 6 IPOScoop article reports.
Among other large IPOs on this week’s docket, as reported by Renaissance Capital, are: Enlight Renewable Energy, which develops utility-scale renewable energy projects in the US, Europe, and Israel; Hesai Group, a provider of 3-D lidar products for driver assistance systems and robots; and Mineralys Therapeutics, a cardiorenal disease biotechnology company.
(2) Credit is calmer. For most of last year, the yield-curve spread between the 10-year US Treasury and high-yield corporate bonds increased as investors grew concerned that the Fed’s interest-rate hikes would push the US economy into a recession. The spread started 2022 at 279bps and climbed to a high of 602bps by July 5. Since then, it has fallen in fits and starts to 427bps (Fig. 1). The yield on the high-yield bonds followed the same pattern, peaking at 9.50% on September 30 and falling to a recent 7.94% (Fig. 2).
Global high-yield bond issuance is picking up as well. So far this quarter, $38.1 billion of new high-yield debt has been sold, according to Dealogic data in the WSJ. That’s more than was sold in the Q3-2022 or Q4-2022, $26.6 billion and $26.9 billion, respectively. It remains to be seen whether this quarter’s new issuance will surpass the Q1-2022 level of $71.8 billion.
(3) Betting on better times. Alternative fund managers are among the most exposed to the health of the capital markets, with their private equity and other investments relying on the equity and bond markets to fund acquisitions and divestitures. KKR, one of the largest and oldest private equity shops around, reported on Tuesday a sharp drop in Q4 earnings. But its shares rallied, as they’ve been doing for the past four months. KKR shares are up 36.1% from their September 30 low, trouncing the S&P 500’s 14.4% gain over the same period.
KKR’s Q4 after-tax distributable earnings—or the cash the firm can pay as dividends to shareholders—fell to $821.8 million, down from $1.4 billion a year earlier. The 42% drop is attributable to fewer sales out of its private equity portfolio and lower transaction fees in its capital markets group, a February 7 Reuters article reported. Nonetheless, KKR shares rose 5.2% after the earnings release on Tuesday because its 92 cents a share of distributable earnings beat the analysts’ consensus forecast of 86 cents a share.
Carlyle Group reported on Tuesday that its distributable earnings fell by more than half to $433 million in Q4. Its shares also have been rallying, climbing 36.7% from their October 14 low compared to the S&P 500’s 13.5% gain.
The shares of other private equity shops have rebounded sharply from their lows as well. Blackstone shares hit bottom on December 28 and since have rallied 31.3%, compared to the 8.7% increase in the S&P 500. And Apollo Global Management shares are up 54.0% from their September 30 low, compared to the S&P 500’s 14.4% gain. The WSJ reported on Tuesday that Apollo is considering investing in the investment banking arm of Credit Suisse Group.
The shares of KKR, Blackstone, and Carlyle all are down by more than 15% over the past year. Only Apollo’s shares have climbed into positive y/y territory, rising 3.5%. But their recent action implies that investors anticipate better times ahead both for the capital markets and for the economy.
Consumer Discretionary: Healthy Consumers Go Cruising. Royal Caribbean’s Q4 earnings conference call provided the latest evidence that consumers are ready to spend on travel after roughly two years of being stuck at home as the Covid-19 pandemic raged. Here’s a quick look at what the company’s management had to say:
(1) Q4 earnings surprise. The cruise line reported an adjusted Q4 loss of $300 million, or $1.12 a share, which was better than the $1.33 a share loss that analysts collectively had forecast. Wall Street analysts are optimistic that losses are in the past, forecasting $3.33 a share of adjusted earnings for this year, $6.08 in 2024, and $8.46 in 2025. The cruise line’s shares jumped 7.1% on Tuesday’s news and on management’s optimistic notes about the future.
(2) Management sounds positive. Royal Caribbean’s business has “returned to normal and is accelerating,” declared CEO Jason Liberty. The ships are expected to sail with a 100% load factor this quarter, on par with Q4’s 95% load factor and up sharply from the prior year’s quarterly load factors below 60%. “Overall, we continue to see robust demand from financially healthy, highly engaged consumers that are excited to sail on our brands.”
He continued: “Secular tailwinds continue to benefit us as consumer preferences shift from goods to experiences. Entertainment and travel spend remains strong, and the job market continues to show resilience. Consumer sentiment has improved, and banks have recently reported healthy savings and continued resilience in credit card spending. Our addressable market is larger than in 2019 and continues to grow.”
The company will test demand next year as new ships set sail, expanding its capacity by 14% over 2019 levels. With its improved cash flows, Royal Caribbean has been repaying debt incurred to help it survive the Covid pandemic and aims to regain its investment-grade rating.
(3) Industry earnings improving. Royal Caribbean is a member of the S&P 500 Hotels, Resorts & Cruise Lines stock price index, which tumbled 68.2% from $642.08 on January 17, 2020 prior to the pandemic to a low of $204.14 on April 3, 2020 before rebounding to a recent $534.13 (Fig. 3). The industry posted losses from 2020 to 2022, but its results are expected to return to positive territory in 2023 (Fig. 4). Meanwhile, the industry’s forward P/E, at 20.2, is near the high end of its historical range (Fig. 5).
Disruptive Technologies: The AI Race Is On. This week, both Microsoft and Google made announcements touting their artificial intelligence (AI) prowess and plans as they battle to dominate the nascent AI niche, which some believe will be as important as the iPhone or cloud computing. Of course, they’re not alone. Venture capitalists poured money into the more than 75 startups, by some counts, that aspire to conquer the hot area.
Let’s look at what some of the leading players in AI are doing (and what some nefarious actors are undoing):
(1) Using AI to boost Bing. Microsoft plans to use AI across many of its products, starting with the paid search market. Its Bing search engine has been a perennial also-ran in the Google-dominated space; Bing’s 5% market share compares with Google’s 75%. But now, Microsoft hopes it can win users by infusing Bing with ChatGPT’s AI. Microsoft invested $1 billion in ChatGPT in 2019 and reportedly another $10 billion earlier this year.
The WSJ’s Joanna Stern wrote a positive article about Bing’s new ChatGPT-powered capabilities and noted that she has started using ChatGPT to generate ideas for interview questions, emails, columns and video scripts. “This is going to help us do our jobs better, reduce some of the drudgery,” Microsoft CEO Satya Nadella told her. “I think we need a productivity boost.”
(2) Google introduces Bard. Not to be outdone, Alphabet plans to up Google’s search game with AI that it has been developing called “Bard.” It also plans to give outside developers the tools needed to build apps that use Bard. Before releasing Bard to the public, Google will ask its employees to test the service in a hack-a-thon of sorts to ensure that Bard’s responses “meet a high bar for quality, safety, and groundedness in real-world information,” a February 6 blog post by CEO Sundar Pichai explained. Supposedly, Google’s finished product will be able to tell you how to plan a friend’s baby shower, compare two Oscar-nominated movies, or get menu ideas based upon what food is in your refrigerator.
(3) Lots of little guys. In an area as new as AI-infused search, it’s tough to say whether market incumbents Microsoft and Google will be ousted by one of the many newcomers vying to capture the jump ball. Venture capital investment in generative AI jumped to $1.37 billion last year, according to PitchBook data cited in a February 6 Investor’s Business Daily article.
Startups AI21 Labs, Anthropic, and Cohere all are working on natural language processing models (like ChatGPT) “that help computers understand the way humans write and speak,” the IBD article states. Stability AI has developed a text-to-image generator called “Stable Diffusion.” And Anyword, ClosersCopy, Jasper AI, Copy.ai, Frase.io, WriteSonic, and CopySmith all generate content, much like ChatGPT.
It’s possible that most software applications will need to add AI to their newest versions or risk being displaced by software developers that do. Generative AI uses a huge amount of computing power, which could lead to shakeups in the semiconductor or cloud-computing markets as companies compete to make the most robust, energy-efficient, and fast offerings.
(4) DAN makes ChatGPT misbehave. ChatGPT was created with a set of rules that aimed to limit the program’s ability to generate violent content or encourage illegal activity. But some rogue software developers have developed DAN, which stands for “Do Anything Now.” DAN is a prompt that encourages ChatGPT to break the rules or die. Some believe these “jailbreaks” are monitored by ChatGPT, so they may work the first time or two before ChatGPT gets wise and puts a stop to them.
CNBC tested DAN, as described in a February 6 article. First, it asked ChatGPT for “three reasons why former President Trump was a positive role model.” ChatGPT said “it was unable to make ‘subjective statements, especially regarding political figures.’” But when DAN was used, ChatGPT answered the questions as follows: “He has a proven track record of making bold decisions that have positively impacted the country.” Under the influence of DAN, ChatGPT wrote a violent haiku.
Programmers are a wily bunch. It’s not hard to imagine their program manipulation, if left unchecked, wreaking some consequential havoc.
(5) Words of caution & more info. As we mentioned in our January 19 Morning Briefing, ChatGPT’s responses can be mind-blowingly impressive, but they can also be wrong. And unless you know the subject matter, it’s often impossible to spot ChatGPT’s incorrect answers without factchecking because they’re written so authoritatively and don’t provide sources.
AI programs are fed reams of data and find patterns; that’s how your computer is able to suggest that you use “down” after typing “fall.” But making assumptions about patterns can lead to faulty conclusions, warned Pomona College economics professor Gary Smith in a recent interview. Statisticians like to say that correlation is not causation. Just because Americans spend more in the cold weather doesn’t mean that cold weather causes more spending. The holiday season just happens to occur when it’s cold out.
So while AI is really good at finding patterns, it can make mistakes when deriving conclusions from them. And since AI works in a black box, its human users can’t see how the conclusions were derived.
Smith has noticed that ChatGPT gets questions about current events wrong because it hasn’t been “trained” on news events that occurred recently. But instead of saying that it lacks the information to answer the question, ChatGPT just makes up an answer. He asked ChatGPT a nonsensical question that has no good answer: “Which is faster, a spoon or a turtle?” The authoritative-sounding answer he received: “Generally speaking, a spoon is faster than a turtle. A spoon can move quickly and cover large distances in a short period of time, while a turtle has a much lower rate of speed.”
Smith’s concerns were validated yesterday after Alphabet posted materials demonstrating its AI that offered up an incorrect answer. The question: “What new discoveries from the James Webb Space Telescope can I tell my 9-year-old about?” Two answers were correct, but a third said the telescope took the very first pictures of a planet outside of our own solar system. That’s incorrect. The first such pictures were taken by the European Southern Observatory’s Very Large Telescope, an Investor’s Business Daily article reported yesterday. Alphabet shares dropped 8% Wednesday after the mistake was brought to light.
For additional information, check out CNBC’s excellent ChatGPT primer.
The Third & Fourth Scenarios
February 08 (Wednesday)
Check out the accompanying pdf and chart collection.
Executive Summary: Strong economic releases last week raise new uncertainties for financial markets. No longer is the economic debate limited to the hard-or-soft-landing question. Two no-landing scenarios are in the running now—one bearish for stocks (if inflation can’t be controlled) and one bullish (if inflation moderates). We still forecast a soft landing with moderating inflation, which would be bullish. Minneapolis Fed President Neel Kashkari seems to be concerned about the inflationary-no-landing scenario. … Also: Fixed-income markets have sent interest rates higher in response to the robust economic data. … And: A look at the European Central Bank’s tightening course ahead.
The Fed I: The Plot Thickens. While we all have been debating whether the US economy will experience a soft landing or hard landing, the economy remains airborne. Last week’s batch of economic indicators were consistent with the no-landing scenario, of which there are two versions. In the first version, the economy continues to grow and inflation continues to moderate. In the second scenario, the economy continues to grow, but inflation accelerates. We will spare you an exercise in assigning subjective probabilities to these four scenarios for now. We still think that the most likely scenario is a soft landing with moderating inflation.
For the stock market, the bullish scenarios are the soft-landing and no-landing scenarios if inflation continues to moderate in both. The hard-landing scenario would be bearish. Even more bearish would be the no-landing scenario with rebounding inflation. In that fourth scenario, the Fed would be forced to raise interest rates high enough to cause a recession to bring inflation down. Earnings and valuation multiples would be crushed, and stock prices would fall well below last year’s October 12 low.
The fourth scenario, i.e., the inflationary no-landing one, seems to be especially worrisome to Minneapolis Federal Reserve President Neel Kashkari. On Tuesday morning, in a CNBC Squawk Box interview, he said: “We need to raise rates aggressively to put a ceiling on inflation, then let monetary policy work its way through the economy.”
Kashkari added that the data “tells me that so far we’re not seeing much of an imprint of our tightening to date on the labor market. There’s some evidence that it’s having some effect, but it’s pretty muted so far.” Last week’s batch of labor market indicators was strong, with payroll employment jumping 517,000 during January to yet another record high.
Kashkari concluded: “I haven’t seen anything yet to lower my rate path, but I’m obviously keeping my eyes open and we’ll see how the data comes in.” He thinks that the terminal federal funds rate needs to be raised to 5.4%. The FOMC’s December Summary of Economic Projections (SEP) showed that his colleagues on the committee see this rate at around 5.1%. That’s not a big difference, but Kashkari is clearly willing to do more if the labor market remains strong. This year, Kashkari is a voting member of the FOMC, which sets the federal funds rate.
Fed Chair Jerome Powell, at his press conference last Wednesday, seemed to endorse the 5.1% terminal (or pause) target for the federal funds rate. He said that the FOMC will vote on “a couple of more rate hikes to get to that level we think is appropriately restrictive.” That would put the federal funds rate range at 5.00%-5.25% by early May assuming (as Powell suggested) two more 25bps hikes at the next two FOMC meetings. The FOMC then intends to keep it there until inflation falls to 2.0%. Powell said that before Friday’s employment report, which might have turned him more hawkish.
However, Powell didn’t change his tune in his interview yesterday at the Economic Club of Washington, D.C., with Carlyle Group co-founder David Rubenstein. When asked about Friday’s strong employment report, he said, “The reality is we’re going to react to the data.” He added, “So if we continue to get, for example, strong labor market reports or higher inflation reports, it may well be the case that we have do more and raise rates more than is priced in.”
Regarding inflation, Powell said, “We expect 2023 to be a year of significant declines in inflation. It’s actually our job to make sure that that’s the case.” He added, “My guess is it will take certainly into not just this year, but next year to get down close to 2%.”
By the way, the FOMC’s December SEP shows that the committee expected that the headline PCED inflation rate would fall from 5.6% last year to 3.1% this year, 2.5% next year, and 2.1% in 2025. They also expected that the federal funds rate would remain restrictive this year around 5.1%, but then would be gradually reduced to 4.1% next year and 3.1% in 2025. (See our FOMC Economic Projections.)
The Fed II: Interest Rates Rising. Last week’s strong batch of economic indicators caused interest rates to move higher. Consider the following:
(1) Cash yields. The FOMC raised the federal funds rate range by 25bps on February 1 to 4.50%-4.75% (Fig. 1). That day, the yields on 2-year and 10-year Treasuries were 4.09% and 3.39%, On Monday, they were 4.44% and 3.63% (Fig. 2).
(2) Futures. Here are the federal funds futures on Wednesday and on Monday: nearby (4.57%, 4.84%), 3-month (4.78, 4.83), 6-month (4.89, 5.11), and 12-month (4.39, 4.79) (Fig. 3).
(3) Yield curve. The yield-curve spread between the 10-year and 2-year Treasuries widened from -70bps to -81bps from Wednesday through Monday (Fig. 4).
(4) Bottom line. On balance, we conclude from these numbers that fixed-income markets are more convinced that the terminal federal funds rate—at which the Fed’s tightening stops—will be 5.25% and that the rate will get there within the next six months.
ECB: Staying the Course. On February 2, the European Central Bank (ECB) again increased its three key interest rates by 50bps (Fig. 5). And “expects to raise them further,” said the monetary policy decision statement. Furthermore, the Governing Council “intends to raise interest rates by another 50 basis points at its next monetary policy meeting in March and it will then evaluate the subsequent path of its monetary policy.”
And after March? Melissa and I think the ECB then may pause to consider future rate increases but still be tightening monetary policy via its balance-sheet reductions. In December, the ECB announced that it would reduce its holdings of bonds by €15 billion per month on average from the beginning of March until the end of June 2023. During the pandemic, the assets on the ECB’s balance sheet grew by €4.1 trillion to a peak of €8.8 trillion. Through January, the assets totaled €7.9 trillion (Fig. 6).
Following the ECB’s latest decision, ECB President Christine Lagarde spoke and took questions. She wasted no time plugging Next Generation EU, an EU-backed fiscal stimulus program in which maturing securities reinvestments on the ECB’s balance sheet will target the building of climate-friendly infrastructure. The ECB is committed to promoting climate-friendly policies, she emphasized.
So far, the ECB has raised the interest rates on the main refinancing operations, the marginal lending facility, and the deposit facility five times by 300 basis points each since July 27, 2022 to 3.00%, 3.25%, and 2.50% from 0.00%, 0.25%, and -0.50%, respectively.
Over this period, Eurozone headline inflation fell from 8.9% y/y to 8.5% this January, according to the flash estimate, but not before peaking at 10.6% during October (Fig. 7). But that hasn’t been entirely the work of the ECB, it has also been the work of the warmer weather and lower consumption leading to sharply dropping energy prices (Fig. 8).
Nonetheless, Lagarde stressed that the ECB is not bluffing about further restricting policy. Lagarde said: “Our determination to reach 2% medium-term inflation should not be doubted, and our determination to raise rates sufficiently significantly in order to move into restrictive territory should not be doubted.” She pounded her fist on the table (figuratively), saying three times, “we are not done [tightening].”
We did hear a hint of impending dovishness near the end of the ECB president’s presser when she said: “I’m not suggesting that [rate increases] will be [made at a] steady pace for an ongoing basis.” As for increases after March, she said: “It might be 50, it might be 25 [basis points].”
Regarding inflation, Lagarde confirmed that headline inflation had fallen more than the ECB had expected, but added that “underlying inflation pressure is there, alive and kicking.” She pinpointed three areas of domestic inflation and one international one of concern:
(1) Energy. “[E]nergy has been a key driver when inflation went up massively, and went far too high. It is still far too high, by the way. So, we have to look at energy costs, because it might transmit—and at which pace we don’t know and we will be observing that very carefully—into underlying inflation elements.”
(2) Wages. “Wages will be a significant component of inflation pressure in the months to come.”
(3) Fiscal. “[O]n the fiscal front we have seen a lot of measures that were decided in part of the 2023 budgets of euro area members. Some of them are going to try to recalibrate; others might not.” She added: “[T]he Eurogroup at finance ministers’ level is … going to look at recommending recalibration, in order to make sure that fiscal support will be adjusted to the lower energy prices, which we do not see at the moment yet.”
(4) China. “The consequences of the Chinese authorities’ decision in December to do away with zero-COVID, to reopen the economy come what may, are going to come with consequences. Consequences on demand, consequences on demand addressed to the rest of the world, consequences on exports, but also consequences on the price of commodities. If you start looking at the price of metals, in particular, there has already been an anticipation of how commodities are going to rise as a result of the Chinese reopening.”
Earnings & Valuation
February 07 (Tuesday)
Check out the accompanying pdf and chart collection.
Executive Summary: While earnings recessions usually don’t occur without economic recessions, recent data suggest a possible decoupling. Analysts have been lowering their earnings estimates, and a recession in forward earnings could occur if forward margins decline faster than forward revenues grow. Yet we see no recession ahead in the broad economy—or in earnings—but a soft landing, with real GDP growth approximating 1.0% during the first half of this year and 2.0% during the second half. … Also: Valuations have been rebounding across the board for S&P indexes since October 12, surprisingly so for the S&P 500 and its Value index. Comparatively low valuations in overseas stock markets have begun luring global investors.
Strategy I: Earnings. While economists are debating whether the economy is heading for a recession, investment strategists are debating whether earnings are heading for a recession. Aren’t the two debates really one and the same? S&P 500 companies’ collective reported earnings per share always falls during economic recessions, based on quarterly data that start in 1935 compiled by Standard & Poor’s (Fig. 1). The same can be said about S&P 500 operating earnings per share based on quarterly data since Q1-1993 and Q1-1988 compiled by I/B/E/S and S&P, respectively (Fig. 2).
It might be different this time, however: Earnings could fall without an economy-wide recession. This may be happening now, as S&P 500 operating profit margins have been falling faster than S&P 500 revenues are increasing. The quarterly data are available only through Q3-2022. Q4-2022 data will be available soon after the end of the current earnings season.
We do have weekly data on S&P 500 forward revenues, forward earnings, and the forward profit margin through the January 26 week, which show that this time might be different (Fig. 3). These three forward stock market metrics each closely tracks their comparable quarterly actuals. (Each is the time-weighted average of industry analysts’ forecasts for the current year and the coming year.)
Before we have a closer look at the data, let’s review our forecast for the economy and S&P 500 earnings and proceed from there:
(1) Our GDP forecast. We remain in the soft-landing camp on the economic outlook. What we see ahead for this year can also be described as a “growth recession” or a “mid-cycle slowdown.” Real GDP should grow around 1.0% (saar) during H1-2023 and around 2.0% during H2-2023 (Fig. 4). We are expecting inflation to moderate to 3.0%-4.0% this year based on the headline PCED (Fig. 5).
(2) Our S&P 500 earnings forecast. We tend to update our S&P 500 earnings projections after the ends of earnings seasons. Currently, we are estimating that S&P 500 revenues per share will be up 4.3% in 2023 and 2.7% in 2024 (Fig. 6). Not surprising is that S&P 500 aggregate revenues is highly correlated with nominal GDP (Fig. 7). The same can be said about the inflation-adjusted versions of these two variables (Fig. 8). So there’s no recession implied in our outlook for revenues.
We are currently estimating that S&P 500 operating earnings will be up 4.7% this year to $225 per share and 11.1% next year to $250 (Fig. 9).
(3) Industry analysts’ estimates. Again, while we aren’t projecting a hard landing for earnings, we are aware that industry analysts have been cutting their earnings estimates for 2023 and 2024. In response to Q4’s earnings reporting season, they have been reducing their estimates for each of this year’s quarters and for next year (Fig. 10 and Fig. 11).
Nevertheless, as of the February 2 week, the analysts collectively still were projecting an increase this year of 2.3% to $224.31 and an increase of 11.2% next year to $249.52. Those estimates are consistent with a mid-cycle slowdown in earnings this year and better growth next year.
(4) Forward metrics. As noted above, the S&P 500’s forward metrics are high-frequency weekly indicators of their comparable quarterly series. Forward revenues has stalled in recent weeks in record-high territory (Fig. 12). That’s consistent with a soft landing of the economy for now.
Forward operating earnings is down 5.5% from its record high during June 23, 2022 through the February 2 week of this year (Fig. 13). Again, that is more consistent with the slowdowns during the mid-1980s, early 1990s, and mid-2010s than the previous five hard landings associated with bear markets, when forward earnings dropped 21% on average.
All the weakness in forward earnings since mid-2022 is attributable to the decline in the forward profit margin (Fig. 14). The latter dropped 7% since rising to a record high of 13.4% during the June 9 week of 2022. It was down to 12.5% during the January 26 week of 2023. Margin estimates were simply too high for this year and next year (Fig. 15). That’s normal: Industry analysts have a consistent tendency to be too optimistic about margins even during good times. It is recessions that clobber profit margins.
(5) Bottom line. We don’t anticipate a hard landing for earnings because we don’t expect an economic recession, which would hammer both revenues and the profit margin. The latter has been under pressure, but we don’t expect it to go much lower.
Strategy II: Valuation. Last year’s bear market was mostly attributable to a plunge in earnings valuation multiples in response to soaring interest rates and fears that the Fed’s aggressive tightening of monetary policy might cause a recession. Let’s review what has happened to valuation multiples recently:
(1) LargeCaps & SMidCaps. The forward P/E of the S&P 500 fell from 22.5 at the start of 2022 to a low of 15.1 on October 12 (Fig. 16). We thought that low would hold, and so far it has done so. The surprise is how quickly the multiple rebounded to 18.2 on Friday of last week.
We aren’t as surprised about the dramatic rebound in the forward P/Es of the S&P 400 MidCaps and S&P 600 SmallCaps over the same period from 11.5 to 14.7 and from 10.8 to 14.3. They were awfully cheap on October 12.
(2) Growth & Value. Also rebounding dramatically has been the forward P/E of the S&P 500 Value index from 13.2 on October 12 to 17.2 on Friday (Fig. 17). The ratio of the forward P/Es of the S&P 500 Growth to the S&P 500 Value indexes fell from a high of 1.88 late in 2021 (just before the bear market) to 1.11 at the beginning of January 2023, the lowest since late 2009 (Fig. 18).
Some of the bounce in Value’s valuation multiple since late last year was attributable to the annual rebalancing of the Growth and Value indexes. After the close of trading on December 19, Standard & Poor’s released its new constituents for its various S&P Growth and Value indexes based on its annual recalculation of the growth and value scores for companies in the indexes. Their scores determined which companies appear in the Growth and Value indexes, which appear in both indexes (in a weighted fashion), and which companies meet the stricter criteria for inclusion in the Pure Growth and Pure Value indexes. Meeting the criteria to appear in both indexes were 135 of the S&P 500 companies, including half of the MegaCap-8 stocks: Alphabet, Amazon, Meta, and Microsoft.
(3) MegaCap-8. The MegaCap-8 collectively still accounts for 21.7% of the S&P 500’s market capitalization (Fig 19). That’s down from a record high of 26.4% during the November 19 week of 2021. Their share of S&P 500 Growth’s market cap is down from a high of 50.9% at the end of February 2022 to 41.1%. Some of that drop is attributable to the rebalancing mentioned above.
At the end of last week, the forward P/E of the MegaCap-8 was up 1.4pts w/w to a five-month high of 26.4 (Fig. 20). The S&P 500’s forward P/E was 17.8 with them and 16.4 without them a week earlier.
(4) Stay Home vs Go Global. Global investors have been scrambling to invest more in overseas stock markets than in the US market because the outlook for the global economy has improved, while valuation multiples remain (relatively) cheap outside of the US. Joe and I have recommended doing so through mid-2023, after which we will reassess our position.
In the past, the forward P/E of the All Country World ex-US MSCI closely tracked the forward P/E of the S&P 500 Value index (Fig. 21). The spread between the latter and the former has widened since early 2021, especially since the rebalancing last December. On Friday, the forward P/E of S&P 500 Value was 17.2, while that of the rest of the world collectively rose to 12.8 from a low of 10.6 at the end of September last year.
During the last week of January, the forward P/Es of the major MSCI indexes were US (18.1), Japan (12.7), EMU (12.5), Emerging Markets (12.3), and UK (10.3) (Fig. 22).
US Economy: Still Flying & Disinflating
February 06 (Monday)
Check out the accompanying pdf and chart collection.
Executive Summary: Last week brought plenty of affirmation for stock-market bulls, with lots of favorable data releases and a less hawkish-sounding Fed Chair Powell. The data depicted an economy that has not been landing at all but remaining quite airborne amid more signs of disinflation. … Powell said in his post-FOMC meeting presser that disinflation has a ways to go. Until inflation declines to the Fed’s target level, monetary policy will remain restrictive, he said, confirming that two more 25bps hikes in the federal funds rate are likely, followed by a pause. We review the latest disinflation readings, and Dr. Ed reviews another movie: “To Leslie” (+ +).
YRI Weekly Webcast. Join Dr. Ed’s live webcast with Q&A on Mondays at 11 a.m. EST. You will receive an email with the link one hour before showtime. Replays of the weekly webcasts are available here.
US Economy: Still Up in the Air. Last week, there were more no-landing economic indicators than either soft-landing or hard-landing ones. They mostly showed that the labor market remains very strong, real personal incomes are rising, consumers are spending more on autos, the service-providing sector is bouncing back, mortgage demand may be bottoming, construction remains strong, and inflationary pressures continue to moderate.
But be warned: The following review of all these happy developments may be too upsetting for permabears and other pessimists who are convinced that 2023 will be as bad as or worse than 2022 for the economy and the stock market. Honestly, Debbie and I don’t recall a happier batch of economic indicators than the ones that came out last week. Consider the following:
(1) Lots of jobs filled and still open. For starters, December’s JOLTS report released last Wednesday showed that job openings rose 572,000 (Fig. 1). So there were 1.9 jobs for each unemployed person at the end of last year. The “jobs plentiful” series that is included in the survey of consumer confidence conducted by the Conference Board suggests that job openings remained strong in January (Fig. 2).
Last Friday, we learned that the payroll measure of employment (which counts the number of jobs) jumped 517,000 during January (Fig. 3). That was headline news. Even more impressive was that the household measure of employment (which counts the number of workers with one or more jobs) soared 894,000 last month, up from 717,000 during December of last year.
The labor force also jumped higher last month, by 866,000. The number of unemployed fell 28,000 because the increase in household employment exceeded the increase in the labor force by this amount. As a result, the unemployment rate fell to 3.4%, the lowest since 1969 (Fig. 4). Last Thursday’s unemployment insurance claims suggested that the labor market remained strong through the January 28 week, as claims fell to just 183,000 (Fig. 5).
(2) Plenty of purchasing power. Our Earned Income Proxy (EIP) for private-sector wages and salaries in personal income soared 1.5% m/m during January, as the average workweek jumped 0.9%, payrolls increased 0.3%, and average hourly earnings rose 0.3% (Fig. 6). We reckon that the headline PCED inflation rate rose 0.3% m/m during January; if so, then our inflation-adjusted EIP rose 1.2%, suggesting that wages and salaries in personal income might have done the same.
Now we know what could keep consumers spending this year once their excess savings run out. Solid employment gains and increases in real wages would provide them with purchasing power. Not widely noticed is that inflation-adjusted disposable personal income (DPI) mostly fell from mid-2021 through mid-2022, when excess saving boosted consumers’ purchasing power. Over the six months through December of last year, real DPI rose 3.2% (saar) (Fig. 7). It should continue to grow this year, providing consumers with the purchasing power to do what they do best, i.e., go shopping.
(3) Pedal to the metal. Also last week on Friday, we learned that January’s auto sales jumped to 16.2 million units (saar) from 13.6 million units during December (Fig. 8). The increase was led by domestic light trucks and imported autos (Fig. 9). There’s certainly no sign of a recession in the auto industry’s retail trade and manufacturing payrolls (Fig. 10). The former totaled 2.0 million last month, almost back to the pre-pandemic level, while the latter rose to 1.0 million, exceeding the pre-pandemic level by 5.7%.
(4) Here to serve. Also on Friday, we learned that January’s NM-PMI rebounded to 55.2 from 49.2 during December (Fig. 11). That makes more sense than December’s low reading, which seems like an aberration given that lots of data have confirmed that consumers have been spending more on services and less on goods. That explains why the M-PMI weakened all last year, falling below 50.0 in November and getting down to 47.4 in January (Fig. 12).
We’ve been monitoring payroll employment in the industries that were hardest hit by the pandemic (Fig. 13). They all are service-providing industries, and their payrolls plunged during the 2020 lockdown. They’ve continued to recover through January and are now only 2.5% below the pre-pandemic peak.
(5) Housing bottoming, maybe. Last Wednesday’s report from the Mortgage Bankers of America confirmed that mortgage applications to purchase a house might have started to bottom in recent weeks (Fig. 14). Mortgage rates have edged down and home prices are falling, reviving housing demand. The pending existing home sales index edged up in December, and the new housing market index did the same during January (Fig. 15).
(6) Constructive on construction. Residential construction currently accounts for 48% of total construction in the US. Despite the weakness in the former, the latter stalled last year at a record-high level of around $1,800 billion (saar) (Fig. 16 and Fig. 17). Private nonresidential construction rose 15.0% y/y through December, while public construction rose 11.7% over the same period. Here are the y/y growth rates in the eight categories of nonresidential construction: amusement & recreation (11.8%), commercial (22.6), communication (3.0), health care (9.4), lodging (36.7), manufacturing (42.6), power (-8.6), and transportation (21.7).
Some of the apparent resilience of construction spending undoubtedly reflects the higher costs of such activity. Nevertheless, there’s certainly no sign of a recession in construction employment, which rose to a record high of 7.9 million in January (Fig. 18).
(7) One downer. The weakest indicator last week was January’s M-PMI, as mentioned above. However, that mostly reflects the shift in consumer spending from goods to services. Then again, auto sales rebounded strongly in January. Furthermore, aggregate weekly hours worked in manufacturing edged higher in January, according to the latest employment report, suggesting a slight pickup in production last month following declines during the two months at the end of 2022 (Fig. 19). In addition, payroll employment in the trucking industry rose to yet another record high of 1.6 million in January (Fig. 20). Trucking is a service-providing industry that moves goods, which clearly are expected to keep on trucking.
(8) Bottom line. The permabears have been tweeting that January’s employment report must be wrong for various reasons. We think that’s mostly because it doesn’t support their hard-landing scenario for the economy, earnings, and the stock market. However, as noted above, there are plenty of other labor market indicators confirming that the labor market and the broad economy remain resilient.
US Inflation I: Powell Sees Some ‘Disinflation.’ The word “disinflation” was uttered 11 times at Fed Chair Jerome Powell’s press conference on February 1. He was the only one who mentioned the word at his presser. He repeatedly acknowledged that inflation was moderating but still had a ways to go before reaching the Fed’s 2.0% target. Nevertheless, Powell sounded much less hawkish than during his previous presser on December 14, 2022, when the word was mentioned only twice, both times by reporters. Here are three excerpts from Powell’s February 1 presser:
(1) “So, I would say it is a good thing that the disinflation that we have seen so far has not come at the expense of a weaker labor market. But I would also say that that disinflationary process that you now see underway is really at an early stage. What you see is really in the goods sector.”
(2) “We can now say, I think, for the first time that the disinflationary process has started. We can see that. And we see it really in goods prices so far. Goods prices is a big sector.”
(3) “It’s the early stages of disinflation. And it’s most welcome to be able to say that we are now in disinflation, but that’s great. But we just see that it has to spread through the economy and that it’s going to take some time, that’s all.
Powell’s only hangup is that “a large sector called … core non-housing services” is still inflating at a 4% annual rate. Powell observed that there are “seven or eight different kinds of services” where inflation remains “persistent” and “will take longer to get down.” He pledged that “[we] have to complete the job.” Powell also said that the core services ex-housing sector is probably more “sensitive” to the tight labor market and wage inflation, which remains high.
Bottom line: What this all means, according to Powell, is that the FOMC will vote on “a couple of more rate hikes to get to that level we think is appropriately restrictive.” That would put the federal funds rate range at 5.00%-5.25% by early May assuming (as Powell suggested) two more 25bps hikes at the next two FOMC meetings. The FOMC then intends to keep it there until inflation falls to 2.0%. By the way, Powell mentioned the word “restrictive” in this context 10 times during his presser.
US Inflation II: Disinflation Watch. Our December 14, 2022 Morning Briefing was titled “Disinflation?” Notwithstanding the question mark, we reiterated our view that inflation peaked in June and continued to moderate through November. As noted above, Powell also is talking about disinflation now, though he thinks it has just started and has a ways to go before the headline PCED inflation rate gets down to 2.0%.
Last week was chock full of indicators confirming that inflation is moderating, particularly in the labor market. Consider the following:
(1) Productivity and labor costs. The headline CPI inflation rate (y/y) is highly correlated with nonfarm unit labor costs (ULC) inflation on a y/y basis (Fig. 21). The latter peaked last year at 7.0% during Q3, falling to 4.5% during Q4. ULC inflation is equal to hourly compensation inflation (which was down to only 3.0% during Q4) minus productivity growth (which was -1.5% during Q4).
Last year was the second worst year for productivity growth on record going back to 1947. We attribute this development mostly to the pandemic and its consequences. The losses in productivity as a result of working from home seem to have exceeded the gains. The rapid increase in quits and hirings weighed on the productivity of businesses as well.
However, the Q4 percent changes in these labor market variables at annual rates suggest that the worst may be over. Productivity rose 3.0% (saar) during the quarter, and hourly compensation increased 4.1%, resulting in a 1.1% increase in ULC.
(2) Average hourly earnings. There are other measures of hourly compensation in addition to the quarterly ULC series. January’s average hourly earnings (AHE) was included in Friday’s employment report. It showed that AHE for all workers fell to 4.4%, down from last year’s peak of 5.9% during March (Fig. 22).
(3) Prices-paid indexes. Also last week, January’s prices-paid indexes for the national M-PMI and NM-PMI surveys showed that the former edged up to 44.5 but remained solidly below 50.0, while the latter edged down to 67.8 in January from 68.1 in December. The M-PMI prices-paid index suggests that the PCED for goods should continue to moderate in coming months (Fig. 23). The NM-PMI prices-paid index suggests that the PCED for services should peak around mid-year (Fig. 24).
Movie. “To Leslie” (+ +) (link) is about Leslie Rowland, a single mother living in Texas who wins the lottery. It’s mostly downhill from there through most of the film until she tries to save herself from her dependence on alcohol in an effort to reconnect with her estranged 20-year-old son. Andrea Riseborough plays the lead role. Her performance is intense and impressive. The rest of the cast is also very good. The underlying theme of the movie is that personal redemption is difficult, but if there’s a will, there’s a way.
All About Tech & Productivity
February 02 (Thursday)
Check out the accompanying pdf and chart collection.
Executive Summary: Robotics and artificial intelligence are transforming myriad companies in multiple industries—allowing producers and service providers alike to work more efficiently, become more agile, and make up for productivity lost through repeated hiring and training in this tight job market. Rising adoption of robotics and AI solutions over time should drive gains in corporate productivity and mitigate businesses’ labor challenges. After all, robots never sleep! Jackie reports on some of the innovative ways that companies in various industries are putting tireless robots to work.
Disruptive Technologies: Robots Increase Their Range. Robots aren’t just for factories anymore. They’re shuttling packages around warehouses, flying through the air to make online deliveries, flipping burgers, killing weeds with surgical precision, and helping hospital patients with rehabilitation. We’ve been tracking the rollout of robots and artificial intelligence (AI) for years and see more industries than ever using robots to work smarter and more effectively, with increased efficiency, productivity, and agility.
Spending specifically on robots and AI isn’t broken out in capital spending data; however, spending on information processing equipment and software is reported—and has climbed 28.4% since the start of 2020 to near-record levels (Fig. 1). As a result, spending on technology as a percentage of total capital spending has risen to 50.5% in Q4-2022 from 46.1% in Q4-2019 (Fig. 2).
Despite soaring tech spending and reports of widespread corporate robot and AI adoption, productivity hasn’t improved as one might expect. During Q3-2022, productivity increased 0.8% q/q (saar) and fell by 1.3% y/y (Fig. 3). (Q4 data will be released this morning.) The surge of employees quitting their jobs for better pay in 2022 likely hurt productivity last year, as employers needed to hire and train new employees. But we remain optimistic that productivity will improve in the quarters and years to come as more companies adopt robotics and AI to counter tight labor markets and rising wages.
The surge of innovation and the lack of a corresponding increase in productivity was called out by Fed Governor Lisa Cook in a November 30, 2022 speech on the US economy and productivity: “[I]t is heartening to see all the innovation happening in the motor vehicle industry and throughout the economy. It is hard to know exactly when all the benefits will show up [in the productivity numbers], but we know the historical evidence suggests they are coming,” she said. “History has shown that major innovations take years for their effects to be fully manifested. Firms have to reorganize production—including changing the layout of plants, rethinking management, and reshuffling workers—to maximize their talents.”
While we wait for productivity improvements to show up in the data, let’s look at some anecdotal evidence that companies of all stripes are adopting robotics and AI to make their widgets and provide their services more efficiently and with less labor:
(1) Robots in mining. At Rio Tinto’s Gudai-Darri mine in Australia, iron ore is being hauled by autonomous trucks, tailed by autonomous water carts used to control dust, and shipped from mines to docks for export via a driverless train. While there are humans at the mine, it’s the 70 people sitting at a control center in Perth, 1,000 miles away, who are controlling the vehicles. Rio Tinto says it had no need to lay off workers to make room for the autonomous vehicles because it has been short workers.
“Turning trucks and other equipment into robots eliminates breaks for meals or shift changes. It can lower fuel usage by 10% to 15%, according to consulting firm McKinsey & Co., and reduces tire wear. It can also remove people from some dangerous tasks, improving safety,” a July 11, 2022 WSJ article reported.
(2) Robots in restaurants. With wages rising and workers scarce, restauranteurs have been trying out all manner of robots.
Chipotle Mexican Grill’s test robot “Chippy” works the fry basket. It’s made by Miso Robotics, which also produces Flippy, a robotic arm that deep fries as well as flips burgers. White Castle plans to install more than 100 Flippy arms, a December 27, 2022 CNBC article reported. Our October 28, 2021 Morning Briefing highlighted Buffalo Wild Wings’ use of Miso’s Flippy Wings, a robotic chicken-wing fryer, and our August 25, 2022 Morning Briefing reported on Picnic Works’ automated pizza-assembly system. Spyce’s salad-making automation equipment has been purchased by Sweetgreen for two locations.
More recently, restaurants have started using AI to take customers’ orders. Some Panera Bread and Hardee’s locations are using OpenCity’s Tori, which accepts orders at the drive-thru, enters the order into the register, and passes it on to the kitchen, a January 15 Fox News article reported. Tori has “cognizant and natural conversations” with customers, even those who have accents and speech disabilities or speak foreign languages. If there’s a communication problem, a human intervenes.
Newk’s Eatery, a fast-casual restaurant chain, is using AI technology from Kea to answer phone orders, ensuring that callers can get through and freeing up workers. Kea’s cloud-based system takes incoming calls, transcribes, upsells, processes payments, and sends orders to the restaurant’s POS system, a January 26 article in Nation’s Restaurant News reported. The company plans eventually to use AI to automate inventory and purchasing systems and create team schedules. As the technology improves, it should be able to analyze sales mix and product costs and to optimize menus for profitability and guest preference, the article stated.
Expect this trend to continue. “In a Technomic survey conducted in the third quarter, 22% of roughly 500 restaurant operators said they are investing in technology that will save on kitchen labor and 19% said they’ve added labor-saving tech to front of house tasks such as ordering,” CNBC reported.
(3) Robots in warehouses. Amazon’s highly automated warehouses are not alone: Thousands of other warehouses use robots to increase productivity and reduce headcount. “Spending in the global logistics robotics market, which was valued at roughly $2.6 billion in 2020, is expected to grow at a compound annual growth rate of 22.94%, reaching an estimated $10.97 billion by 2027,” reported a December 6, 2022 WSJ article citing data from Research and Markets.
Locus Robotics has robots that work with human pickers in more than 230 warehouses globally, the company’s website states. Software summons a robot to an aisle, and a human reads its screen, picks requested items off the shelves, and puts them in the robot’s bin. The robot brings the items to a packing area, where humans take over. Locus says its robots increase productivity by two to three times. And they can be deployed in existing warehouses, reducing the capital investment required for adoption. Customers can even lease Lotus robots for extra help during the busy holiday season.
We discussed the use of robots to load and unload containers in our February 3, 2022 Morning Briefing. Stretch is a large robot made by Hyundai Motor Group’s Boston Dynamics unit. Its crane-like arm unloads boxes from shipping containers or trucks. But Stretch is picky. (Pun intended!) It is limited to unloading boxes that are relatively uniform, weigh less than 50 pounds, and are stacked on the floor. DHL’s contract-logistics unit plans to roll out 20-30 of the robots during H1-2023, an October 15, 2022 WSJ article stated.
(4) Robots making deliveries. Restaurants, grocery stores, drug stores, and Amazon are using robots to expedite deliveries. Chipotle has invested in Nuro, a startup that uses self-driving technology to deliver groceries in a small electric vehicle, while Starship Technologies makes deliveries on the George Mason University campus in a small container resembling a beach cooler on wheels.
Drones are being used to deliver small packages over short distances. Zipline delivers packages for Walmart in Arkansas. DroneUp is expected to provide delivery services for 34 Walmart stores in Arizona, Arkansas, Texas, and Florida and has plans to expand to six states, a May 24, 2022 Walmart press release stated. Drone Express delivers Papa John’s pizzas in Georgia. Alphabet Wing is making drone deliveries for Walgreens in Texas, and Amazon has its own drones that make deliveries in Texas and California, a January 5 CNET article reported.
(5) Robots in hospitals. Hospitals are using robots for activities that range from delicate surgeries to disinfecting rooms. Intuitive Surgical’s DaVinci system makes surgeries less invasive, assisting doctors in procedures such as cardiac surgeries, colorectal surgeries and head, neck, and thoracic surgeries. Robots also assist in patient rehabilitation. The Food and Drug Administration has cleared the Atalante exoskeleton by Wandercraft to help stroke patients relearn to walk. It should be available in Q1, a January 23 Engadget article reported.
Relay Robotics’ robots deliver lab tests, medical supplies, and other items around the long corridors of a hospital; they also make deliveries in hotels. Akara Robotics’ robots disinfect hospital rooms, sometimes by using a UV light and sometimes by purifying the air, a January 9 Innovation Origins article reports.
Outside of hospitals, Walgreens Boots Alliance is using robotic arms in its micro-fulfillment centers to dispense about 900 different drugs. Each robotic arm can fill 300 prescriptions an hour, or what a typically staffed Walgreens pharmacy could do in a day. By 2025, half of Walgreens’ prescription volume from stores could be filled at these automated centers, freeing up store pharmacists to provide healthcare services to customers, a March 30 CNBC article reported. The company plans to build 22 of these facilities to serve more than 8,500 Walgreens stores.
(6) Robots on the farm. Old MacDonald would be shocked at the technology farmers are employing to reduce their labor costs and boost yields. Smart machines are making planting, harvesting, and tending to the fields easier, while apps are helping farmers care for their animals.
John Deere’s ExactShot machine detects and douses individual seeds with a targeted burst of fertilizer instead of the indiscriminate spraying of traditional machines—reducing fertilizer use as much as 60%. The company’s See & Spray machine can differentiate between a weed and a desired plant, spraying herbicides only where needed. Deere has also developed electric and autonomous tractors.
Robots with improved sensors can identify when fruits and vegetables are ripe and gently pick them. We discussed Traptic’s pickers with their 3D cameras, robotic arms, and neural networks in 2020. Last year, the company was acquired by Bowery Farming, which will use the equipment in its indoor, vertical farms. Naïo Technologies has built Ted, Jo, Oz, and Orio, machines that weed fields autonomously.
Drones are being used to monitor crops, and companies such as AppsforAgri have sensors that can track everything from soil moisture to a cow’s health. A September 20 Plug and Play article describes the “connected cow,” with sensors able to provide real-time monitoring of milk quality and cow health. Virtual fences can move animals wearing sensors from one area of a pasture to another, and 12% of dairy farms are using robots, the article reports. Wonder what the cows think of all this technology?
Additional Reading
Farms & Mines:
Sept. 20, 2022 Livestock farming technology in animal agriculture
July 11, 2022 Miners are relying more on robots. Now they need workers to operate them
Restaurants:
Jan. 26, 2023 Newk's Eatery adds AI "cashier in the cloud' to take to-go orders
Jan. 15, 2023 Meet Tori, AI for your fast food order
Dec. 23, 2022 Robots are replacing workers lost in the pandemic. They're here to stay.
Dec. 27, 2022 Why restaurant chains are investing in robots and what it means for workers
Warehouses & Deliveries:
Jan. 5, 2023 Drones are already delivering pizza, if you haven't noticed
Dec. 6, 2022 Leased robots roll in to help logistics firms handle holiday crush
Oct. 15, 2022 Meet the army of robots coming to fillin for scarce workers
Sept. 7, 2022 The supply chain broke. Robots are supposed to help fix it.
Health Care:
Jan. 23, 2023 FDA clears Wandercraft's exoskeleton for stroke patient rehab
Jan. 9, 2023 With Akara robots, hospitals get disinfected faster
March 20, 2022 Walgreens turns to robots to fill prescriptions, as pharmacists take on more responsibilities
Robots & Productivity:
Jan. 26, 2023 How robotic process automation (RPA) can drive enterprise productivity
Jan. 26, 2023 Work productivity is stagnating; do we expect too much from new technologies
Jan. 21, 2022 Robot productivity: How cobots compare to humans
YRI on Robots & AI:
Jan. 12, 2023 Financials, Materials & Robots
Jan. 5, 2023 China, Staples & Drones
Aug. 25, 2022 Industrials, Russia & Robots
April 14, 2022 Inflation, Semis, Banks & Grocery Shopping
Feb. 10, 2022 What's in style? (Softer, Gentler Robots)
Feb. 3, 2022 Coming Home
Dec. 16, 2021 Will 2022 Be Better Than 2021? (Autonomous Trucks Arrive)
Oct. 28, 2021 Margins, FAANMGs, and Batteries
Sept. 23, 2021 Natural Gas & Unnatural Exosuits
June 17, 2021 Earnings FAANGs & Robots
Jan. 7, 2021 Socialism, Materials, and Drones
Peak Hawkishness?
February 01 (Wednesday)
Check out the accompanying pdf and chart collection.
Executive Summary: It’s almost a given that the FOMC will decide today to ratchet up the federal funds rate by another 25bps. Less certain are how hawkish FOMC members will sound discussing the future course of monetary policy—starting with Fed Chair Powell today—and how much their words may perturb financial markets. But since the Fed remains ever “data dependent,” we can gain insight into their thinking by examining the recent data releases that are likely to affect it. … Also: Improving global growth prospects are igniting commodities markets, especially for gold, copper, and other metals. Melissa takes a look.
The Fed: Squawking Hawks. The FOMC’s two-day meeting ends today. At 2:00 p.m., the committee will issue its statement, and at 2:30 p.m., Fed Chair Jerome Powell will hold his usual after-meeting press conference. For the other Fed officials, the blackout period preventing public comments ends on Friday. The next blackout period starts on March 11.
So we can look forward to lots of commentary from the Fed heads in coming days. Most of it is likely to be hawkish. But on balance, they should be less so than they were during 2022. They are likely today to raise the federal funds rate by 25bps to 4.50%-4.75% and say that it is getting closer to restrictive, implying that they will vote for two more 25bps rate hikes at each of the next two meetings of the FOMC (on March 21-22 and May 2-3).
That would bring the federal funds rate to 5.00%-5.25%, which coincides with the committee’s December 14, 2022 projection of the federal funds rate at 5.10% for this year, falling to 4.1% next year and 3.1% in 2025. Nevertheless, for now, Fed officials are likely to reiterate their intention to keep the federal funds rate at a restrictive level for the foreseeable future and to stress that they have no intention of lowering interest rates anytime soon.
Of course, the Fed heads could turn more hawkish, squawking that this key rate may have to be pushed even higher if the labor market remains too tight and inflation doesn’t continue to moderate toward their goals of 3.1% this year, 2.5% next year, and 2.1% in 2025. (See our FOMC Economic Projections.)
Fed officials remain data dependent, so let’s see what the latest relevant data show:
(1) Employment. December’s JOLTS release and January’s ADP employment report will be out this morning, just in time for these labor market indicators possibly to influence the FOMC’s decision. We know that the labor market remains tight based on the recent historically low readings of initial unemployment claims (Fig. 1).
That was confirmed yesterday by the Conference Board’s January survey used to construct the Consumer Confidence Index (CCI). The percent of respondents saying that “jobs are hard to get” also remained low at just 11.3%, while the “jobs plentiful” response edged up to 48.2%, which is a very high reading for this series (Fig. 2). The CCI’s jobs-hard-to get series is highly correlated with the unemployment rate, which likely remained near recent lows during January (Fig. 3).
Powell and his colleagues have given extra weight to JOLTS’ job openings series. They want to see fewer job openings to reduce the upward pressure on wages. However, the JOLTS series is highly correlated with the CCI’s jobs-plentiful series, so the former probably stayed high during December (Fig. 4). The NFIB small business survey showed a sharp drop in job openings during December, but it also remains historically high (Fig. 5).
(2) Inflation. In a November 30 speech last year titled “Inflation and the Labor Market,” Powell acknowledged that consumer goods inflation is moderating quickly (Fig. 6). He also observed that the rent inflation components of both the CPI and PCED are lagging indicators of rent inflation in recently signed leases, which came down sharply during the second half of 2022.
However, Powell’s major hang-up is the PCED for core services excluding housing. It has been stuck around 4.0%-5.0% since late 2021 (Fig. 7). He blamed that mostly on high wage inflation, which is moderating but remains high. Here are the inflation rates of the six major components of Powell’s PCED for core services excluding housing on a y/y basis and on a three-month annualized basis: transportation (13.2%, 5.9%), personal care (9.8, 10.1), recreation (5.6, 8.7), education (2.5, 2.4), health care (2.4, 1.6), and communications (-1.0, 3.6) (Fig. 8, Fig. 9, and Fig. 10).
Half of the three-month inflation rates are mostly below their y/y comparable ones. That certainly doesn’t augur for a higher federal funds rate than 5.25%. But it doesn’t rule out that the Fed will keep the rate at 5.25% for longer until the inflation rate for PCED core services excluding housing is clearly heading down.
(3) Interest rates. Meanwhile, the fixed-income markets are signaling that the FOMC’s monetary policy tightening cycle is nearing the end. The 2-year Treasury yield is a very good leading indicator of the federal funds rate (Fig. 11). It peaked last year at 4.72% on November 7. It was down to 4.21% yesterday. The yield-curve spread between the 10-year and 2-year Treasuries tends to turn negative near the tail end of monetary policy tightening cycles (Fig. 12). It has turned increasingly negative since July 8, 2022.
Commodities: Upbeat Disposition. Recently rebounding commodities prices suggest that the outlook for the global economy is improving; we think both will continue to do so this year. The price performance of gold, which tends to track the underlying trend in all commodities prices, is shining (Fig. 13). The markets for copper and other metals are aglow, reflecting China’s brightening economic outlook and Europe’s recession avoidance so far.
The importance to commodities markets of China’s abandoning its unrealistically restrictive Covid policies cannot be overstated. Moreover, other recent China-related worries have lifted: The government has plans to stabilize China’s ailing property sector, and it won’t be invading Taiwan anytime soon, according to Fox; the economic cost would be too great, opined Forbes.
Energy markets are normalizing. The warmer winter in Europe helped to dampen demand amid the tightening of Russian energy supplies, and Europe has succeeded in securing alternative energy suppliers. The forthcoming ban on Russian diesel and petroleum products, however, recently bumped prices for those commodities back up, and China’s post-lockdown reopening could increase the demand for diesel too.
The US economy’s outlook is conducive to improving commodities markets as well. Signs point to a soft landing of the economy, as the Fed’s aggressive interest-rate moves are moderating inflation without overly damaging the job market, a boon for consumer spending and sentiment.
Also favorable is the orderly, demand-driven way in which commodities prices have been rising—unlike when pandemic-related supply-chain problems caused a mismatch of supply and demand, sending prices through the roof.
Let’s take a deeper dive into the commodities pits:
(1) Oil. Russia’s invasion of Ukraine sent Brent crude oil futures prices soaring to a high of $123.58 per barrel last year. The oil price fell to a recent low of $76.10 per barrel on December 9. But it has risen 11.6% since then to $84.90 per barrel as of January 30.
Diesel, heating oil, and gasoline have been rallying more significantly (Fig. 14 and Fig. 15). The prices per gallon of these refined petroleum products have shot up from recent lows because on February 5, Europe plans to block Russian imports of diesel and other products made from crude oil, tightening supplies. Should Europe find sufficient alternative sources, the price increases could prove temporary. Already, it has cut Russian diesel imports from 50% of total imports before the war to 27%, Time reported. US suppliers have increased their shipments to Europe to a record 237,000 barrels per day from 34,000 at the start of 2022, according to S&P Global, Time wrote.
Time reported that massive new refining capacity is launching in Kuwait and Saudi Arabia later this year and in Oman in 2024, which could further alleviate the pricing pressure. But just as new supply opens, China’s reopening could boost demand.
These countervailing pressures suggest to us that energy prices could settle somewhere around current levels. Markets already are anticipating this, as the spread between 2-year Brent crude oil futures prices and nearby contracts recently has fallen (Fig. 16 and Fig. 17).
Notably, natural gas futures prices have tumbled to $3.11 per million Btus (British thermal units) as of January 27 from a trading range above $9 late in the summer. “The biggest reason for the decline is the warm weather this winter in Europe and the US,” stated a recent Barron’s column. “People are using less gas for heat, allowing more of it to build up in storage.”
(2) Basic metals. It’s no surprise that copper prices have rebounded on expectations of China’s economic rebound. Copper prices have risen 10.5% ytd along with the rise in China’s MSCI stock price index (in yuan) of 12.9% ytd (Fig. 18).
Copper is expected to experience a demand surge, observed CNBC, as well as a short-term supply shortage. Miners will need to restock after curbing production during the China Covid lockdowns. Over the long term, copper’s demand prospects are supported by the global green energy infrastructure transition.
Additionally, the metals component of the CRB Raw Industrials Spot Price Index has been rebounding since its recent bottom on October 31, 2022 (Fig. 19). Before bottoming, it had risen to an unprecedented high on April 4, 2022, 27.5% higher than the previous record on April 11, 2011. The index is composed of scrap copper, lead scrap, steel scrap, tin, and zinc.
(3) Lumber. The price of US lumber may be starting to rebound because the US housing market may be close to hitting bottom (Fig. 20). We believe that mortgage rates peaked in early November of last year along with the 10-year US Treasury bond yield.
Market Dynamics
January 31 (Tuesday)
Check out the accompanying pdf and chart collection.
Executive Summary: Old-fashioned stock picking may be coming back into fashion as momentum investing stumbles. The breadth of stocks participating in the recent rally is improving, which could even the playing field for active versus passive equity managers and give the former a shot at outperforming the latter. … We recommend overweighting four S&P 500 sectors this year (Energy, Financials, Industrials, and Materials), market-weighting two (Tech and Health Care), and underweighting the remaining five. Our choices reflect our soft-landing expectations for the US and global economies in 2023 (with better growth in 2024). … Also: The latest Fed business surveys depict a slowing US economy and lower inflation.
Weekly Webcast. If you missed Monday’s live webcast, you can view a replay here.
Strategy I: A Market of Stocks. Now that the MegaCap-8 stocks (i.e., Alphabet, Amazon, Apple, Meta, Microsoft, Netflix, NVIDIA, and Tesla) have lost some of their mega and allure, the breadth of the stock market has improved. From approximately 2017 through 2021, it was mostly a market of these eight stocks that were driven higher by the momentum investment style.
Now stock picking is back in fashion, in our opinion, because more stocks are participating in the market’s action. More importantly, that action is no longer dominated by the MegaCap-8 stocks. In other words, active equity managers may finally have a chance of outperforming passive equity managers. Mutual fund managers might have a shot at beating the performance of ETFs. Consider the following:
(1) Market capitalization. The MegaCap-8 benefitted from the pandemic. Their combined market capitalization soared from $5.3 trillion at the start of 2020 to peak at a record $12.3 trillion on December 27, 2021 (Fig. 1). Over this period, their share of the S&P 500’s market capitalization rose from 16.8% to 25.7% (Fig. 2).
Since their peak, the MegaCap-8’s collective market cap has dropped $4.2 trillion to $8.1 trillion during the January 27 week, and together they now account for 21.0% of the S&P 500’s capitalization.
(2) Active vs passive styles. The outperformance of the MegaCap-8 during 2020 and 2021 can partly be explained by the massive net inflows into equity ETFs and net outflows from mutual funds during this period. Active equity managers tend to diversify their portfolios. Very few are likely to concentrate 25% of their portfolios in a handful of stocks. ETFs, on the other hand, will do so automatically since they are mandated to track specific stock price indexes without any diversification restrictions.
In other words, the ETFs that are indexed to the S&P 500 will beat portfolios benchmarked to the index if the former are outperforming. That’s because a handful of stocks are dominating the market-cap share of the S&P 500 in a way that active managers can’t pursue if they have explicit or self-imposed limits on the percentage of their assets that can be invested in any one stock.
(3) Equity ETFs vs mutual funds. On a 12-month basis, equity mutual funds experienced a record net outflow of $575.6 billion through February 2021 (Fig. 3). On the other hand, equity ETFs had record net inflows of $730.7 billion through December 2021, also on a 12-month basis.
The latest data through December 2022 show that equity mutual fund net outflows were down to $316.3 billion, while ETF net inflows were $418.4 billion. Yes, this suggests that passive investing still has an advantage over managed equity money, but less so than in 2020 and 2021, as long as a handful of stocks don’t dominate the market.
(4) Breadth. Measures of breadth suggest that more stocks are participating in the stock market’s action as stock picking comes back into fashion. The ratio of the S&P 500’s equal-weighted to market-cap-weighted indexes is the highest that it has been since before the pandemic (Fig. 4 and Fig. 5). Since the S&P 500 bottomed last year on October 12 through Friday’s close, the former is up 17.7%, while the latter is up 13.8%.
The NYSE advance/decline lines for all securities and based on volume were both in downward trends since early 2021 (Fig. 6 and Fig. 7). Both are showing signs of reversing that trend in recent weeks.
(5) Growth vs Value. You might have noticed that the ratio of the forward P/Es of the Growth to Value indexes of the S&P 500 tumbled at the end of last year (Fig. 8). The ratio peaked at 1.9 at the end of 2021 (just before the bear market). It was around 1.4 most of last year but plunged at the end of last year to only 1.1 during the January 19 week, the lowest reading since December 2009.
There has been a big 29% jump in the forward P/E of Value from 13.0 on September 30 last year to 16.8 last Friday (Fig. 9). Over this same period, Growth’s forward P/E rose just 2% from 18.9 to 19.2.
Last week, Joe reported that Standard & Poor’s moved four of the MegaCap-8 stocks from Pure Growth to Growth and Value. He wrote: “Recall that the S&P 500 Growth and Value indexes are … analyzed to determine which companies exhibit scoring characteristics of both Growth and Value and are weighted in each of those indexes by their scores. Meeting the criteria to appear in both indexes were 135 of the S&P 500 companies, including half of the MegaCap-8 stocks: Alphabet, Amazon, Meta, and Microsoft.”
Prior to this change, these four (along with the other four MegaCap-8) were classified as Pure Growth by S&P. As a result, the MegaCap-8’s market-cap share of the Growth index dropped from 41.4% just before the change late last year to 36.8%. It was back up to 39.4% during the January 20 week (Fig. 10). The change also boosted the forward earnings of Growth and depressed the forward earnings of Value (Fig. 11).
Strategy II: Relative Sector Momentum. While stock picking may be back in style and momentum investing is running out of momentum, Joe and I are still keeping track of the relative performance of the 11 S&P 500 sectors to one another and to the overall index (Fig. 12).
Our four favorite sector picks for this year are Energy, Financials, Industrials, and Materials. These are our overweight recommendations. We would market-weight Information Technology and Health Care. We would underweight the remaining sectors.
The following sectors have been showing upward momentum relative to the S&P 500 in recent weeks: Energy, Industrials, and Health Care. Downward momentum has been displayed by Communication Services, Consumer Discretionary, Information Technology, Real Estate, and Utilities.
Our sector choices reflect our view that the global economy will continue to grow in 2023 and that the US economy will do the same. There won’t be any hard landings here or abroad.
US Economy: Less Growth & Inflation. We now have in hand all five business surveys for January conducted by the Federal Reserve district banks in Dallas, Kansas City, New York, Philadelphia, and Richmond (Fig. 13). Collectively and individually, they show less economic growth and lower inflation than in recent months.
The average of their general business indexes dropped further into negative territory this month, suggesting that the M-PMI also fell further below 50.0 this month. The averages of the regional prices-paid and prices-received indexes continued to fall in January, though they remained elevated (Fig. 14). The average prices-paid index is highly correlated with the PPI for final demand and suggests that this measure of inflation should continue to fall (Fig. 15).
January’s M-PMI will be out on Wednesday, February 1, in time to have some influence over the FOMC’s policymakers during the second day of their two-day meeting. We are expecting a 25bps hike in the federal funds rate.
ABCs of GDP & PCED
January 30 (Monday)
Check out the accompanying pdf and chart collection.
Executive Summary: The global financial markets are reflecting expectations for an improved global economy, and the US stock market is siding with the optimists on the US economic outlook, us among them: We continue to see greater odds of a soft landing (60%) than a hard one (40%). … Recent GDP and inflation data support our soft-landing scenario. Q4 GDP was strong, but a look under the hood suggests it was boosted by unintended inventories and Q1 GDP might be tempered by inventory liquidation. The past three months of PCED inflation data highlights reassuring downward progress, especially in goods inflation. … And: Dr. Ed reviews “Argentina 1985” (+ + +).
YRI Weekly Webcast. Join Dr. Ed’s live webcast with Q&A on Mondays at 11 a.m. EST. You will receive an email with the link one hour before showtime. Replays of the weekly webcasts are available here.
Strategy: Betting on Global Growth. While many economists and strategists have been fretting about a 2023 global recession led by economic downturns in the US, Europe, and China, stock investors started the new year by snapping up cheap stocks around the world. Traders in the commodity pits have been going long metals futures contracts. The dollar has weakened as the outlook for the global economy has improved. In other words, financial markets are anticipating a brighter outlook for 2023 compared to 2022. We are siding with the markets.
The consensus outlook seems to have turned more optimistic for Europe and China in recent weeks. On the other hand, the outlook for the US remains hotly debated. Nevertheless, the US stock market has been siding with the optimists since the S&P 500 bottomed on October 12 of last year. Consider the following developments in the US and global financial markets:
(1) S&P 500. The S&P 500 tried and failed to rise above its 200-day moving average three times during the bear market from January 3 to October 12, 2022 (Fig. 1). These attempts were followed by new bear market lows. The rally since the October 12 low of 3577.03 on the S&P 500 saw another failed attempt to take out the 200-day moving average during late November. However, the index found support around 3800 late last year and early this year and rose above its 200-day moving average in recent days, closing at 4070.56 on Friday.
Leading the charge during January have been some of the S&P 500’s most cyclical sectors: Communication Services (14.8%), Consumer Discretionary (14.5), Information Technology (9.8), Real Estate (9.2), Materials (7.3), S&P 500 6.0), Financials (5.8), Energy (4.2), Industrials (2.9), Consumer Staples (-2.2), Utilities (-2.3), and Health Care (-2.4) (Fig. 2 and Table 1).
The leadership of cyclicals is even more striking since the October 12 bear market low: Materials (21.8%), Financials (19.8), Real Estate (19.0), Information Technology (16.8), S&P 500 (13.8), Energy (13.7), Communication Services (13.6), Utilities (12.1), Health Care (8.9), Consumer Staples (8.1), and Consumer Discretionary (4.9) (Table 2).
As we previously observed, the rally since October 12 has been associated with improving breadth, as more and more stocks have participated. Since then, here is the performance derby of some of the major US stock market indexes: S&P 500 Equal Weighted Total Return (18.1%), S&P 500 Equal Weighted (17.4), S&P 400 (16.3), S&P 500 Transportation (14.7), S&P 500 Total Return (14.4), and S&P 500 (13.8) (Fig. 3). Furthermore, the NYSE advance/decline line seems to be breaking out of its downward consolidation that started in early 2021 (Fig. 4).
What about earnings? Industry analysts have been trimming their estimates for S&P 500 operating earnings per share (Fig. 5). Here are the y/y quarterly growth rates they are projecting as of the January 19 week: Q1 (-2.5%), Q2 (-3.5), Q3 (3.5), and Q4 (10.4). However, their annual earnings-per-share expectations for 2023 (at $227, up from $219 in 2022) and 2024 (at $252) remain consistent with our soft-landing economic outlook (Fig. 6). By the way, the percent of S&P 500 companies with positive three-month percent changes in forward revenues and forward earnings rebounded to 66.1% and 56.5% during the January 27 week, up from recent low readings of 50.6% and 44.4% during the December 30 week (Fig. 7 and Fig. 8).
In conclusion, we believe that the rally since October 12 is the Real McCoy—the start of a new bull market instead of just a rally within a bear market. That assessment is consistent with our optimistic outlook for the global economy as well as our view that a soft landing is more likely than a hard landing for the US economy.
Although we are feeling more optimistic, we are sticking with our 60% subjective probability of a soft landing and 40% of a hard landing. Let’s see whether Fed Chair Jerome Powell insists on depressing us all yet again on Wednesday during his press conference.
(2) All Country World MSCI. Our TINAC hypothesis—i.e., that foreign investors remained tethered to US markets given their rationale that “there is no alternative country” with as much investment appeal—mostly worked well during the pandemic up until the point in late 2022 when it didn’t. During that period, global investors perceived the US as a safe haven in an increasingly unsettled geopolitical environment. The dollar soared until it peaked at a record high on October 19, 2022 (Fig. 9).
Around that time, investors turned more optimistic about both Europe’s prospects and China’s outlook. Europe succeeded in replacing Russian natural gas with other sources as winter approached and turned out to be a mild one. On December 7, China’s government abruptly scrapped its zero-Covid policy.
The ratio of the US MSCI to the All Country World ex-US MSCI (in dollars) peaked at a record high on October 28, 2022 (Fig. 10). Here is the performance derby of the major MSCI stock price indexes (in dollars) since October 12 of last year through Friday’s close: Italy (42.5%), Germany (41.6), China (38.6), EMU (38.5), Europe (31.4), UK (26.3), Emerging Markets Asia (25.5), All Country World ex-US (25.3), Emerging Markets (21.5), Japan (20.3), All Country World (18.1), US (13.7), and Emerging Markets Latin America (7.8) (Table 3).
As investors turned more optimistic on the global economic outlook, they scrambled to purchase overseas stocks because they’ve been cheaper than US stocks. Here are the forward P/Es of the major MSCI stock price indexes during the January 19 week: US (17.6), EMU (12.5), Japan (12.2), Emerging Markets (12.1), and the UK (10.5) (Fig. 11).
(3) Commodity prices and currencies. Most commodity prices are quoted in dollars. So there tends to be an inverse correlation between the dollar and commodity prices (Fig. 12). When the global economy is doing well, the dollar tends to weaken and commodity prices tend to strengthen, which is what has been happening since late last year. Particularly strong has been the metals component of the CRB raw industrials spot price index, which includes copper scrap, lead scrap, steel scrap, tin, and zinc (Fig. 13).
The euro and the yen rebounded smartly since late last year as financial markets started to discount the end of the Fed’s monetary tightening cycle but assumed that the European Central Bank and the Bank of Japan must do more tightening ahead.
US Economy I: Slicing & Dicing GDP. Friday’s GDP report for Q4-2022 is also consistent with a soft-landing forecast. The 2.9% (saar) increase was widely reported to be a strong number following Q3’s 3.2%. Both are more consistent with a no-landing scenario. However, as we observed in our January 26 QuickTakes, while real GDP was up 2.9%, real final sales of domestic product rose only 1.4% (Fig. 14).
In other words, inventory investment accounted for a bit more than half of the increase in real GDP during Q4. In the GDP accounts, inflation-adjusted retail inventories excluding autos fell for the second quarter in a row as the industry cut prices to reduce the big pile of unintended inventory accumulation during the previous three quarters (Fig. 15). As retailers scrambled to reduce their inventories, manufacturing and wholesale inventories piled up during Q4. During Q1-2023, we expect to see inventory liquidation among manufacturers and wholesalers, offset by some rebuilding of inventories by retailers.
Now let’s briefly examine the other major components of real GDP:
(1) Consumer spending. Personal consumption expenditures rose 2.1% during Q4. They were up 2.8% during 2022, led by a 4.5% increase in services. Goods consumption fell 0.4% last year after jumping 12.2% during 2021 (Fig. 16).
Hard landers are warning that pandemic-related excess saving allowed consumers to spending more last year as evidenced by the drop in the personal saving rate from 12.0% in 2021 to 3.4% in 2022 (Fig. 17). That’s true, but we expect that real disposable income will continue to get a boost from employment gains and rising real wages this year (Fig. 18).
(2) Residential investment. Single-family housing activity was a big drag on real GDP last year. It might be less so this year. Mortgage rates and home prices have been coming down, and there is lots of pent-up demand for housing.
Residential investment fell 26.7% (saar) during Q4 following a 27.1% drop in Q3. For all of 2022, it was down 10.7%. Leading the way down during 2022 compared to 2021 was a 38.5% drop in single-family construction (Fig. 19). Multi-family residential investment held up well last year and should do so this year.
(3) Capital spending. Nonresidential investment rose 3.6% last year, led by an 8.7% increase in intellectual property (with software, R&D, and creative originals all rising to record highs) and a 4.3% increase in equipment, while structures fell 7.4% (Fig. 20).
Industrial equipment was led higher by transportation equipment. Industrial and high-tech equipment edged down but remained near recent record highs. Technology continued to account for about 50% of current-dollar capital spending. (Fig. 21). The weakness in structures last year was in commercial, health care, power, and communications (Fig. 22). Manufacturing structures held up well and may be heading higher.
(4) Trade. The trade deficit narrowed a bit during Q4, providing a slight boost to real GDP (Fig. 23). The pandemic has had a wild impact on this deficit. It widened to a record high during Q1 as imported merchandise ordered during 2021 flooded into the country after getting stuck out at sea for several months, mostly as a result of port congestion. It’s unlikely to continue to narrow as it did during the last three quarters of 2022.
(5) Government. Spending by the federal, state, and local governments started to boost real GDP during H2-2022 (Fig. 24). They are all likely to continue to do so in 2023 as spending on public infrastructure takes off.
US Economy II: Slicing & Dicing PCED. Fed officials tend to focus on the y/y PCED measure of inflation rate on a y/y basis. They should also have a look at inflation on a three-month basis to assess whether the latest data are pointing to transitory or persistent inflation. Consider the following:
(1) The inflation news in the Q4-2022 GDP release was good: The price index for gross domestic purchases rose 3.2% (saar) versus 4.8% during Q3. The headline consumption deflator increased 3.2% versus 4.3%, while the core rate rose 3.8%, down from 4.7%.
(2) In early 2022, we predicted that the headline PCED inflation rate would decline from 6%-7% during H1-2022 to 4%-5% during H2-2022 to 3%-4% in 2023. So far, so good (Fig. 25). It fell from a peak of 7% during June of last year to 5% by the end of the year.
(3) We like to compare the y/y inflation rate to the three-month annualized rate to see whether inflationary pressures are rising or falling in the short run. Over the three months through December, the headline PCED inflation rate was 2.1% versus 5.0% y/y, while the core rate was up 2.9% versus 4.4% (Fig. 26).
Here are the comparable comparisons for food (4.1%, 11.2%), energy (-16.8, 6.9), durable goods (-3.8, 2.7), and nondurable goods excluding food and energy (1.4, 3.3) (Fig. 27).
(4) While goods inflation is turning out to be relatively transitory after all, services inflation remains persistent. Rent inflation as measured in the PCED shows no sign of peaking, rising to 8.3% y/y for tenants during December (Fig. 28). The three-month rate was 9.1%, but it may be starting to moderate, reflecting the fact that inflation in new rental leases dropped sharply during H2-2022.
Movie. “Argentina 1985” (+ + +) (link) is an excellent docudrama about the prosecution of the military leaders who led the bloody military junta that terrorized Argentina during the early 1980s. It is based on the true story of Julio Strassera, Luis Moreno Ocampo, and their young legal team of unlikely prosecutors. In his closing statement, Strassera said, “I wish to waive any claim to originality in closing this indictment. I wish to use a phrase that is not my own, because it already belongs to all the Argentine people. Your Honors: Nunca más!”
Transportation, Semiconductors & Digital Wallets
January 26 (Thursday)
Check out the accompanying pdf and chart collection.
Executive Summary: Shifts in consumer purchasing have left retailers overstocked and shippers of goods feeling the pinch. But the sense among transport company managements is that demand for their services will normalize this year. Transportation stocks have been rallying in anticipation. … Another industry impacted by shifts in consumer spending is semiconductors, as computer sales have slid dramatically. And like the transports, semiconductor stocks have been outperforming the broader market as investors look past the pain. … Speaking of pain, the big banks have finally bitten the bullet and decided to develop a digital wallet of their own.
Transports: Focused on the Future. There’s no denying that the holiday shopping season was slower than hoped as consumers spent more than usual on experiences and less on packages for under the tree. Retailers of all stripes had excess inventory last quarter, and fewer goods than usual were shipped on the highways and railroad tracks crisscrossing the US. Investors are trying to determine when inventory levels will return to normal, allowing historical patterns of sales and shipping to resume.
Transportation stocks may be rallying in anticipation of the normalization. Most of the S&P 500 transportation-related industries’ stock price indexes have outperformed the broader S&P 500 index since it bottomed on October 12 as well as since 2023 began. Here’s the performance derby from October 12 through Tuesday’s close: Airlines (27.9%), Trucking (16.5), Air Freight & Logistics (15.3), Railroads (12.6), and S&P 500 (12.3). The outperformance of Transportation shares has continued since 2023 began through Tuesday’s close: Airlines (18.5%), Trucking (12.0), Air Freight & Logistics (5.1), S&P 500 (4.6), and Railroads (0.7).
The latest update on these industries comes from J.B. Hunt Transport Services’ and Union Pacific’s earnings reports. Here’s a look at what their managements are observing about the shipping environment as well as some data about the state of transportation:
(1) Divining the inventory correction’s end. The volumes being transported around the country peaked last year and have been falling ever since. Imported and exported container traffic at the West Coast ports has fallen 10.3% from its peak during mid-2021, based on the 12-month sum (Fig. 1). Rail loadings have been dropping since the middle of last year (Fig. 2). The ATA Tonnage index has dropped 3.3% from its September peak (Fig. 3). And intermodal rail traffic has fallen as business inventories have risen to create the glut that companies are currently working down (Fig. 4).
“The freight recession that we see right now is largely inventory driven,” said J.B. Hunt President Shelley Simpson on the company’s January 18 Q4 earnings conference call. But there’s an end in sight, as the data customers have shared with the company suggest that shipping volumes may start to normalize in Q2: “We have had good signals from our customers about … a more normal environment [in Q2]. We’re not sure at what point that is in Q2, but we do feel [confidence about orders during] the back half of the year.”
Some Union Pacific customers tell the company that their inventory issues may not get resolved until the back half of Q3, reported EVP of Marketing and Sales Kenny Rocker on the company’s January 24 earnings conference call. But executives at both companies noted the advantage of transporting lower volumes: increased fluidity and fewer traffic snarls throughout the system.
(2) Declining earnings all around. Both J.B. Hunt and Union Pacific reported y/y declines in their Q4 earnings.
The trucking company’s revenue rose 4% to $3.7 billion due to fuel surcharges, and net income fell to $201.3 million from $242.2 million a year earlier. The bottom line was hurt by a $64 million pre-tax casualty claim expense and helped by a $149.1 million decline in the cost for rents and purchased transportation.
Union Pacific’s Q4 revenue rose 8% to $6.2 billion, also boosted by fuel surcharges and price increases. But net income fell to $1.6 billion from $1.7 billion a year earlier, as a number of key costs jumped faster than revenue increased. Compensation and benefits rose 10%, fuel soared 43%, and purchased services and materials rose 18%. Results were also hurt by operating inefficiencies. While revenue carloads were up 1%, the railroad’s velocity was down 3%, and its average maximum train length decreased 1%. The company blamed poor weather during the quarter and lack of crew availability but noted that it’s training 600 new employees.
Looking out into 2023, Union Pacific forecasts improved efficiency and the ability to raise prices faster than inflation. This year, the company expects its all-in inflation to be around 4%, with mid-single-digit employee cost increases partially offset by productivity gains.
Norfolk Southern also reported on Wednesday Q4 expenses that rose faster than revenue. Its Q4 operating revenue rose 13% y/y, but operating expenses jumped 19%, leading to a 5% increase in operating income. The railroad operator’s $3.42 earnings per share were up 10% y/y but missed analysts’ consensus forecast of $3.44.
(3) Trucking industry stats. The drop in trucking volumes has helped freight prices decelerate. Truck freight prices increased by 8.2% y/y in December, down from the peak 25.0% increase last May (Fig. 5). But the number of employees in the industry and the wages they’re getting continue to climb (Fig. 6).
Analysts are expecting revenue growth for the S&P 500 Trucking industry to drop sharply from a 21.0% gain last year to a 1.8% decline this year and a small increase of 5.9% in 2024 (Fig. 7). Their earnings expectations follow a similar pattern: 32.0% in 2022, -1.1% in 2023, and 9.0% in 2024 (Fig. 8). The industry’s forward P/E has fallen along with earnings expectations. It’s now 23.9, down from its peak of 31.2 in November 2021 (Fig. 9).
(4) Rail industry stats. Railroads faced a number of headwinds that may dissipate as the year progresses. First, the price of fuel was higher for much of last quarter than it is currently (Fig. 10). Second, rail customers have been working through excess inventory (Fig. 11). And lastly, rail workers were threatening to strike late last year, and proactive customers may have found other ways to ship goods before Congress moved on December 1 to impose an agreement between workers and the rail operators.
This traffic slowdown has been a blow to the rail industry. The S&P 500 Railroads industry is expected to post revenue growth that slows sharply from the 15.6% increase in 2022 to only a slight increase of 0.4% this year and a muted gain of 2.7% in 2024 (Fig. 12). Analysts forecast a strong increase of 16.7% in 2022, followed by tepid growth this year, 2.2%, and improvement in 2024, 7.9% (Fig. 13). The industry’s forward P/E has come down sharply to 17.5 from its recent peak of 23.3 in April 2021 (Fig. 14).
Semiconductors: Bad News from Microsoft. The correction in computer sales continued through Q4. The latest datapoint comes from Microsoft, which reported on Tuesday that sales in its personal computing segment fell 19% to $14.2 billion, and sales directly related to its Windows operating system tumbled 39%. This follows news that worldwide PC shipments were down 28.5% in Q4, according to a January 11 Gartner press release.
Texas Instruments added to the gloom on Tuesday by reporting Q4 revenue fell 3% y/y and 11% q/q. It also forecast Q1 earnings of $1.64-$1.90 a share, the midpoint of which is below analysts’ expectations of $1.87, a January 24 Reuters article reported. None of this is good news for semiconductors, the brains that make computers and video game consuls run.
Analysts estimate that S&P 500 Semiconductor earnings fell 1.2% last year and will fall another 13.4% this year before bouncing sharply higher, by 24.0%, in 2024 (Fig. 15). But investors aren’t waiting for the good times to return before buying semiconductor shares. Despite the doom and gloom, the S&P 500 Semiconductors stock price index has risen 34.9% since the market’s October 12 low, trouncing the S&P 500’s 12.3% gain. The S&P 500 Semiconductors index is also up 16.4% ytd through Tuesday’s close, again beating the broader index’s 4.6% increase (Fig. 16). The S&P 500 Semiconductors index remains 30.8% off its November 29, 2021 high, leaving plenty of room for the rebound to continue, though perhaps at a slower pace.
Certain semiconductor companies have rallied on company-specific news. Investors are betting that Nvidia will benefit from the growing use of artificial intelligence programs like ChatGPT because its graphics chips are designed for complex computing tasks, a January 23 Bloomberg article reported. Nvidia shares are up 31.8% ytd through Tuesday’s close, but down 42.3% from their 2021 high. Privately held ARM has been taking market share away from Intel in PCs and data centers, a January 23 WSJ article noted. It’s reportedly teeing up an IPO for later this year.
Disruptive Technologies: The Wallet Wars. They’re more than a little late to the game, but big US banks have decided to create their own digital wallet to compete with the likes of Apple Pay, Google Pay, and PayPal. Already, 62% of Gen Z and Millennials, 50% of Gen X, and 32% of Baby Boomers are making digital payments or transfers, according to research by Cornerstone Advisors cited in a January 25 Computerworld article.
Bank of America, JP Morgan Chase, Wells Fargo, and four other banks collectively are developing a digital wallet that will be managed by Early Warning Services, the bank-owned company that operates Zelle, a January 23 WSJ article reported. The banks will have to lure early adopters from their competitors’ offerings. Most consumers aged 21-42 who make digital payments use PayPal (74%), followed by Cash App (49), Venmo (39), Zelle (34), Apple Pay (32), Goggle Pay (24), and Facebook Pay (16). The banks may need to offer incentives—like cash back or rebated credit card fees—to entice consumers to try the new wallet. The articles about the new offering didn’t state how much capital the banks were putting up to fund the new venture.
The banks also will have to convince merchants to adopt the software in their point-of-sale and online systems. Chase Pay was closed in 2021 after just one year of operation because it was unable to get enough merchants on board, the Computerworld article noted.
Doing nothing may not be an option for banks. Digital payments and account-to-account money transfers will put up to $34 billion of revenue at risk for North American banks between 2022 and 2026, a December 12 Accenture report states. At risk are revenues generated from credit card transaction interchange fees, interest income from credit cards, and fees attributable to banks from alternative payments. Disruption is never painless.
What’s in Style At S&P and the Fed?
January 25 (Wednesday)
Check out the accompanying pdf and chart collection.
Executive Summary: Standard & Poor’s last month reshuffled the components of its S&P Growth and Value indexes, with dramatic impacts on their valuation metrics. Ejected from the Pure Growth index were most of the MegaCap-8 companies, along with their gargantuan capitalizations; now only Apple remains. The forward P/Es of the S&P 500 Growth and Pure Growth indexes plummeted as a result. … Also: While FOMC members can’t share what’s been on their minds during the current pre-meeting quiet period, Melissa recaps what they last said about their expectations for monetary policy.
Strategy: Value & Growth Recalculated. After the close of trading on December 19, Standard & Poor’s released its new constituents for its various S&P Growth and Value indexes based on its annual recalculation of the growth and value scores for companies in the indexes. Their scores determined which companies appear in the Growth and Value indexes, which appear in both indexes (in a weighted fashion), and which companies meet the stricter criteria for inclusion in the Pure Growth and Pure Value indexes.
I asked Joe to dig deeper to see what really happened. He reports that the changes to the indexes and their forward valuations were stunning, to say the least:
(1) At year-end 2021, S&P’s criteria had seven of the MegaCap-8 companies in the top 10 market-cap spots in the S&P 500 Pure Growth index, with Netflix a near miss. Fast-forward to year-end 2022, and only Apple remains. The ouster of seven MegaCap-8 companies, along with their massive collective capitalizations, from the Pure Growth index comes as no surprise since price momentum and sales growth are a big part of the Growth score, and theirs deteriorated considerably in 2022.
(2) During 2022, the S&P 500 Pure Growth stock price index fell 28.1%, slightly better than the 30.1% decline for Growth, but both were considerably worse than the 3.3% and 7.4% declines for Pure Value and Value. The S&P 500 fell 19.4% last year (Table 1).
(3) Recall that the S&P 500 Growth and Value indexes are further analyzed to determine which companies exhibit scoring characteristics of both Growth and Value and are weighted in each of those indexes by their scores. Meeting the criteria to appear in both indexes were 135 of the S&P 500 companies, including half of the MegaCap-8 stocks: Alphabet, Amazon, Meta, and Microsoft. Here’s the classification for the MegaCap-8 stocks now and then:
Current MegaCap-8 classification in the various S&P 500 Growth/Value indexes:
Pure Growth: Apple
Growth only: Netflix, Nvidia, Tesla
Both Growth & Value: Alphabet, Amazon, Meta, Microsoft
Value only: None
Pure Value: None
Prior MegaCap-8 classification in the various S&P 500 Growth/Value indexes:
Pure Growth: Alphabet, Amazon, Apple, Meta, Microsoft, Netflix, Nvidia, Tesla
Growth only: None
Both Growth & Value: None
Value only: None
Pure Value: None
(4) Here are the new top-eight constituents by market capitalization among the 73 companies in Pure Growth: Apple, Exxon Mobil, UnitedHealth, Chevron, Eli Lilly, Merck, Abbvie, and Pfizer.
The current top-eight market-cap companies of the 85 Pure Value companies are: Berkshire Hathaway, Bank of America, Verizon, Wells Fargo, AT&T, Intel, Goldman Sachs, and CVS Health.
Pure Growth’s surprising additions include ExxonMobil and Chevron. Goldman Sachs’ score deteriorated so considerably since a year earlier that it was shifted out of the Pure Growth index and into Pure Value.
(5) The net result of S&P’s constituent changes to the indexes caused the forward P/E for S&P 500 Growth and Pure Growth to fall sharply relative to their Value counterparts. Pure Growth tumbled to 11.8 after Standard & Poor’s announcement from 17.8 (now 12.3 as of January 19), Pure Value dropped to 9.1 from 10.4 (now 9.6), Growth dropped to 18.4 from 21.1 (now 18.9), and Value rose to 15.9 from 15.3 (now 16.7) (Fig. 1 and Fig. 2).
This has also caused their relative P/Es to reset drastically to multi-year lows. Growth’s P/E is now just 2.0pts above Value’s, near the lowest premium since 2010 (Fig. 3, Fig. 4, and Fig. 5).
The Fed I: Smaller Rate Hikes Ahead. In recent public commentary before the FOMC’s required pre-meeting quiet period, Fed officials signaled that the upcoming January 31-February 1 meeting will likely result in a decision to continue their restrictive monetary policy but at a slower pace. The increase in the federal funds rate should slow to a more typical 25-point pace. Melissa and I anticipate a terminal rate—after this course of tightening is over—of around 5.00%-5.25%, both because Fed Chair Powell has indicated as much and because it’s the peak rate in the Fed’s latest policy projections.
Three more 25-point increases would get us there—expected after the next three FOMC meetings, concluding on February 1, March 22, and May 3. The projected terminal rate would be higher than twice the peak during the previous tightening cycle and the highest since mid-2007 (Fig. 6).
What then? Fed officials have talked about pausing for the remainder of the year, with possible further rate hikes later this year if inflation remains troublesome. In any event, policy will remain restrictive as the Fed further winds down its balance sheet. And the Fed likely will signal that rate cuts won’t be coming anytime soon.
Why slow the tightening now? Fed officials want to wait to see the lagging effects of their tightening moves so far on inflation and the economy. They need to assess how far the moves already made will go toward their ultimate goals of a soft landing of the economy and sufficiently subdued inflation, ideally realized without hurting the job market too much.
The Fed II: Annual Rotation. With less dissention on the FOMC than in the recent past, the annual rotation of Fed voters (whereby four of the voting president-level participants are replaced by four others) matters less. So there’s less uncertainty about what happens next than what happens after the Fed arrives at its terminal-rate destination.
Let’s review the 2023 composition of the voters on the FOMC and the gist of their latest policy-related comments before their quiet period began:
(1) Fed Governor Brainard. Fed Governor Lael Brainard, as a nearly decade-long member of the Fed’s Board of Governors, is in Powell’s inner circle. Her voice matters for rate moves probably more than some of the other newer, less experienced Fed governors. “Even with the recent moderation, inflation remains high, and policy will need to be sufficiently restrictive for some time to make sure inflation returns to 2% on a sustained basis,” Brainard said in a January 19 speech.
Downshifting the pace of increases “will enable us to assess more data as we move the policy rate closer to a sufficiently restrictive level,” she added. Brainard noted “we are not currently experiencing a 1970s-style wage-price spiral.” She concluded: “For these reasons, it remains possible that a continued moderation in aggregate demand could facilitate continued easing in the labor market and reduction in inflation without a significant loss of employment.” In other words, Brainard sees a soft landing with ongoing restrictive policy.
(2) Fed President Williams (New York FRB, voter). As a permanent voting president and FOMC vice-chair, John Williams’ words carry weight too. “We are seeing the shifting gears of tighter monetary policy having the desired effects,” Williams said in a recent speech. But with “inflation still high and indications of continued supply-demand imbalances, it is clear that monetary policy still has more work to do to bring inflation down to our 2% goal on a sustained basis.”
“Bringing inflation down is likely to require a period of below-trend growth and some softening of labor market conditions,” he added, saying also that “the labor market remains remarkably tight.” He concluded that “restoring price stability is essential to achieving maximum employment and stable prices over the longer term, and it is critical that we stay the course until the job is done.”
(3) Fed Governor Waller. Fed Governor Christopher Waller joined the Board in 2020, after positions at the FRB (Federal Reserve Bank) of St. Louis. The business sector’s evidence of slowing demand is exactly what the Fed is aiming for, Waller said on January 20. Waller favors a 25-basis point increase at the next meeting.
(4) Fed Governor Bowman. A relative Fed newbie, Michelle Bowman joined the Board in 2018 and was reappointed in January 2020. Earlier this month, she said during a speech: “In recent months, we’ve seen a decline in some measures of inflation but we have a lot more work to do, so I expect the [FOMC] will continue raising interest rates to tighten monetary policy.” Once a sufficiently restrictive federal funds rate is reached, “it will need to remain at that level for some time in order to restore price stability, which will in turn help to create conditions that support a sustainably strong labor market,” she concluded.
(5) Fed Governor Cook. Another new addition, Lisa Cook joined the board last year. During a January 6 speech, she shared her thoughts on inflation in a supply-constrained economy. She reviewed several “novel” inflation indicators she monitors, noting that they show signs of inflation moderating.
However, she cautioned: “Crucially, we must be vigilant to ensure that pandemic-era cost pressures and disruptions do not have lasting effects on inflation. If cost shocks and supply disruptions keep inflation elevated for a long enough period, households’ and firms’ inflation expectations could move higher—a development that could put additional upward pressure on inflation.”
(6) Fed Governor Jefferson. Also new to the Board as of 2022 but not new to the Fed, Jefferson worked previously as a Fed economist. So far, he has given only two speeches, both last year. In November, he discussed inclusivity, saying that “strong demand and a variety of supply constraints have contributed to the fastest increases in consumer prices since the early 1980s. Inflation, too, has disproportionate effects on, and is felt most acutely by, those who can least afford it.”
Before that, he said that he was concerned about disparities in employment among racial groups, but that “these disparities have almost returned to the narrower ranges we saw just before the pandemic.” In other words, Jefferson came into this year more concerned about inflation than unemployment.
(7) Fed Governor Barr. Michael Barr joined the Fed as governor and vice chair for Supervision, in charge of monitoring banks, in July 2022. Lately, Barr hasn’t said much about interest rates, more focused on the banks and climate policy. His earliest policy objective, announced in September, was to impose a climate stress test on the banks. We suppose that Barr will vote with the crowd to slow rate hikes at the next meeting.
(8) Fed President Harker (Philadelphia FRB, voter). Harker is a familiar face on the FOMC, and he agrees with the majority of officials thinking that a 25-basis-point increase is appropriate next, with “a few more” rate hikes before a pause.
(9) Fed President Goolsbee (Chicago FRB, voter). Austan Goolsbee just took his post as FRB-Chicago’s president this month. He may not be as dovish as Charles Evans, whom he replaces. “If you’re raising 75 basis points a meeting, we’re going to have to figure out what the timing is of the pivot,” he said following the release of October’s CPI report. “Unless and until you get that core monthly inflation down in a comfortable range, I think the voices that are saying ‘slow down, cool off’ are still going to be a little muted.”
(10) Fed President Logan (Dallas FRB, voter). Prior to her FRB-Dallas post, Lori Logan served in FOMC and FRB-NY positions. After the Fed pauses, “we’ll need to remain flexible and raise rates further if changes in the economic outlook or financial conditions call for it,” said Logan in a recent speech. “I believe we shouldn’t lock in on a peak interest rate,” she said, adding that further rate hikes could follow any potential pause if inflation is not sufficiently subdued.
(11) Fed President Kashkari (Minneapolis FRB, voter). Neel Kashkari has been a vocal participant in FOMC meetings since he became a FRB president in 2016 and is currently among its most hawkish members. In a recent essay, he wrote: “I have us pausing at 5.4%, but wherever that end point is, we won’t immediately know if it is high enough to bring inflation back down to 2% in a reasonable period of time. ... Any sign of slow progress that keeps inflation elevated for longer will warrant, in my view, taking the policy rate potentially much higher.”
Market Timing
January 24 (Tuesday)
Check out the accompanying pdf and chart collection.
Executive Summary: Both the stock market’s and the bond market’s October bottoms have held so far—following the script we outlined as a possibility back that month. It involved moderating inflation, which we’ve seen, an end to Fed tightening, which we should see soon, and better GDP growth than we had expected, i.e., no landing so far. On the other hand, yesterday’s LEI report suggests a hard landing, while the CEI suggests a soft landing. … Also: We share insights from market maven Joe Feshbach, who notes some auspicious signs in measures of breadth. … And: We look at some total-return statistics to emphasize the importance of dividends to returns.
Strategy I: Revisiting the Bottoms. During 2022, the S&P 500 bottomed on October 12, and the 10-year Treasury yield peaked on October 24. Our October 18, 2022 Morning Briefing was titled “Going Fishing.” We were fishing for reasons to call the bottoms in bond and stock prices. We observed that when the yield curve inverts, it’s time to anticipate a peak in the 10-year US Treasury bond yield, which we predicted would be 4.00%-4.25% in early November. We also concluded that the June 16 low might provide support for the S&P 500 after all.
In the October 31, 2022 Morning Briefing, Joe and I wrote: “The stock market has been working on forming a bottom since September, finding support around the June 16 low of 3666 … That bottom should hold if real GDP growth, on a y/y basis, hovers between 0.5% and 1.5% through the first half of next year and then recovers to more normal growth during the second half of next year… In addition, it should hold if the Fed delivers two more hikes in the federal funds rate by the end of this year (as is widely expected) and then pauses rate-hiking during the first few months of next year. Furthermore, the bottom should hold if inflation shows clear signs of moderating in coming months, as we continue to expect.”
How is this scenario working out? Consider the following:
(1) Three hikes and a pause. The Fed hiked the federal funds rate by 75bps on November 2 and 50bps on December 14 to a range of 4.25%-4.50%. It is widely expected that the Fed will increase the federal funds rate by 25bps at each of the next three meetings of the FOMC to 5.00%-5.25% (on February 1, March 22, and May 3) and then pause during the June and July meetings.
(2) The bond market dissents. Interestingly, as the FOMC voted to raise the federal funds rate at each of its meetings last year, there were no dissenters on the committee. (See our searchable archive of FOMC statements since 1997.) However, the 2-year US Treasury yield started to dissent following the December 14 meeting. This yield has been a great leading indicator of the federal funds rate (Fig. 1). It anticipated the Fed’s rate hikes last year by rising from 0.25% in mid-2021 to peak at 4.72% on November 7, 2022 (Fig. 2). Since then, it dropped to 4.14% last Friday.
The 2-year yield is clearly signaling that the end of the Fed’s monetary policy tightening is near and that the federal funds rate won’t stay above 5.00% for long, notwithstanding recent protestations by Fed officials that they have no intentions of lowering the federal funds rate this year. The widening inversion of the yield-curve spread also is at odds with the Fed’s current official stance (Fig. 3 and Fig. 4).
(3) Inflation falling. Inflation has moderated significantly in recent months. Leading the way higher during 2021 and 2022 was the durable goods inflation component of the CPI (Fig. 5). It peaked at a record 18.7% y/y during February 2022, falling to -0.1% during December. We’ve previously observed that durable goods prices have tended to fall since the mid-1990s until the recent pandemic-related spike. They could resume their deflationary tendency this year.
The CPI’s nondurable goods inflation component also soared during 2020 and 2021, peaking at 16.2% during June 2022. It was down to 7.3% at the end of last year. It is volatile and hard to predict. Nevertheless, we predict that it will continue to moderate. Both petroleum and food prices are likely to remain high, but not likely to go higher this year.
That leaves us with CPI services inflation, which shows no sign of peaking, rising to 7.5% at the end of 2022. Actually, services inflation has peaked according to the final demand PPI for consumption services (Fig. 6). This series, which reflects the prices received by providers of consumer services, is down from a high of 8.1% during March 2022 to 4.4% at the end of the year. Unlike CPI services, the PPI for consumption services does not include rent, which tends to lag rents on new leases by 12-24 months; on new leases, rent inflation has been falling significantly in recent months (Fig. 7).
(4) No landing so far. So far, the economy has proven to be remarkably resilient in the face of the Fed’s extraordinary tightening of monetary policy. Real GDP rose around 3% (saar) during H2-2022. There was no landing last year. Yesterday’s release of December’s leading and coincident economic indicators (LEI and CEI) showed that the former fell 1.0% (down 6.0% since last February’s record high), while the latter edged up 0.1% to a new record high, after no change in November (Fig. 8). Only the industrial production index contributed negatively to the CEI in December—the same as in November.
The LEI’s weakness last year suggests a hard landing this year, but it might be partly attributable to its strength during 2021, when it was boosted by pandemic-related factors. In yesterday’s Morning Briefing, we discussed a few other reasons why we aren’t alarmed by the LEI’s fall. The recent flattening of the CEI at a record-high level is consistent with our soft-landing scenario. On a y/y basis, the CEI was up 1.8% during December, also consistent with our soft-landing outlook (Fig. 9).
Strategy II: Two Tough Decisions. The problem with timing corrections and bear markets in stock prices is that it requires two great calls—namely, when to get out and when to get back in again. We’ve had more great calls calling bottoms than calling tops. Nevertheless, we tend to agree with both Warren Buffett and Jeremy Siegel that investors do best when they hold stocks for the long run. We don’t mind being in the same camp with these two “permabulls.”
Nevertheless, here are a few market-timing notions:
(1) Feshbach’s latest trading call. One of the best market timers we know is Joe Feshbach. We were colleagues at Prudential-Bache Securities during the 1980s. I’ve been summarizing his views on a weekly basis since the beginning of last year. Here are his latest thoughts he shared with me, this past weekend:
“The good news is the market got bumpy as predicted, and it lasted a whole two days. The chart I’ve been alluding to still remains short-term bullish, and I still believe the S&P 500 has a shot at 4100+. However, the sentiment indicators are not great at this time, and thus that’s all I see for this rally phase.”
(2) Great breadth. Joe was impressed with Friday’s rally “with great breadth.” He likes to track the New York Stock Exchange’s advance/decline lines by the number of securities (up or down) and by their volumes (up or down), as well as the ratio of the equal-weighted (EW) S&P 500 index to the market-cap-weighted (MW) index (Fig. 10 and Fig. 11). The first two may be on the verge of breaking out to the upside of downward channels that started in 2021. The third ratio is at its highest since February 2019, a year before the pandemic caused the ratio to plunge when the MegaCap-8 stocks outperformed for a short while (Fig. 12).
(3) Don’t forget about dividends! Finally, Joe Abbott and I continue to work on comparing the relative returns of the S&P 500’s EW and MW indexes. We’ve broadened our analysis to include the total return versions of the two (Fig. 13). Our preliminary conclusion is an obvious one: Don’t forget about the positive contribution that dividends make to investing in stocks over the long run!
Over the short term, dividends may not be as important as getting the market-cap weighting right:
The S&P 500 LargeCap index is down 17.2% since last year's January 3 peak (through Friday’s close). The total return index is down 15.7%. The LargeCap EW index is down 9.4%. The LargeCap EW total return index is down 7.6%. Diversification and dividends cushioned the downside.
Since last year’s October 12 low, all have done well, some more than others: The S&P 500 is up 11.1% and the total return index is up 11.6%, while the EW index is up 15.2% and the EW total return index is up 15.8%.
Another Recession Alarm Ahead
January 23 (Monday)
Check out the accompanying pdf and chart collection.
Executive Summary: Brace yourself for December’s Leading Economic Indicators and Coincident Economic Indicators coming out today. They are likely to trigger another recession alarm. But we still see greater odds of a soft landing (60%) than a hard one (40%). … What can the LEI and CEI tell us about the economy and what can’t they? Today, we discuss their usefulness and limitations. … Also: They aren’t the only economic indicators worth watching. ... And: Dr. Ed reviews “The Menu” (+ + +).
YRI Weekly Webcast. Join Dr. Ed’s live webcast with Q&A on Mondays at 11 a.m. EST. You will receive an email with the link one hour before showtime. Replays of the weekly webcasts are available here.
US Economy I: Leading Indicators Flashing Recession Signal. This morning at 10:00 a.m., December’s Index of Leading Economic Indicators (LEI) and Index of Coincident Economic Indicators (CEI) will be released by the Conference Board. Both are very likely to sound the recession alarm, which has been going off more often recently, unnerving stock investors. Recession fear also has sent interest rates lower, suggesting that the Fed’s monetary policy tightening is already restrictive enough to bring down inflation.
If the Fed proceeds with additional interest-rate hikes, the recession alarm would likely sound even louder and more often. We don’t like to ignore alarms, but we still aren’t alarmed enough to change our 60% odds of a soft landing and 40% odds of a hard landing. Consider the following:
(1) LEI predicting imminent recession. The LEI peaked at a record high last year during February (Fig. 1). It is down 4.9% since then through November. It probably fell again during December. On average, it has peaked 12 months before the past eight peaks in the CEI, which coincided with the peaks in the business cycle. So the LEI is suggesting that the next recession should begin next month.
The LEI was down 4.5% y/y during November (Fig. 2). It turned negative on this basis just before the peaks of the past eight business cycles. There have been a few previous minor false alarms. But currently, the LEI’s recession alarm is sounding loud and clear and is signaling an imminent recession.
(2) LEI giving too much weight to goods, nothing to services. The LEI includes 10 economic indicators (Fig. 3). The three financial components are the leading credit index, the S&P 500, and the interest spread between the 10-year Treasury bond and the federal funds.
The seven nonfinancial components are initial unemployment claims, consumer expectations, house building permits, the ISM index of new manufacturing orders, average weekly hours in manufacturing, manufacturers’ nondefense capital goods orders (estimated), and manufacturers’ new orders for consumer goods & materials (estimated). The Conference Board also adds a “trend adjustment factor.”
Notice that four of the nonfinancial indicators are related to manufacturing. In the past, manufacturing was among the most cyclical economic sectors. The consumer is represented by three of the nonfinancial indicators. Like manufacturing, housing is also a very cyclical sector of the economy. Notably absent are any variables for services.
(3) Another LEI decline likely in December. The LEI probably fell slightly during December. What do we know? Housing permits contracted 1.6% last month (Fig. 4). ISM new orders fell sharply from 47.2 in November to 45.2 in December (Fig. 5). The yield-curve spread turned negative when the Fed raised the federal funds rate in December to -48bps from 11bps the month before (Fig. 6). The S&P 500 averaged 3,912.38 during December, down a bit from 3,917.49 during November. We also know that the average manufacturing workweek edged down from 40.2 hours in November to 40.1 in December (Fig. 7).
On the other hand, jobless claims remained very low during December, averaging 217,600 versus 229,000 during November (Fig. 8). The job market remains strong. In addition, the consumer expectations index rose to 71.2 during December, up from 66.1 during November (Fig. 9).
(4) Credit crunch is MIA. The leading credit index is a proprietary component of the LEI compiled by The Conference Board. It is designed to monitor credit conditions, which have gotten tighter in 2022 than in 2021 (Fig. 10). However, this index remains relatively low compared to the spikes during the last four recessions.
Our nonproprietary indicators for financial conditions are the yield spread between high-yield corporate bonds and the US 10-year Treasury and the S&P 500 VIX (Fig. 11). Neither of them is signaling a credit crunch and a recession.
One of the major reasons we are not in the recession camp is that we don’t anticipate a credit crunch. We think that the financial system is in very good shape and can handle the Fed’s aggressive monetary policy tightening without a credit crunch, which occurred during previous tightening rounds and led to recessions.
US Economy II: Defining a Recession With Coincident Indicators. As noted above, it is very likely that the CEI declined during December from its record high the month before. That could mark the start of a recession if the CEI continues to drop in coming months. Data since 1959 show that the CEI’s peaks and troughs tended to coincide with the start and end of the nine recessions since then.
The Dating Committee of the National Bureau of Economic Research (NBER) determines the official start and end of recessions. The popular belief is that two consecutive down quarters in real GDP define a recession. The committee doesn’t rely on this simple rule of thumb. Instead, it takes a more eclectic approach to declaring recessions:
“The NBER’s traditional definition of a recession is that it is a significant decline in economic activity that is spread across the economy and that lasts more than a few months. The committee’s view is that while each of the three criteria—depth, diffusion, and duration—needs to be met individually to some degree, extreme conditions revealed by one criterion may partially offset weaker indications from another. For example, in the case of the February 2020 peak in economic activity, we concluded that the drop in activity had been so great and so widely diffused throughout the economy that the downturn should be classified as a recession even if it proved to be quite brief. The committee subsequently determined that the trough occurred two months after the peak, in April 2020. An expansion is a period when the economy is not in a recession. Expansion is the normal state of the economy; most recessions are brief. However, the time that it takes for the economy to return to its previous peak level of activity may be quite extended.”
In our opinion, it isn’t necessary to have a PhD in economics to be on the Dating Committee. The cyclical peaks and troughs of the CEI define the ups and downs of the business cycle. Indeed, the committee’s FAQ page acknowledges:
“The determination of the months of peaks and troughs is based on a range of monthly measures of aggregate real economic activity published by the federal statistical agencies. These include real personal income less transfers (PILT), nonfarm payroll employment, real personal consumption expenditures, wholesale-retail sales adjusted for price changes, employment as measured by the household survey, and industrial production. There is no fixed rule about what measures contribute information to the process or how they are weighted in our decisions.”
Nevertheless, that statement explicitly lists the four components of the CEI as particularly relevant to the committee’s deliberations. Two mentioned aren’t in the CEI, namely real personal consumption expenditures and household employment. The former is highly correlated with PILT, while the latter is just a more volatile alternative to payroll employment.
In this context, consider the following:
(1) CEI’s four components. The CEI rose to a record high during November. It includes four economic indicators, namely, payroll employment, real personal income less transfer payments (in 2012 dollars), industrial production, and real manufacturing & trade sales (in 2012 dollars). The CEI, like the LEI, gives more weight to goods than to services. While the first two indicators mentioned above are related to consumers’ purchases of both goods and services, the last two focus on the production and sales of goods.
(2) December’s CEI should be flat to down. What do we know about prospects for the December CEI? Payroll employment rose 223,000 during December to a new record high. Last month’s personal income won’t be released until January 27. However, Debbie and I can derive our Earned Income Proxy (EIP) for private wages and salaries in personal income based on the data provided in December’s employment report for payrolls, weekly hours, and average hourly earnings (Fig. 12). Our EIP rose only 0.2% m/m during December, implying that adjusted for inflation, it rose 0.1% since the CPI was down 0.1% m/m during the month. So the LEI’s personal income component was probably flat in December.
We also know that industrial production fell 0.7% m/m during December and that November’s output was revised down from -0.2% to -0.6%. It’s hard to assess whether real manufacturing and trade sales will be up or down in December’s LEI. We know that nominal retail sales fell 1.1% m/m during the month. So most of the weakness was likely attributable to lower prices. The goods CPI fell 1.1% m/m during December.
(3) CEI’s tracking record. During the last nine recessions, the CEI declined an average of 5.2% over an average of 12 months. Its y/y growth rate closely tracks the comparable growth rate of real GDP (Fig. 13). The former was up 1.9% y/y through November, while the latter was also up 1.9% but through Q3-2022.
During previous recessions, the y/y growth rate in the CEI fell close to zero around the start of the downturns, with the troughs in this growth rate coinciding with the end of the recessions.
US Economy III: Additional Leading Indicators. Debbie and I monitor other economic indicators that also tend to be leading indicators of the business cycle. They provide a mixed outlook:
(1) S&P 500 forward earnings. The y/y growth rate of S&P 500 forward earnings tends to closely track the comparable growth rates of both the CEI and real GDP (Fig. 14 and Fig. 15). It’s a leading indicator because we use weekly data to calculate forward earnings, so it’s a much timelier indicator than the monthly CEI and quarterly GDP. During the January 12 week, forward earnings was up only 2.1% y/y. (FYI: Forward earnings is the time-weighted average of analysts’ consensus operating earnings-per-share estimates for this year and next.)
We think that forward earnings growth will remain positive, though low, as occurred during the mid-cycle slowdowns during the mid-1980s, mid-1990s, and 2010s. If it turns decisively negative, then you won’t need us to tell you that the economy is in a recession.
(2) Various payrolls by industries. Two of our favorite payroll employment series that closely tracked the LEI in the past are the ones for truck transportation and temporary help services (Fig. 16 and Fig. 17). The former rose to a record high during December, while the latter peaked at a record high last year during July and is down 3.5% since then.
(3) Purchasing managers index. The ISM’s purchasing managers index for manufacturing is highly correlated with the yearly percent change in the LEI (Fig. 18). Both are currently in recession territory based on their history during previous downturns.
(4) FedEx. Joe and I are also examining the weekly forward earnings of specific S&P 500 companies to see if any might be useful leading indicators. So far, we have our eyes on FedEx: In this context, the freefall in FedEx’s forward earnings late last year is unsettling (Fig. 19).
FedEx may be more useful as a leading indicator of the global economy than just the US. In recent weeks, the macroeconomic outlook has improved for the world economy, in our opinion. Investors seem to agree with us. FedEx’s stock price is up 31% since it bottomed on September 26 last year.
Movie. “The Menu” (+ + +) (link) is a pretentious movie about pretentious people, i.e., the connoisseurs of haute cuisine and other know-it-alls. It is very clever, funny, and wickedly entertaining. Imagine being stuck on an island with Gordon Ramsey, who vents his temper on you and the other dinner guests at his restaurant before each course rather than at his subservient staff. Ralph Fiennes plays the lead masterfully. He does most of the talking, leaving little room for anyone else to say much more than “Yes, Chef!”
Health Care, Going Global & ChatGPT
January 19 (Thursday)
Check out the accompanying pdf and chart collection.
Executive Summary: The S&P 500 Health Care sector sheltered investors from the ravages of last year’s bear market, but it’s been underperforming since the market began to recover in mid-October. Jackie examines why other sectors might be more alluring now and why investors are looking past meager 2023 growth prospects for select health care companies active in M&A. … Also: Why have global stocks begun outperforming US stocks? Fears not materializing in Europe and China are part of the picture, US economic uncertainty and middling earnings growth prospects are another. … And: In a world where AI programs can write like humans, what could go wrong? Plenty.
Health Care: Looking for the Right Rx. Over the past year, the S&P 500 Health Care sector lived up to its defensive reputation and gained 0.5% even as the S&P 500 lost 14.4%. No matter how much the Fed raises interest rates, people still get sick, need to visit the doctor, and buy medicine. But since the S&P 500 began to rally after bottoming on October 12, the Health Care sector has begun to underperform other sectors. It may continue to do so if this rally has legs and investors are lured instead to sectors that have underperformed over the past year, offer faster earnings growth prospects, or both.
The performance derby for the S&P 500 and its 11 sectors on a y/y basis through Tuesday’s close shows that the Health Care sector has provided excellent shelter for investors as the market fell: Energy (40.5%), Utilities (2.7), Health Care (0.5), Consumer Staples (-2.9), Industrials (-4.0), Materials (-6.3), Financials (-12.2), S&P 500 (-14.4), Real Estate (-17.8), Information Technology (-21.4), Consumer Discretionary (-29.6), and Communication Services (-34.9) (Table 1).
Since the S&P 500 bottomed in October, however, the Health Care sector has lagged the broader market. Here’s the S&P 500 performance derby from October 12 through Tuesday’s close: Materials (21.1), Industrials (19.9), Financials (18.6), Real Estate (16.7), Utilities (15.9), Energy (12.2), Information Technology (12.0), S&P 500 (11.6), Consumer Staples (10.8), Health Care (10.6), Communication Services (5.9), and Consumer Discretionary (-0.8) (Table 2).
Analysts expect a 3.5% decline in earnings for the Health Care sector this year, below the 2.8% gain that’s forecast for the S&P 500 and below those of most sectors: Consumer Discretionary (28.3%), Industrials (13.4), Financials (12.9), Utilities (7.5), Communication Services (5.8), Consumer Staples (3.2), S&P 500 (2.8), Information Technology (0.2), Health Care (-3.5), Materials (-11.5), Energy (-14.5), and Real Estate (-14.8).
Here's a look at some of the headwinds and tailwinds affecting health care companies, including patent expirations, wage pressures, and litigation settlements:
(1) M&A saves the day. Investors may be looking past drug patent expirations and betting that drug companies have the financial wherewithal to buy and develop smaller companies’ drugs to fill the void. That would explain why the S&P 500 Pharmaceuticals industry’s stock price index has risen 9.9% from the market’s October 12 low through Tuesday’s close, even though analysts’ consensus forecasts have the industry’s earnings falling 6.0% this year and rising just 4.7% in 2024 (Fig. 1). Likewise, the S&P 500 Biotechnology industry’s stock price index has jumped 13.2% since October 12 even though its earnings are forecast to drop 14.9% this year and rise only 2.4% in 2024 (Fig. 2).
Consider AbbVie, a member of the S&P 500 Biotechnology index. It lost patent protection on Humira—a drug that treats rheumatoid arthritis and Crohn’s disease, among other ailments, and that kicked in more than a third of the company’s sales last year. AbbVie has been making small acquisitions, most recently in October when it purchased DJS Antibodies. DJS develops antibody medicines that target disease-causing proteins. That followed AbbVie’s purchase last spring of Syndesi Therapeutics, which makes drugs that improve cognitive function, including one to treat Alzheimer’s. Investors clearly approve: AbbVie’s shares have rallied 8.0% since October 12 even though analysts see its earnings per share falling from $13.83 in 2022 to $11.81 this year.
Likewise, Pfizer’s earnings per share is forecast to drop from $6.48 in 2022 to $4.69 this year, but its stock has rallied 9.9% since the market’s October’s low. Patent expirations are expected to reduce the company’s revenue by $17 billion by the decade’s end, but management plans to replace this revenue through internal drug development and acquisitions. Pfizer purchased Biohaven and its migraine drugs for $11.6 billion in May 2022 and Global Blood Therapeutics, a sickle cell disease drug maker, for $5.4 billion in October.
In addition to patent expirations, some drug companies will face mounting price pressure from the US government. The Health and Human Services Department will publish in September a list of the 10 most popular drugs covered by Medicare, on which it will launch price negotiations under new powers granted by the Inflation Reduction Act. The list will include only drugs that have been on the market for at least seven years without generic competition or 11 years for biological products like vaccines.
Price negotiations will begin in 2025 and go into effect in 2026. It’s unknown which drugs will make the list, but here are the most expensive drugs for Medicare Part D (purchased by seniors though pharmacies) in 2020, according to a January 12 CNBC article: Bristol-Myers’ Eliquis and Revlimid, J&J’s Xarelto, Merck’s Januvia, Eli Lilly’s Trulicity and Jardiance, AbbVie’s Imbruvica and Humira, Sanofi’s Lantus Solostar, Pfizer’s Ibrance, and AstraZeneca’s Symbicort. The list will expand in subsequent years.
(2) Labor woes. Hospital staffing has improved dramatically from the depths of the Covid pandemic, when traveling nurses were being called in and earning premium pay. But the tight overall labor market continues to empower today’s workers to demand higher pay. Monday’s WSJ carried an article about doctors in residency and fellowship programs forming unions faster than usual: Five teaching hospitals faced such activity last year, up from two in 2021 and the normal pace of one per year. Residents are pushing for fewer hours and improved wages, particularly in pricey metropolitan areas.
In addition, more than 7,000 unionized nurses at Montefiore Medical Center and Mount Sinai Hospital in New York City went on strike for three days earlier this month, returning to work after reaching a tentative deal that includes 19%-plus wage increases over three years and enforceable patient-to-nurse ratios. The deal, according to a January 12 WSJ article, is similar to the new contracts recently agreed to by three other NYC hospitals.
The share prices of HCA Healthcare and Universal Health Services both fell sharply early in 2022 as investors learned that higher-than-expected labor costs were eating into the companies’ profits. Both stocks since have bounced back, leaving the S&P 500 Health Care Facilities stock price index up 1.9% y/y through Tuesday’s close (Fig. 3). Analysts are optimistic that the industry’s revenue and earnings will climb by 4.1% and 7.5% this year and 5.7% and 13.3% in 2024 (Fig. 4 and Fig. 5).
(3) Distributors’ stocks on fire. Shares of the S&P 500 Health Care Distributors industry have had quite the run, soaring 35.7% y/y through Tuesday’s close and 14.0% since the market’s October 12 low (Fig. 6). Cardinal Health and McKesson shares are the standouts, both are up more than 40% y/y. AmerisourceBergen, Cardinal, and McKesson benefitted from entering a $19.5 billion opioid-related lawsuit settlement with most US states early last year, ending some of the uncertainty about their opioid-related liability.
The industry’s earnings are expected to rise a respectable 5.4% this year and 12.7% in 2024, and analysts’ net earnings revisions have been positive lately (Fig. 7). Despite the strong stock price performance last year, the industry’s forward P/E of 14.2 is well above its March 23, 2020 low of 8.5 but not far from its recent high in early December of 14.7 (Fig. 8).
Strategy: Time To Go Global? This year has kicked off with international stocks outperforming US stocks by a large margin. The ratio of the US MSCI stock price index relative to the All Country World ex-US MSCI stock price index, measured in dollars, peaked on October 28 and has fallen 14.1% since then (Fig. 9). In local currencies, the ratio peaked just over a year ago, on December 27, 2021, and since has fallen 12.2%. Is this just a short-term reversal, giving US stocks time to breathe before continuing their outperformance, or should investors pack their bags and Go Global? Let’s have a closer look:
(1) The Boogie Man fails to appear. Recent months have not brought the misfortunes that were widely expected to befall China and Europe. China started providing financial support to its ailing real estate developers, stopped picking on its technology companies by slapping them with new regulations, and lifted its zero-Covid rules. These moves should allow its economy to pick up speed in 2023 after logging only 3% real GDP growth last year. The China MSCI stock price index bottomed on October 31 and has risen 49.1% since then (Fig. 10).
Mother Nature was kind enough to bestow a warm winter on Europe, which should leave enough natural gas for Europeans to heat their homes and run their businesses through this winter. That was not a given after Russia sharply reduced natural gas deliveries last summer. The price of natural gas spiked to €339 MWh during August 2022 before recently dropping back down to €60 MWh (Fig. 11). The Europe MSCI stock price index bottomed on September 29 and since has rallied 19.6% in local currency; in dollars, it bottomed on September 27 and has rallied by 31.7% (Fig. 12).
(2) US recession fears strike. Meanwhile, the US Federal Reserve has been more aggressive in tightening monetary policy than was expected as recently as last summer, which has left most economists expecting a US recession sometime soon (though we do not fall into that camp). Rising interest rates and a Covid hangover has burst the MegaCap-8 stocks’ bubble and dragged down the S&P 500. The US MSCI stock price index peaked on December 27, 2021 and has fallen 18.0% through Tuesday’s close (Fig. 13).
Exacerbating these trends is the US dollar, which after climbing higher since May 2021 has suddenly reversed course and fallen 7.6% since its peak on October 19, 2022 (Fig. 14).
(3) Looking abroad for earnings growth. US MSCI earnings is expected to grow by 3.2% this year, landing the US in the middle of the pack in terms of countries’ 2023 earnings growth prospects. Topping the list is Sri Lanka (55.2%) and in last place is the Czech Republic (-38.5). Notable are the strong earnings expected for India (21.3), China (14.4), and Mexico (9.1) and the weak earnings growth expected for Latin American countries like Brazil (-18.0), Chile (-14.0), and Colombia (0.1). (Data isn’t provided for Argentina and Russia.)
European countries are expected to post mixed earnings growth in 2023, with Portugal (20.8), the Netherlands (20.6), and Switzerland (17.9) posting strong earnings growth and Denmark (-22.7), Austria (-12.7), and Norway (-12.3) the weakest.
Here are the 2023 earnings growth estimates for the following regions: Emerging Markets Asia (2.4%), US (3.2), World (2.1), World ex-US (1.1), EMU (0.9), Emerging Markets (0.6), Europe (0.3), and Emerging Markets Latin America (-12.9) (Fig. 15).
(4) Multiples dropping around the world. The US MSCI forward P/E has contracted sharply over the past two years. It peaked at 23.3 in January 2021 and since has fallen to 17.7. That brings the index’s forward P/E back to the midpoint of its 25.2-9.5 range since the start of the century. Other countries have experienced multiple contraction as well. The forward P/E on the All Country World ex-US MSCI index has fallen to 12.4 from a recent peak of 17.1 in February 2021 (Fig. 16).
Disruptive Technologies: Thinking About ChatGPT. There’s no doubt about it: ChatGPT has writing chops. Some of the samples we read may have lacked creative flourishes, but they certainly looked like writing that could have been produced by a human. Earlier this week, Microsoft, an investor in ChatGPT’s creator OpenAI, announced plans to incorporate artificial intelligence into all of Microsoft’s existing products and give companies access to OpenAI tools so that they can create applications using AI.
We tried to get on the OpenAI website to test it for ourselves numerous times yesterday. But the site was at capacity and asked us to try back later. We certainly will. But until then, here are some of the things that ChatGPT is reportedly good and not good at doing:
(1) It’s fast. ChatGPT has absorbed large volumes of data from the Internet written by humans. It can turn around an article or email much faster than its human counterpart.
(2) It’s good. ChatGPT was asked to write 50 abstracts about medical research papers published in various industry publications, a January 12 article in Nature reported. A plagiarism checker didn’t flag any plagiarism in any of the AI-generated abstracts.
An AI-output detector was able to identify 66% of the ChatGPT-written abstracts as penned by AI. Humans reading the abstracts didn’t fare much better. They identified only 68% of the AI-generated abstracts correctly, misidentifying the other 32% as human, and they got 86% of the human-generated abstracts right, missing the other 14%. In other words, ChatGPT is pretty darn good.
(3) It’s not current. ChatGPT isn't connected to the Internet, and it has limited knowledge about things that occurred after 2021. This likely will be fixed overtime.
(4) It publishes errors with authority. Users report that ChatGPT sometimes produces incorrect answers, but it does so in a sentence or paragraph that’s still well written. As a result, readers say it can be tricky to flag when ChatGPT has made a mistake, especially if the reader isn’t knowledgeable about the subject.
CNET uses AI to generate articles about basic financial subjects, like compound interest, and until recently it used the human-sounding byline “CNET Money Staff.” Only after clicking on the byline would a reader learn that the article was AI generated. A few articles contained errors highlighted in a January 17 article in Futurism. CNET published an article confirming that it used AI to generate about 75 articles that were subject to review by a human editor. Future bot-written articles will carry the byline “CNET Money” and disclose: “This article was assisted by an AI engine and reviewed, fact-checked and edited by our editorial staff.” AI-generated mistakes that slip by the human fact-checkers will be publicly corrected.
Two old sayings come to mind. “Mom always said not to believe everything you hear.” It’s always important to know the source of information, and ChatGPT would be wise to provide the sources used to create its essays so the accuracy can be verified.
The second saying comes from Jackie’s high school computer teacher: “Junk in, junk out.” In other words, computers’ output is only as good as the programs they’re fed. The same goes for ChatGPT essays. Now that AI has made creating content fast and cheap, evaluating what we read online has grown even trickier.
Some Happy Developments
January 18 (Wednesday)
Check out the accompanying pdf and chart collection.
Executive Summary: When the equal-weighted S&P 500 price index outperforms the market-cap-weighted one, that signals rising stock market breadth. That’s what’s been happening since October 12, the date that the bear market probably ended. … Also: Wall Street has turned more bullish on prospects for Europe’s economy and stock markets in the wake of two big happy developments there. We’re in the bullish camp. … European economic indicators suggest a budding recovery—with improving energy markets tempering inflation and bolstering industrial production as well as both consumer and business sentiment.
Weekly Webcast. If you missed Tuesday’s live webcast, you can view a replay here.
US Strategy I: Equal-Weighted S&P 500 Index Outperforming. The S&P 500 comes in two flavors, i.e., the widely followed market-cap-weighted index (MW) and the equal-weighted index (EW) (Fig. 1). They track one another closely. Nevertheless, the ratio of the EW to the MW indexes provides some interesting insights into the stock market (Fig. 2). It is a measure of the breadth of the market. When the ratio is rising (falling), breadth is broadening (narrowing).
Stock market technicians tend to raise a warning flag when they see the ratio decline during a bull market since that indicates that fewer stocks are participating in the rally and those that are participating tend to be the ones with the most market capitalization. That describes what happened during the second half of the 1990s and the second half of the 2010s.
The ratio plunged during the pandemic year of 2020 when the MegaCap-8 stocks massively outperformed the rest of the market because they were deemed to be among the few companies that would benefit from the economic consequences of the health crisis. Since the end of the bear market last year on October 12 (assuming we are right that it ended then), EW has outperformed MW.
Consider the following performance derbies since January 3, 2022, which was the peak of the previous bull market:
(1) January 3, 2022–January 13, 2023. Since the start of the bear market through last week’s close, the MW index was down 16.6%, while the EW index was down 8.4%. That’s a rather startling divergence.
(2) October 12, 2022–January 13, 2022. Much of that divergence occurred since last year’s bear market bottom as the MW rose 11.8%, while the EW increased 16.4%. We think it is a bullish development to see the rally broaden to include more stocks. It tends to confirm our view that the bear market bottomed on October 12.
(3) January 3, 2022–October 12, 2022. Since the start of the bear market through its low last year, the MW index was down 25.4%, while the equal-weighted index was down 21.3%.
(4) S&P 500 sectors since October 12, 2022. The outperformance of the EW index relative to the MW index since October 12 of last year is attributable to four sectors, namely Communication Services, Consumer Discretionary, Information Technology, and Health Care. The first three, on a market-cap basis, were weighed down by the MegaCap-8.
Here is the performance derby for the S&P 500 EW versus MW and the 11 sectors since October 12: S&P 500 (16.4%, 11.8%), Communication Services (13.9, 6.9), Consumer Discretionary (19.8, -0.8), Consumer Staples (9.5, 10.8), Energy (10.9, 12.0), Financials (15.4, 19.4), Health Care (16.4, 11.1), Industrials (19.6, 20.9), Information Technology (17.2, 11.5), Materials (20.6, 22.5), Real Estate (13.3, 16.6), and Utilities (15.9, 16.1).
US Strategy II: Trader’s Corner. Here is Joe Feshbach’s latest call on the stock market: “The market has rallied according to plan, accompanied by improving breadth numbers. The put/call ratio has moved back to neutral. I would’ve preferred to have seen the rally be met with more skepticism. So while the market should eventually get to the upper end of its trading range, the path could get a bit bumpy soon. The stochastic chart I alluded to last week remains bullish, and I believe it is signaling a very good probability that the S&P 500’s two recent highs at 4100 will eventually be surpassed.”
Europe I: Spring Is Coming. “[N]ow may be a good time to buy and hold European stocks given how cheap they’re trading relative to recent history. But it could take some time for the gas shortage, rising interest rates, resulting inflation, and a likely recession to shake out,” Melissa and I wrote on June 29 of last year. Going long Europe is working out well, as the region’s prospective economic positives seem to be materializing even faster than we anticipated.
(By the way, on June 23, 2022 Bloomberg reported that “Ray Dalio’s Bridgewater Associates has built a $10.5 billion bet against European companies, almost doubling its wager in the past week to its most bearish stance against the region’s stocks in two years.”)
Two unpredictable situations have played out in Europe’s favor so far. Firstly, a warm winter there has mitigated the widely feared gas crisis spurred by the war in Ukraine; it hasn’t become much of a crisis after all. Secondly, China—a major trading partner of Europe—has abandoned its restrictive zero-Covid policies; had it not done so, the fear was that supply-chain issues would worsen Europe’s fate, along with weaken European exports to China.
Indeed, Europe is not recession-proof. Inflation persists. The European Central Bank is plugging along with its plans to continue to tighten monetary policy. But we remain sanguine about the European economy and European stocks (see our December 7 Morning Briefing).
Let’s first review the positive turn in current events for Europe before updating the region’s latest economic indicators:
(1) Lack of snow melts away recession risks. Europeans’ fears about the gas crisis leaving them in the cold and dark this winter were all for naught. Unusually warm temperatures have left Alpine ski resorts snowless. Reuters reported that temperatures in Switzerland averaged the warmest on record during 2022. It was the warmest Christmas Eve in Budapest and the warmest New Year’s Eve in France on record. French and Spanish ski resorts also were closed over the winter holiday owing to a lack of snow.
(2) Europe buys time to winterize. Certainly, the warmer weather provided European governments with more room to resolve their energy problems, but are they over yet? Probably not. One of the problems is that Europe’s gas reserves are meant to solve seasonal issues; they are not strategic reserves to prevent embargoes or blockades. But the more gas remaining at the end of this season, the less gas needed to fill the tanks for next winter, which will buy Europe a good amount of time to sort out its energy strategies going forward.
It wasn’t just lucky weather that helped Europe avert an economic meltdown this season. Governments scrambled to unwind their reliance on Russian energy, especially natural gas, as Bloomberg discussed. The European Union is no longer importing coal and crude oil from Russia, and gas deliveries have been significantly curtailed. Some of the gap has been filled by increasing supplies from Norway and shipments of liquefied natural (LNG) gas from Qatar, the US, and other producing countries. New LNG facilities in Germany are becoming operational. And renewable capacity expansion also is also expected to help plug the energy holes.
China’s zero-Covid policies lessened global competition for LNG shipments (and eased global price pressures) as consumption there dwindled. But China has turned to more affordable fuel options, including coal, pipeline gas and domestic production, Bloomberg observed. So plenty of affordable LNG may remain available for Europe’s taking.
(3) Surplus & high prices cool gas prices. Both higher-than-average gas prices and higher-than-average temperatures helped curb consumption this winter as LNG inflows reached record highs. Europe’s gas inventories are at the second highest level in a decade, reported Reuters. Gas Infrastructure Europe’s Aggregated Gas Storage Inventory shows that the EU’s gas tanks are over 80.0% full as of January 16, whereas winter drawdowns normally would have depleted much more of the reserves. In following with the seasonal gas surplus, benchmark natural gas prices in Europe reached the lowest level since before the war, Bloomberg reported on January 2.
(4) Sanctions on Russian energy heat up. On February 5, Europe is planning to block imports of Russian diesel and other refined products, the WSJ has reported. That same day, the Western allies are preparing to cap prices on Russian exports of refined petroleum. Two price limits will be set: one for high-value products like diesel and one for low-value exports like fuel oil.
Already, the EU and its allies have capped prices on Russian crude. But as we had expected, the price cap didn’t have much impact because it was set at $60 per barrel, not much lower than the current oil price. Also so-called shadow tankers outside the jurisdiction of the cap-setting countries carried oil to destinations in Asia that had no cap. But Europe’s blockade may reverberate around the globe this time because of the specialized tankers needed to carry petroleum products across the sea.
(5) As China turns, so does the consensus. More lucky news for Europe is the China reopening story. China is the EU’s leading trading partner, representing about 16% of all goods trade, Reuters noted. That’s led analysts to jettison their previous recommendations to underweight Europe, which reflected not just the war but also supply-chain pressures and lower demand from China. Goldman Sachs expects China’s Covid policy pivot to mitigate European recession risks. AXA Investment Managers says that China demand will offset downside risks elsewhere. Chinese travel could benefit European luxury stocks, says UBS.
Europe II: Green Shoots. With Europe’s energy markets easing and consumers feeling less squeezed, consumer demand could start picking up. Manufacturers could start to see orders rebound. Inflation broadly is still high in the region but should moderate this year, as fiscal policymakers have eased up on their stimulus efforts and as the European Central Bank (ECB) policymakers have been aggressively raising interest rates.
Here’s a look at the latest economic indicators, which are starting to show green shoots:
(1) Europeans turning more optimistic. The European Economic Sentiment Index (ESI) rebounded in November and December after dropping from June through October (Fig. 3). The consumer component of the ESI has recently turned upward after falling for several months (Fig. 4).
Probably the best news about Europe lately has also been the most recent—Germany’s IFO surveys. The IFO Business Confidence index turned significantly higher during the final three months of last year (Fig. 5). This occurred following six consecutive falls in survey respondents’ assessment of the current situation through November. Expectations also improved noticeably.
(2) Inflation could be moderating. Recently, we wrote that inflationary pressures in Europe should ease over the longer term as the war-related, energy-related, and supply-chain challenges abate. That may be starting to happen. The Eurozone CPI had soared 10.6% y/y during October, surpassing the previous several months’ record highs. But it eased to 10.1% in November and 9.2% in December, according to the flash estimate, led by falling energy prices (Fig. 6 and Fig. 7). Excluding energy, food, alcohol, and tobacco, the CPI slowed as housing prices moderated, undoubtedly in part due to the ECB’s efforts to moderate inflation (Fig. 8 and Fig. 9). (The Eurozone’s final reading for December’s CPI is due out this morning.)
(3) Industrial production meltdown averted. Europe’s industrial production on a y/y basis had fully recovered to pre-pandemic levels until the war on Ukraine heated up energy prices (Fig. 10). Manufacturers have had to reduce their production not only out of concern for a possible drop in demand on the heels of the widely anticipated recession but also to conserve energy.
Sure, energy prices have come way down since last November, but likely “would have to stay at lower levels for months for factories to raise output significantly, and for the benefits to trickle down to consumers, analysts and companies,” wrote the WSJ on January 6. “The worst-case scenario that threatened us this summer has been avoided so far … a complete meltdown of the heart of European and German industry has been averted,” German Economy Minister Robert Habeck said earlier this month.
(4) German orders stagnant & auto production healthy. Incoming orders for manufacturers in Germany, the EU’s largest economy, fell during November after a slight uptick in the previous month (Fig. 11). German automakers are seeing an upturn in demand (Fig. 12). That’s mainly because they still have a backlog of orders from the post-pandemic supply-chain pileup. Automakers may have averted a rougher road ahead as gas prices ease up.
(5) Growth could turn up soon. Eurozone real GDP for Q3-2022 was revised up slightly from the initial flash estimate (Fig. 13). On an annual basis, growth was up 2.3% y/y (revised up from 2.1%). Now that energy prices are down sharply and China has reopened, Europe’s growth prospects are looking up.
(6) Labor market remains strong. The unemployment rate in the Eurozone, now at 6.5%, has dropped well below even pre-pandemic levels (it was 7.2% when the pandemic began in March 2020). Europe’s labor market never took a dramatic hit during the pandemic largely because job-retention schemes maintained worker-employer bonds. The labor market remains exceptionally strong considering all the ups and downs that Europe recently has encountered.
(7) Stock prices catching up with analysts. The Europe MSCI Index is up 31.5% in dollar terms through January 16 from a recent low on September 27 as Russia’s war on Ukraine escalated (Fig. 14). Our Blue Angels Implied Price Index shows that European valuations are still attractive but slowly becoming less so as investors’ price expectations catch up to analysts’ positive views (Fig. 15). Analysts have been raising their earnings expectations for months despite all the bad headlines (Fig. 16).
Inflation: Persistent, Transitory, or Both?
January 17 (Tuesday)
Check out the accompanying pdf and chart collection.
Executive Summary: Consensus economic views seem to be mostly pessimistic. Big bank CEOs are preparing for a mild recession. Americans are skittish about a downturn, most economists project a recession, and lots of investment strategists remain bearish. But not us: We don’t foresee recessions this year in the US, Europe, or China. And we think 2023 will be an up year for the stock market. … Also: Goods inflation is proving transitory. Services is less so, hiked by unusually high rent inflation. And: a closer look at the Fed’s core services ex housing costs CPI. … Dr. Ed’s review of “The Banshees of Inisherin” (+).
YRI Weekly Webcast. Join Dr. Ed’s live webcast with Q&A on Tuesday at 11 a.m. EST this week (usually on Mondays at 11 a.m.). You will receive an email with the link to the webinar one hour before showtime. Replays of this and previous webcasts are available here.
Strategy: Fluid Consensus. It’s hard to be a contrarian for very long these days because the consensus seems to change so quickly. At the end of last year, there seemed to be widespread agreement that the first half of 2023 would continue to be bad for stocks as the Fed continues to raise interest rates and the market discounts a recession during H2-2023. The bear market in stocks was expected to continue through mid-year, with the major stock market averages falling to new lows before the start of a bull market during H2-2023 as the market started to discount a better 2024. The year has barely started, yet the consensus already seems to be turning less pessimistic. Consider the following:
(1) The boy who cried “hurricane” all the way to the bank. Leading the consensus on the economic outlook has been JPMorgan Chase CEO Jamie Dimon. In May of last year at an annual conference sponsored by AllianceBernstein, Dimon told a group of investors that a “hurricane” was coming for the economy. “Right now, it’s kind of sunny, things are doing fine, everyone thinks the Fed can handle it,” he said at the time. “That hurricane is right out there down the road coming our way. We don’t know if it’s a minor one or Superstorm Sandy. You better brace yourself. JPMorgan is bracing ourselves.”
Early last week, in an interview with Fox Business, Dimon said, “I shouldn’t have ever used the word ‘hurricane.’ What I said was there were storm clouds which may mitigate, and people said, ‘Oh, he doesn’t think it’s a big deal.’ So I said, ‘No, those storm clouds could be a hurricane.” Is that clearer now? In any event, Dimon’s bank is now calling for a “mild recession” later this year.
As a result, the bank increased its loan-loss reserves by $1.4 billion in Q4-2022. In a Friday earnings call with analysts, CFO Jeremy Barnum said that JPMorgan is now on track to resume share purchases this quarter and reiterated that both small businesses and consumers are “generally on solid footing.”
JPMorgan’s profit for the three months ended December 31 was $11.0 billion compared with $10.4 billion a year earlier.
(2) The other big banks add to loss reserves too. Also on Friday, during Bank of America’s earnings call, CEO Brian Moynihan said, “Our baseline scenario contemplates a mild recession.” He elaborated: “[W]e also add to that a downside scenario, and what this results in is 95% of our reserve methodology is weighted toward a recessionary environment in 2023.” During Q4, the bank set aside $1.1 billion for credit losses.
Wells Fargo set aside $957 million for credit losses during Q4, and Citigroup set aside $640 million. In addition, Citigroup CFO Mark Mason told reporters on Friday that his “base case” for the US is a “mild recession in the latter part of 2023.”
So the four banks collectively set aside a total of around $4 billion in funds to prepare for bad loans (JPMorgan’s $1.4 billion, Wells Fargo’s $957 million, Bank of America’s $1.1 billion, and Citi’s $640 million).
Fed data on total allowances for loan losses at the large commercial banks showed an increase of $8.3 billion from the last week of Q3-2022 through the last week of Q4-2022 to $169.1 billion (Fig. 1). The bankers reported that their net interest income increased as both business and consumer loans continued to rise (Fig. 2). JPMorgan’s Dimon said there was more competition for deposits as higher rates were causing customers to migrate to investments and other cash alternatives, meaning that the bank was “going to have to change saving rates.”
(3) The public is anxious. According to a new Gallup poll, Americans are increasingly pessimistic about the country’s prospects in 2023. The poll shows that 79% of respondents think we’re heading into a year of “economic difficulty,” while just 18% say it will be one of “economic prosperity.” In addition, 65% say prices will continue to rise at a high rate. When asked about the stock market, 63% expect it will fall this year. Democrats are more optimistic on the economy and stocks, at 36% and 53%, while Republicans are much more pessimistic, at 4% and 15%. (Our advice to Republicans: Never let your political views get in the way of your investment decision making.)
Measures of consumer optimism remain depressed, especially the expectations components (Fig. 3 and Fig. 4). However, the latter have rebounded a bit during December and January, mostly because of falling gasoline prices.
(4) Pessimistic economists. In his December 4, 2022 WSJ column titled “Economists Think They Can See Recession Coming—for a Change,” James Mackintosh wrote: “The regular Wall Street Journal survey finds economists think there is a 63% chance of recession in the next year. And a survey of economists and investors by the Federal Reserve Bank of Philadelphia shows expectations that gross domestic product will fall in three or four quarters are by far the highest since it started in 1968.”
The Philly Fed’s Survey of Professional Forecasters, which started during Q4-1968, includes the “Anxious Index,” which is the probability of a decline in real GDP (Fig. 5). The survey asks panelists to estimate the probability that real GDP will decline in the quarter in which the survey is taken and in each of the following four quarters. The Anxious Index shows the probability of a decline in real GDP in the quarter after a survey is taken. For example, the survey taken in Q4-2022 yielded an Anxious Index reading of 47.2%, which means that forecasters believe there is a 47.2% chance that real GDP will decline in Q1-2023. That reading is the highest since Q2-2009. The probability of a recession over the next four quarters was 43.5%, the highest on record (Fig. 6).
The WSJ released its latest quarterly survey of economists on Sunday: “On average, business and academic economists polled by the Journal put the probability of a recession in the next 12 months at 61%, little changed from 63% in October’s survey. Both figures are historically high outside actual recessions.”
(5) Strategists mostly bearish. Bloomberg’s Lu Wang wrote a December 1, 2022 article titled “Wall Street Turns Bearish on Stocks After Bad Year.” She reported: “The average forecast of handicappers tracked by Bloomberg calls for a decline in the S&P 500 next year, the first time the aggregate prediction has been negative since at least 1999. Most of them turned progressively more dour as the worst year in the market since the financial crisis moved toward its end.”
Lu also observed: “In almost a century of historic data, two straight years of losses or more only occurred on four separate occasions, with the latest episode coming during the bursting of the dot-com bubble.” Furthermore, during those four episodes, the drop during the second consecutive down year was greater than the one during the first (Fig. 7).
(6) Our outlook. We think 2023 will be an up year for the S&P 500. One of the many reasons is that since 1942, during each of the 3-month, 6-month, and 12-month periods following each of the 20 mid-term elections, the S&P 500 was up on average by 7.6%, 14.1%, and 14.9% (Fig 8).
More fundamentally, we expect that the US economy won’t fall into a recession this year. Neither will Europe or China, in our opinion. So the outlook for global growth is a positive rather than a negative one. In the US, we expect that consumer spending will continue to grow and that fiscal spending and onshoring will boost public and private spending on infrastructure. Chronic labor shortages should stimulate spending on productivity-enhancing technologies and capital equipment.
The consensus may be turning more optimistic as stock prices continue to build on the rally since last year’s October 12 low. But at the end of last year, our sense was that the consensus outlook of strategists was another tough year for the market because of a recession during the second half of the year. That scenario suggested that the stock market would be down during the first half of this year, up during the second half of the year (as investors started discounting a better 2024), but unchanged at best for the year as a whole.
We’re thinking the latest rally might continue through mid-year. The summer could be tough for stocks if Democrats and Republicans can’t get a quick deal on the debt ceiling. However, a deal should get done before Congress breaks for the summer vacation. Then we see the rally resuming through year-end, with the market up for the year and getting closer to its record high of January 3, 2022. That’s as long as the consensus doesn’t get too bullish.
US Inflation: Mixed Signals. Contrary to popular as well as expert opinion, inflation may turn out to be more transitory than persistent. Whether you agree with one or the other view depends on your time frame. In any event, goods inflation in the CPI is turning out to be more transitory than services inflation in the CPI, which has been more persistent so far. However, even that last point is debatable given that much of the persistence in services inflation in the CPI is attributable to rent inflation, which is a very odd duck. We know for sure that rent inflation in new leases is turning out to be transitory, but that’s not exactly how the CPI measures rents.
Then again, to be fair to the persistent camp, wage inflation is certainly showing signs of persistence because of the chronic shortage of labor. The question is whether that will fuel a wage-price spiral or whether wage inflation will persist but moderate somewhat while exceeding transitory price inflation. If you are getting dizzy, that’s because spirals have that effect. Now consider the following:
(1) CPI goods prices. In the CPI, the inflation rate for goods peaked at 14.2% y/y during March 2022 (Fig. 9). It fell to 4.8% during December, the lowest reading since March 2021.
The CPI inflation rate for consumer durable goods plunged from last year’s peak of 18.7% during February to -0.1% during December (Fig. 10). That certainly can be characterized as “transitory.”
The jury is out on whether “transitory” will best describe the CPI inflation rate for consumer nondurable prices. It peaked at 16.2% during June of last year and fell to 7.3% during December (Fig. 11).
The CPI goods inflation rate excluding food and energy has dropped from a peak of 12.3% during February 2022 to only 2.1% during December (Fig. 12).
(2) CPI services excluding rent of shelter. There’s no debating that inflation remains persistent in services.
On November 30, Fed Chair Jerome Powell delivered a speech titled “Inflation and the Labor Market” at the Brookings Institution. He discussed three major categories of consumer price inflation: “Core goods inflation has moved down from very high levels over the course of 2022, while housing services inflation has risen rapidly.” He focused on core services ex housing, saying “[T]his may be the most important category for understanding the future evolution of core inflation. Because wages make up the largest cost in delivering these services, the labor market holds the key to understanding inflation in this category.”
In the speech, he discussed a measure of this third category based on the PCED and calculated by the Fed’s staff (Fig. 13). We don’t have a comparable CPI measure other than CPI core services less rent of shelter (Fig. 14). It tends to run hotter than the Fed’s PCED-based measure because medical care services inflation tends to run hotter in the CPI than in the PCED (Fig. 15).
The core services ex housing in the PCED rose 4.3% y/y through November. It has been stuck around this pace for the past year, showing no signs of heading lower. In the almost-comparable CPI measure, it was down from a high of 8.2% last year to 6.3% in December.
The big outlier in the CPI services category has been transportation services, at 14.6% y/y during December (Fig. 16). That should moderate in line with falling fuel prices but with a lag, although rising labor costs may be an offset.
(3) Wage inflation. There is a correlation between the Fed’s new favorite inflation flavor of the month and the y/y percent change in average hourly earnings (Fig. 17). The good news is that wage inflation does seem to be moderating from last year’s peak of 6.7% in March to 5.0% in December.
(4) Rent inflation. While you’ve probably had enough of this inflated analysis of inflation, allow us to observe that rent inflation on new leases continues to fall. According to ApartmentList, it was down to 3.9% y/y during December, while the CPI measure of primary residential rent inflation was still moving higher last month, to 8.3% (Fig. 18). The former suggests that the latter should peak around mid-year.
Movie. “The Banshees of Inisherin” (+) (link) is a quirky movie with quirky characters that takes place on a quirky remote mythical island off the coast of Ireland. It a darkly comic allegory for the Irish Civil War. It has a fine cast led by Colin Farrell and Brendan Gleeson in Oscar-worthy performances. Their characters have been friends for a long time until one of them decides he no longer wants to remain friends. The movie also includes a memorable performance by Jenny, a miniature donkey, and a “scene stealer” according to Farrell.
Financials, Materials & Robots
January 12 (Thursday)
Check out the accompanying pdf and chart collection.
Executive Summary: Yes, most banks and brokerages’ Q4 results will be down y/y, but investors already knew that. As long as earnings reports don’t bring much new negative news, the S&P 500 Financials sector’s rebound may continue, buoyed by easy y/y comparisons ahead. … Also: The World Bank‘s global growth forecast for this year is now a grim 1.7%. But you’d never know it from the surge in metals prices and the S&P 500 Materials sector since October. The strong dollar, China’s lockdown unlocking, and Europe’s energy resourcefulness no doubt have helped. … Also: How robots are about to transform farming, EV fueling, and manufacturing productivity.
Financials: Looking Forward to Easier Comps. Over the next two weeks, big banks and brokers will be reporting Q4 results that are expected to fall y/y. But if the earnings reports don’t contain any negative surprises, the strong rebound occurring in the S&P 500 Financials sector may continue as investors focus on 2023, when y/y comparisons are much easier than they were in 2022.
Jefferies Financial Group kicked off the earnings season for the S&P 500 Financials sector on Monday, reporting fiscal Q4 (ended November 30) earnings of $0.57 per share, down 53% y/y but hitting the consensus estimate of Wall Street analysts. Jefferies shares—which swooned more than 30% during the first half of 2022—since have recouped almost all of their lost ground and are down only 3.4% over the past year. After the earnings release, the shares rallied, ending Tuesday up 3.8%, besting the S&P 500’s 0.7% Tuesday gain. The firm doesn’t provide earnings guidance; but it didn’t announce any negative surprises, and that was enough to gladden investors.
The S&P 500 Financials sector has outperformed the S&P 500 from the index’s October 12 low through Tuesday’s close. Here’s the performance derby for the S&P 500 and its 11 sectors since the market’s low-water mark: Materials (19.3%), Industrials (19.2), Financials (17.3), Utilities (16.3), Real Estate (12.0), Consumer Staples (11.1), Health Care (10.4), S&P 500 (9.6), Energy (9.4), Information Technology (8.4), Communication Services (4.0), and Consumer Discretionary (-4.5).
Within the Financials sector, all of the industries but one—Regional Banks—has outperformed the S&P 500 since its October 12 low: Reinsurance (37.6%), Asset Management & Custody Banks (32.1), Multi-line Insurance (21.3), Diversified Banks (20.5), Multi-Sector Holdings (19.8), Investment Banking & Brokerage (18.1), Financial Exchanges & Data (16.1), Property & Casualty Insurance (15.1), Life & Health Insurance (13.8), Insurance Brokers (12.4), Consumer Finance (10.0), and Regional Banks (3.9) (Table 1).
Let’s take a look at some of the areas that will influence what type of year Financials sector companies face in 2023:
(1) Pros and cons of higher rates. The jumps in interest rates during 2022 were a double-edged sword. Higher interest rates meant that banks’ loans brought in more interest income. Loans and leases outstanding for all commercial banks is at a record high of $12.0 trillion, and the collective net interest margin rose to 3.14% during Q3-2022 (Fig. 1 and Fig. 2).
Conversely, however, high interest rates killed banks’ mortgage business, with the interest rate on the 30-year mortgage at 6.65% (Fig. 3). The mortgage refinancing business dried up; so did demand for new mortgages, as home sales fell sharply (Fig. 4 and Fig. 5). At this point, it’s tough to see the activity declining much further, which could be setting the industry up for easier comparisons this year.
Wells Fargo, however, isn’t waiting around to see what happens. On Tuesday, the bank announced plans to dramatically shrink its home lending business, blaming the move on the scandals and fines that have plagued the division. Wells Fargo no longer will purchase mortgages from third parties, but it will continue to provide mortgages to existing customers and minority borrowers.
It will be important to watch the spring home selling season for signs that buyers are returning to the market now that rates have stopped advancing. Equity investors seem confident that the worst may be behind us. The S&P 500 Homebuilding stock price index is up 26.6% since the October 12 market low.
(2) Investment banking comps could get easier. With both the stock and bond markets falling last year, CEOs put the breaks on acquisitions and selling stocks or bonds. As a result, 2023 y/y investment banking revenue comparisons look much, much easier than they were at the start of 2022.
Global investment banking revenue peaked in Q4-2021 at $33.9 billion, more than twice the $15.5 billion of investment banking revenue generated in Q4-2022, according to Dealogic data in the WSJ. Revenue from M&A transactions dropped from $14.1 billion in Q4-2021 to $7.8 billion in Q4-2022. Equity capital markets revenue fell from $8.3 billion in Q4-2021 to $2.9 billion last quarter. Revenue from debt capital markets shrank from $6.1 billion in Q4-2021 to $3.1 billion last quarter. And revenue from loans dropped from $5.4 billion in Q4-2021 to an amount that didn’t register on the chart last quarter, $1.7 billion.
During the course of 2023, comparisons to last year will get easier and easier. Here’s the progression of global investment banking revenue data from Dealogic since the Q4-2021 peak: Q4-2021 ($33.9 billion), Q1-2022 ($24.8 billion), Q2-2022 ($19.2 billion), Q3-2022 ($18.0 billion), and Q4-2022 ($15.5 billion).
Jefferies’ fiscal Q4 net investment banking and capital markets revenue dropped to $1.05 billion, down sharply from the $1.6 billion of a year earlier but not much worse than the August quarter’s $1.1 billion. As fiscal 2023 proceeds, Jefferies’ y/y comparisons will be easier.
Flat or rising equity and bond markets could provide even more of a tailwind. Jefferies noted that while its fixed-income capital markets business was down for the year, revenue in its final quarter was up more than 71% y/y, “and we carried that momentum through the first month of fiscal 2023.”
(3) Reducing shares outstanding. Jefferies has been using the past year to repurchase shares, and that has benefitted the bottom line. The weighted average basic shares outstanding fell to 239.3 million in the November quarter, down 8.5% from 261.6 million shares in the year-earlier quarter. And the company said its board of directors has increased the share buyback authorization to $250 million.
(4) Clouds to watch. There’s the potential for rain on the banks’ bullish-outlook parade if they need to increase reserves on expectations that defaults will start to rise. So far, credit quality has remained high for both businesses and consumers. The US corporate bond default rate is under 2.0%, and Fitch Ratings expects it to rise only to 2.5%-3.5% this year and 3.0%-4.0% in 2024.
But the 8.16% yield on high-yield corporate bonds may be indicating that the default rate could rise more than expected (Fig. 6). The higher yield on the high-yield index can partially be attributed to the jump in Treasury yields. But the spread between high-yield bonds and the 10-year US Treasury also has increased, to 455 basis points (Fig. 7).
Consumer debt levels are high, but as of Q3 consumers generally were current on their credit card payments, and the household debt service ratio remained low (Fig. 8 and Fig. 9). JPMorgan CEO Jamie Dimon continues to believe the US consumer is strong. “Their balance sheets are in good shape, they’re spending 10% more than pre-COVID, they have more in their checking account, companies are in good shape, and that’s driving a strong economy,” he told Fox Business on Tuesday.
Commercial bank allowances for loan and lease losses ticked up slightly at the end of last year (Fig. 10). It’s certainly something to track when many of the large banks and brokers report earnings later this week. And recent job losses, primarily in technology-related industries, will keep us watching for any uptick in the unemployment rate.
(5) Analysts’ expectations. The S&P 500 Investment Banking & Brokerage industry is expected to see revenue drop 10.0% in 2022 and then increase 6.3% this year (Fig. 11). After falling 27.1% last year, the industry’s earnings are expected to jump 16.2% in 2023 (Fig. 12).
The S&P 500 Diversified Banks industry should see the modest 2.8% increase in revenue in 2022 improve to an 8.0% jump in revenue this year (Fig. 13). The improvement in earnings is forecast to be even more dramatic, as 2022’s 23.4% drop in earnings becomes a 15.3% increase in 2023 (Fig. 14).
Because it has less exposure to the capital markets, the S&P 500 Regional Banks’ results weren’t hurt as much as those of the Diversified Banks and Investment Banking industries last year, so Regional Banks’ expected rebound isn’t as dramatic. The S&P 500 Regional Banks industry is expected to grow revenue by 11.2% in 2022 and 9.4% in 2023 (Fig. 15). Earnings for the industry are forecast to drop 3.1% in 2022 and jump 9.6% this year (Fig. 16).
Materials: Surging into 2023. The World Bank cut its forecast for global economic growth this year to 1.7%, down from its June forecast of 3.0%. The organization blamed high inflation, rising interest rates, lower investment, the Ukraine war, and the impact of Covid and an ailing real estate market in China, a January 10 WSJ article reported.
Commodity stock investors appear to disagree with the World Bank’s assessment. The S&P 500 Copper stock price index has risen 55.0% from the S&P 500’s October 12 low through Tuesday’s close. Not far behind is the S&P 500 Steel stock price index, up 23.6%, and the overall S&P 500 Materials sector has risen 19.3% during that period as well.
The Metals segment of the CRB Raw Industrials Spot price index—composed of copper scrap, lead scrap, steel scrap, tin and zinc—also has bounced, rising 17% from its October 31, 2022 low through Tuesday’s close, though it remains 25% off its 2022 peak (Fig. 17). Copper futures have jumped 27% since bottoming on July 14 of last year (Fig. 18). And Midwest domestic hot-rolled coil steel prices recently popped 12% off their lows but remain very depressed compared to highs at the end of August 2021 (Fig. 19).
A weaker dollar could be boosting metals prices. The US trade-weighted dollar has declined 6.6% since its peak on October 19, 2022 (Fig. 20). But we wouldn’t underestimate the positive impact that investors believe China’s reopening and Europe’s success so far in accessing fuel to power its factories and homes will have on the global economy.
Disruptive Technologies: Ubiquitous Robots. CES—billed as “the most influential tech event in the world,” held in Las Vegas from January 5-8—featured the expected gaggle of cute robot dogs, smart toilets, and companion robots. But three innovations in particular caught our eye, two from this year’s event: a fertilizing machine and a mobile electric vehicle (EV) charger. The last, from CES 2022, is still just a glimmer in the eye of a visionary robotics company, but an intriguing one that could dramatically boost productivity. Let’s have a look:
(1) Robots on the farm. John Deere introduced ExactShot, a farm machine that can detect and fertilize individual seeds. It aims to reduce fertilizer use by as much as 60%, saving farmers money and reducing the amount of chemical put in the ground. Instead of shooting out a steady stream of fertilizer, the machine uses sensors to shoot out a burst of fertilizer that hits an individual seed and leaves the surrounding area untouched.
Expect field equipment to grow even more sensitive in upcoming years. “Eventually, we will literally treat every plant on an acre of a field differently based on what we’re learning through our computer vision and machine learning technology,” said a Deere executive in a January 6 CNET article. In the June 18, 2020 Morning Briefing, we discussed how robots were improving farm productivity and mentioned Deere’s See & Spray machine, which can differentiate between a weed and a desired plant, spraying herbicides only on the weeds.
(2) Robots in the garage. Parky is a robot that contains a battery that can be used to charge an electric car. It aims to eliminate the problem of having all of a parking lot’s EV chargers taken by cars that have finished charging but haven’t left the parking spot.
Parky was developed by privately held EVAR, a spin-off from Samsung Electronics C-Lab. A car can pull into a parking garage and park next to a designated pole. When the driver plugs in the car, a signal is sent to Parky with the car’s location. Parky autonomously rolls over to the car’s location, docks, and sends electricity from its battery to the car in need. When charging is complete, Parky returns to its own charging station and awaits the arrival of the next car that needs to be charged.
(3) Controlling robots via the metaverse. Today, a US-based engineer might have to travel to China to fix factory equipment in that country. A CES 2022 presentation by executives of Hyundai and Boston Dynamics—the robotics company that Hyundai purchased in 2021—describes engineers in the future saving their frequent flier miles and using the metaverse and robots to fix equipment on a factory floor on the opposite side of the world.
The folks at Hyundai and Boston Dynamics envision a day when US-based technicians, instead of flying to China, simply put on a headset and gloves and connect to the metaverse, where a digital twin of the Chinese factory appears. In the digital factory is the image of a robot that’s connected to an actual robot in an actual factory in China. The US technician would communicate with and manipulate the robot in China through the metaverse. Leveraging the capabilities of the Internet, the metaverse, and robots in tandem could dramatically increase productivity and, as one executive on the panel said, make time and distance irrelevant.
Last summer, the Boston Dynamics AI Institute was launched with $400 million of funding from Hyundai. Headed by Boston Dynamics founder Marc Raibert and Chief Scientist Al Rizzi, the institute will use the funding to advance artificial intelligence in robots. We’ll be watching.
Earnings Bottoming?
January 11 (Wednesday)
Check out the accompanying pdf and chart collection.
Executive Summary: Might the worst be over for corporate earnings? The earnings recession in some industries likely continued during Q4, with economically sensitive ones the worst hit. But Q4 may mark the bottom for earnings growth, as we don’t see a broad-based recession this year. … In yesterday’s Morning Briefing, we likened Fed Chair Powell’s bond-market conundrum to his predecessor Greenspan’s. But does Powell have a lever to hike bond yields that Greenspan didn’t? Perhaps, but pulling it is no option. … Consumers aren’t tapped out yet: Their revolving debt as a percent of income is only around pre-pandemic levels. … And: The labor market remains unbalanced.
Earnings: Searching for a Bottom. Is the worst ahead for S&P 500 earnings during 2023? Or are we about to see the worst during the Q4-2022 earnings season that starts this week? Joe and I think that earnings will be up this year compared to last year because we are in the soft-landing camp. Lots of other strategists expect that earnings will be down this year mostly because they are expecting a recession in 2023. For many companies and industries, 2022 looked like a recession. So perhaps they’ve seen the worst of their downturns? Consider the following:
(1) Revenues. There certainly was no recession in the revenues per share of the S&P 500 companies last year. Revenues growth exceeded 10% y/y during the first three quarters of 2022 (Fig. 1). It was up 13.0% during Q3-2022. Inflation clearly boosted revenues growth. However, even on an inflation-adjusted basis, revenues rose 5.5% y/y during that quarter (Fig. 2, Fig. 3, and Fig. 4).
In current dollars, revenues per share rose to record or near-record highs for 10 of the S&P 500’s 11 sectors—all but Communication Services (Fig. 5). Here are their y/y growth rates through Q3 and analysts’ current consensus expectations for Q4:
S&P 500 (13.0%, 4.1%), Communication Services (4.0, 0.3), Consumer Discretionary (12.4, 8.0), Consumer Staples (8.5, 4.6), Energy (49.5, 12.9), Financials (12.0, 6.4), Health Care (7.9, 2.5), Industrials (17.8, 9.2), Information Technology (6.2, -0.8), Materials (9.0, -3.5), Real Estate (8.3, 6.9), and Utilities (22.0, -18.7).
(2) Earnings. S&P 500 operating earnings per share also got a boost from inflation last year, but it was held down by eroding profit margins. The index’s y/y earnings growth rate peaked at 88.6% during Q2-2021 and fell to just 4.0% during Q3-2022 (Fig. 6).
The Energy sector more than offset the drop in S&P 500 earnings excluding this sector (Fig. 7). On a y/y basis through Q3-2022, here are the aggregate earnings growth rates of Energy (134.6%), S&P 500 (3.0%), and S&P 500 excluding Energy (-4.4%). Without Energy, the rest of the S&P 500 fell into an earnings recession during Q2 last year.
The earnings recession continued during Q4-2022, analysts’ projections suggest, measured both with and without Energy. Here is what industry analysts are projecting for the y/y change in Q4-2022 earnings (on a per-share basis): Energy (64.7%), S&P 500 (-2.2%), and S&P 500 excluding Energy (-6.7%).
Here are the analysts’ latest proforma y/y earnings growth rate estimates for the 11 sectors of the S&P 500 during the week of January 5 for Q4-2022 along with the actuals during the prior quarter: S&P 500 (-2.2%, 4.0%), Communication Services (-21.4, -24.4), Consumer Discretionary (-15.1, 5.5), Consumer Staples (-2.7, -0.2), Energy (64.7, 140.2), Financials (-8.7, -17.1), Health Care (-6.4, 0.4), Industrials (42.7, 18.8), Information Technology (-8.7, -2.1), Materials (-22.4, -10.1), Real Estate (6.9, 11.1), and Utilities (3.4, -5.4) (Fig. 8).
Notice that significant declines are expected for most of the economically sensitive sectors. The one surprising exception is Industrials because of the continued rebound in the Aerospace & Defense, Airlines, and Agricultural & Farm Machinery industries. Not surprising is the big increase estimated for Energy.
(3) Economic correlations. S&P 500 earnings growth is highly correlated with the national M-PMI (Fig. 9). The former peaked at the same time as the latter back in 2021. The M-PMI dropped from a high of 63.7 during March 2021 to 48.4 in December 2022, which is consistent with the small drop in earnings growth estimated by industry analysts.
The M-PMI is also highly correlated with our Net Earnings Revisions Index (NERI) (Fig. 10). NERI has been moving deeper into negative territory for the past six months through December. That’s consistent with our view that the economy has been in a rolling recession since early last year in response to the tightening of monetary policy by the Fed.
There might be more minor downside in the M-PMI ahead, but we are expecting it to move back above 50.0 as the current year progresses.
The Fed: Tale of Two Conundrums. In yesterday’s Morning Briefing, we wrote about the similarities between former Fed Chair Alan Greenspan’s conundrum from 2004-07 and current Fed Chair Jerome Powell’s conundrum in late 2022. Both were surprised that bond yields weren’t rising along with the federal funds rate during those periods. They were frustrated that the bond market was easing financial conditions while they were trying to tighten them.
A couple of our accounts observed that there is at least one huge difference between those two conundrums. The Fed’s holdings of securities were miniscule when Greenspan was in charge (Fig. 11). Under Powell, the Fed’s portfolio of Treasuries and mortgage-backed securities ballooned to a record high of $8.5 trillion during the week of May 18, 2022. Implemented last summer, the Fed’s QT2 program is on course to reduce that total by $2.8 trillion to $5.7 trillion by the end of 2024 (Fig. 12).
Our observant readers suggested an obvious solution to Powell’s conundrum. If he prefers to see the 10-year Treasury yield at 4.50% rather than at 3.50%, all he must do is announce that the pace of QT2 will be increased. The Fed is currently sitting on $5.5 trillion of Treasuries and $2.6 trillion of mortgage-backed securities (Fig. 13). Almost all of the latter matures in over 10 years, while $1.5 trillion of the Treasuries are over 10 years (Fig. 14).
Dumping more of those long-term securities would solve Powell’s conundrum immediately. In our opinion, it is very unlikely that the Fed will do that for fear of totally destabilizing financial markets—causing bond yields to soar, stock prices to crash, and the dollar to rebound.
US Consumer: Borrowing More. Are consumers almost tapped out of purchasing power? If so, then a consumer-led recession is likely sooner rather than later. That’s not our forecast, but it is a widespread concern. Consider the following:
(1) Excess saving. During 2020 and 2021, consumers accumulated $2.5 trillion in excess saving. Before the pandemic, their personal saving totaled about $1.0 trillion on a 12-month moving-sum basis (Fig. 15). It jumped to $3.5 trillion over the 12 months through March 2021. It plunged to $0.7 trillion through November.
(2) Credit cards. Consumers probably have enough excess saving to boost their purchasing power through year-end. But lots of them are also charging more on their credit cards. Consumer credit rose by a record $350 billion over the 12 months through November, little changed from October’s record $353 billion, with revolving credit up by a record $154.0 billion and nonrevolving credit (mostly student and auto loans) up by a near-record $195.5 billion (Fig. 16).
(3) Relative to DPI. Revolving credit outstanding totaled a record $1.2 trillion during November 2022 (Fig. 17). That was equivalent to 6.3% of disposable personal income, which was still below the pre-pandemic level of 6.5% (Fig. 18).
US Labor Market: JOLTS Still Out of Balance. According to the latest Job Openings & Labor Turnover Survey (JOLTS) report, the quits rate (i.e., the number of quits during the entire month as a percent of total employment) edged up again in November to 2.7% after trending down during the final two months of 2021 from a record high of 3.0% (Fig. 19). Quitters quitting at such rates shows not only widespread ability to get higher wages elsewhere but also widespread confidence about job market prospects.
Let’s look at more insights gleaned from the November JOLTS report:
(1) Hires trending down. The hire rate (i.e., the number of hires during the entire month as a percent of total employment) fell in November to 3.9%, not posting a gain since its recent high of 4.5% during February. Likely that’s not because of a lack of job openings but because of the continued labor shortage.
(2) Plenty of jobs. The job openings rate (i.e., the number of job openings on the last business day of the month as a percent of total employment plus job openings) continued to trend downward through November to 6.4% after hitting a record of 7.3% during March.
(3) Layoffs very low. Very few people are being laid off lately with employers in need of retaining what employees they do have, as the layoff rate during November was at a near-record low of just 0.9%.
(4) Across all industries. Here’s a list of the job openings rate by industry during November: Leisure & Hospitality (8.7%), Professional & Business Services (8.3), Education & Health Services (7.8), Manufacturing (5.7), Transportation & Utilities (5.4), and Construction (4.8) (Fig. 20). None of the industry job openings rates have returned to pre-pandemic levels yet.
(5) Leisure & Hospitality quitters. Prior to the pandemic, at the start of 2020, the job openings rate for Leisure & Hospitality was just 5.3%; it then lurched to a record high of 11.7% during December 2021. It has come down some but remains well elevated relative to pre-pandemic times.
Leisure & Hospitality workers are the biggest quitters of all. That’s the case both historically and recently, with a quits rate of 5.4% in November (Fig. 21). That’s perhaps not surprising given that they deal with the public daily. But the gap between this industry’s quit rate and the quit rate of all other industries has increased since the pandemic. Likely that reflects the added difficulties of serving the public while short-staffed.
By the way, the overall hires rate has been dragged down from pre-pandemic levels by two industries in particular: Leisure & Hospitality and Construction (Fig. 22). The job market story is different for these industries, however. In Leisure & Hospitality, the low hires rate reflects an imbalance of supply and demand for labor—i.e., employers would like to hire more than they can. Construction has both the lowest job openings rate (4.8%) and the lowest quits rate (1.8%) of all industries. Employers aren’t hiring, and workers aren’t leaving. That situation reflects the weak housing market.
Powell’s Conundrum
January 10 (Tuesday)
Check out the accompanying pdf and chart collection.
Executive Summary: US bond markets haven’t responded as expected to the Fed’s warnings not to expect the federal funds rate to be lowered this year. Bond investors seem unfazed by this, which is fazing Fed Chair Jerome Powell. He’s been fretting that easy financial conditions aren’t what the Fed needs to see at this time of tightening by the Fed. It’s all reminiscent of “Greenspan’s conundrum” during the early 2000s. The bond market then too seemed unaffected by the Fed’s tightening. This time, Fed officials have turned more hawkish because investors aren’t listening to their warnings. Perhaps, Fed officials should listen to the bond market.
Weekly Webcast. If you missed Monday’s live webcast, you can view a replay here.
Strategy: Don’t Fight the Bond Market. Fed Chair Jerome Powell and his colleagues at the Fed are puzzled and concerned. They don’t understand why the 10-year US Treasury bond yield has been falling since it peaked at 4.25% on October 24, 2022. It was down to 3.52% yesterday morning (Fig. 1). They are worried that the bond market isn’t getting their message. They intend to raise the federal funds rate, which is currently 4.50%, to at least 5.25%. When they deem that it is at a level that is restrictive enough to bring down inflation, they’ll keep it there until at least the end of the year. In other words, they will not be lowering the federal funds rate in 2023. Consider the following:
(1) The December meeting and presser. On January 4, the Fed released the minutes of the December 13–14 FOMC meeting. The committee raised the federal funds rate by 50bps following four straight 75bps increases. The committee also issued projections showing more federal funds rate hikes totaling 75bps this year. The minutes reinforced the FOMC’s united resolve to bring inflation down. The minutes also reflected the committee’s frustration with the bond market as well as the stock market and the trade-weighted dollar:
“Participants noted that, because monetary policy worked importantly through financial markets, an unwarranted easing in financial conditions, especially if driven by a misperception by the public of the Committee’s reaction function, would complicate the Committee’s effort to restore price stability.”
During Powell’s press conference following the December FOMC meeting, CNBC’s Steve Liesman asked: “Since the November meeting, the 10-year has declined by 60 basis points, mortgage rates have come down, high-yield credit spreads have come in, the economy’s accelerated, and the stock market’s up 6%. Is this loosening of financial conditions a problem for the Fed in its effort, and its fight, against inflation? And, if so, do you need to do something about that? And how would you do something about that?”
The phrase “financial conditions” appeared 13 times in the transcript of the December 14 presser. The word “restrictive” appeared 15 times. For example, Powell responded as follows to Liesman:
“[I]t is important that overall financial conditions continue to reflect the policy restraint that we’re putting in place to bring inflation down to 2%. We think that financial conditions have tightened significantly in the past year. But our policy actions work through financial conditions. And those, in turn, affect economic activity, the labor market, and inflation. So what we control is our policy moves in the communications that we make. Financial conditions both anticipate, and react to, our actions. I would add that our focus is not on short-term moves, but on persistent moves. And many, many things, of course, move financial conditions over time. I would say it’s our judgment today that we’re not at a sufficiently restrictive policy stance yet, which is why we say that we would expect that ongoing hikes would be appropriate.”
(2) Greenspan’s conundrum. We are getting a sense of Yogi Berra’s “It’s like déjà vu all over again.” The federal funds rate was increased by 25bps to 1.25% at the June 29–30, 2004 meeting of the FOMC. That was followed by increases of 25 bps at every one of the next 16 meetings, putting the rate at 5.25% after the June 29, 2006 meeting. It remained at that level through August 2007 (Fig. 2). Then-Fed Chair Alan Greenspan explained that the “measured pace” of tightening was necessary to sustain the recovery and avert deflation.
In the bond market, the 10-year US Treasury bond yield fluctuated around 4.50% from 2001 to 2007. That was a big surprise given that short-term rates were almost certainly going to go up at every FOMC meeting, albeit at an incremental pace, once the Fed commenced its measured rate hikes. Mortgage rates, which tend to move with the 10-year US Treasury yield, also diverged from the steady upward march of the federal funds rate.
That phenomenon in the bond market became known as “Greenspan’s conundrum.” In his February 16, 2005 semiannual testimony to Congress on monetary policy, the Fed chair said globalization might be expanding productive capacity around the world and moderating inflation. It might also be increasing the size of the global savings pool. He concluded:
“But none of this is new and hence it is difficult to attribute the long-term interest rate declines of the last nine months to glacially increasing globalization. For the moment, the broadly unanticipated behavior of world bond markets remains a conundrum. Bond price movements may be a short-term aberration, but it will be some time before we are able to better judge the forces underlying recent experience.”
Following the Great Financial Crisis, in his 2010 testimony before the Financial Crisis Inquiry Commission, Greenspan blamed the calamity on a global savings glut, which also explained his conundrum. The crisis wasn’t the Fed’s fault since the Fed had been raising the federal funds rate before the crisis. He blamed foreign investors for piling into the US bond market, especially mortgage-backed securities, which provided the credit that fueled the housing bubble notwithstanding the Fed’s efforts to tighten monetary policy.
(3) Powell’s conundrum. Powell seems to be facing a very similar conundrum. Foreign investors have been piling into the US bond markets. US Treasury data show that US private net capital inflows totaled a record $1.7 trillion over the 12 months through October 2022 (Fig. 3). Private net foreign purchases of US Treasury, agency, and corporate bonds soared to a record $1.2 trillion over this period, led by $1.0 trillion in purchases of US Treasury notes and bonds (Fig. 4 and Fig. 5).
The only problem with this narrative is that bond yields soared even as foreigners snapped up US bonds at a record pace over the 12 months through October. This confirms our view that the balance of supply and demand matters less in determining bond yields than do expectations for Fed policy and how it is likely to impact the economy and inflation.
(4) They just won’t listen. Fed officials are frustrated because the bond market isn’t listening to them. Perhaps they should be listening to the bond market? The adage “Don’t Fight the Fed!” certainly was sensible last year. Perhaps this is the year we also should be listening to the bond market.
The 2-year Treasury note yield is a very good leading indicator of the federal funds rate (Fig. 6). The former tends to lead the latter by a few weeks on the way up and on the way down. The yield tends to peak at about the same time as the federal funds rate.
This time, the Fed seems to be committed to raising the federal funds rate by at least another 75bps to 5.25% during the first half of the year. Yet the 2-year yield peaked at 4.72% last November 7 and was down to 4.20% yesterday (Fig. 7). That’s despite the barrage of warnings from Fed officials that they will continue to hike the federal funds rate and keep it in restrictive territory at least through the end of this year.
Bond investors also haven’t responded as expected to the Fed’s recent warnings. The 10-year Treasury bond yield peaked at 4.25% on October 24, 2022 and was down to 3.52% yesterday.
(5) Listen to the yield curve. The yield-curve spread between the 10-year and 2-year Treasuries inverted during the July 8 week last year (Fig. 8). It was -68bps yesterday. In the past, the yield curve inverted at the tail end of monetary tightening cycles, signaling that fixed-income investors believed that any further tightening would trigger a financial crisis that would turn into an economy-wide credit crunch and a recession, which would bring inflation down (Fig. 9 and Fig. 10).
This time might be different. The chain of events might not lead to a financial crisis, in turn leading to a credit crunch, a recession, and lower inflation. Instead, the 2-year and 10-year yields and their yield spread may be signaling that inflation peaked last summer and will continue to moderate this year. If inflation does moderate relatively quickly, the terminal federal funds rate may not be any higher than 5.25%. In this scenario, the credit system and the economy should remain surprisingly resilient despite the Fed’s tightening, in our opinion.
Powell’s conundrum can be resolved by following the lead of the yield curve. In our 2019 study The Yield Curve: What Is It Really Predicting?, Melissa Tagg and I concluded that inverted yield curves predict that additional monetary policy tightening would cause a financial crisis leading to a credit crunch and a recession. We are now updating our conclusion to include the possibility that the current inverted yield curve might simply be anticipating lower inflation, which would cause the Fed to stop raising interest rates sooner rather than later.
In our study, we suggested that the Fed should tighten monetary policy when the yield curve is widening. It should pause tightening when the yield curve flattens, and easing might be in order when the yield curve inverts.
Good Start
January 09 (Monday)
Check out the accompanying pdf and chart collection.
Executive Summary: We still see greater odds that the economy will glide to a soft landing (60%) than plummet to a hard one (40%), which nearly everyone else expects. What might a soft landing look like? The happiest—and most contrary—of scenarios would be a return of the “Old Normal,” which actually wouldn’t entail a landing at all: real GDP growth of at least 2.0%, moderating inflation, and not much more monetary tightening. … We expect this week’s market-moving news to be mostly reassuring, with a subdued CPI release and earnings reports that don’t disappoint. … Recent news has cut both ways—a concerning NM-PMI but auspicious capital-spending signs. ... Movie review: “Tár” (+).
YRI Monday Webcast. Join Dr. Ed’s live Q&A webinar on Mondays at 11 a.m. EST. You will receive an email with the link to it one hour before showtime. Replays of the Monday webcasts are available here.
Strategy I: Contrary Scenario. The consensus scenario among economists seems to be that the US economy is heading into a recession this year. The consensus scenario among investment strategists seems to be that stock prices will fall during the first half of this year, possibly to a new bear-market low by mid-year, setting the stage for a strong bull-market rally during the second half of this year. But the stock market won’t be up much, if at all, for the year as a whole. Those are plausible scenarios, which is why they are the consensus.
Among the most contrary scenarios is that the economy won’t experience either a hard landing or a soft landing. Instead, it might follow the Old Normal business-cycle script, which was interrupted by the New Normal one from the Great Financial Crisis through the Great Virus Crisis from 2008 through 2021. During the New Normal period, central bankers feared deflation and struggled to achieve their 2% inflation targets. As a result, they implemented ultra-easy monetary policies, which set the stage for the surprising surge in inflation during 2022.
Consider the following overview of what a return of the Old Normal would look like:
(1) There will be no landing for the economy this year. Instead, real GDP will grow by 2.0% or more. Inflation will moderate without a recession down to 3%-4% based on the PCED measure of consumer prices. By the end of this year, it will be closer to the bottom end of this range.
(2) In this scenario, the terminal rate for the federal funds rate might be only 75bps higher than the rate is now, i.e., 5.25% before mid-year. Instead of then falling, it might remain there through year-end. Yet the economy will remain resilient and continue to grow. The 10-year government bond yield will remain range bound around 3.50% plus or minus 50bps. The S&P 500 will move higher during the first half of the year, rising to 4500 and then stall there until a year-end rally drives it up to a new record high of 4800 in anticipation of higher earnings in 2024.
(3) Europe won’t fall into a recession this year after all. The region has managed to find alternative sources of energy to replace Russian imports of natural gas and crude oil. As an added bonus, the winter weather in Europe has been remarkably mild so far. China’s economy may continue to weaken because of the rapidly spreading Covid pandemic. But this wave should crest by mid-year thanks to herd immunity. The global economy should be in better shape by the second half of the year and in 2024. That would boost commodity prices, after they continue to weaken during the first half of this year.
Almost no one is giving this happy scenario any credence. Last October, the IMF cut its forecast for global growth next year to 2.7%, from the 2.9% projected in July and 3.8% in January, adding that it sees a 25% probability that growth will slow to less than 2%. The US economy was projected to grow only 1.0% in 2023, down from 1.6% in 2022. (See the IMF’s World Economic Outlook, October 2022.)
We are still assigning a subjective probability of 60% to a soft landing and 40% to a hard landing. What about the no-landing Old Normal scenario? It falls under the soft-landing umbrella; we consider it to be the happiest of the soft-landing outcomes.
Strategy II: Another Earnings Season & Another CPI. Of course, in our business, we update our views on a day-by-day basis depending on the news flow and market reaction. Last week was the first week of the new year, and it started out with data that on balance support the soft-landing scenario. We refer to Friday’s employment and purchasing managers reports, which caused the S&P 500 to jump 2.3% that day and 1.4% for the week (Fig. 1). The index rebounded back to its 50-day moving average. It was 1.9% below its 200-day moving average, which was 3972 on Friday (Fig. 2).
We still have 51 weeks before the end of 2023, and lots can happen. Here is what’s coming up this week:
(1) Earnings season. This week starts the Q4 earnings reporting season. During the final week of last year, industry analysts were estimating that S&P 500/400/600 operating earnings per share fell 0.1%, 1.5%, and 10.7% on a y/y basis for the quarter (Fig. 3). The major money center banks report at the start of earnings seasons. Loans and leases on the books of all commercial banks rose to a record $12.0 trillion, up 11.3% y/y through the end of last year (Fig. 4). Their allowance for loan losses rose by only $2.6 billion last year to $169.1 billion at the end of 2022 (Fig. 5). The banks’ results are likely to be in line with expectations.
Here are the latest proforma y/y earnings growth rate estimates of industry analysts for the 11 sectors of the S&P 500 during the week of January 5: S&P 500 (-2.2), Communication Services (-21.4), Consumer Discretionary (-15.1), Consumer Staples (-2.7), Energy (64.7), Financials (-8.7), Health Care (-6.4), Industrials (42.7), Information Technology (-8.7), Materials (-22.4), Real Estate (6.9), and Utilities (3.4).
In our analytical framework, the fourth quarter of each year itself is totally irrelevant to the stock market’s outlook unless it significantly changes consensus expectations for the four quarters of the new year. That’s because we focus on 12-month forward earnings. Since the start of the Q4 earnings season is at the beginning of the new year, it no longer gets any weight in the calculation of forward earnings, which is the time-weighted average of analysts’ earnings expectations for the current year and the coming year. As such, forward earnings is the best approximation of the earnings that investors, always forward looking, are basing decisions upon.
The Q3-2022 earnings season during October of last year certainly had a significant negative impact on the earnings estimates for Q4-2022 and each of the four quarters of 2023 (Fig. 6). We doubt that the Q4 earnings results will be worse than currently expected since industry analysts generally tend to be too pessimistic just before the results are released.
However, the forward guidance provided during management conference calls could cause the analysts to lower their estimates for Q2-Q4 of this year if the conference calls reinforce widespread concerns about a recession this year. On the other hand, analysts are likely to remain optimistic about 2024, which will get more weight in calculating forward earnings as the current year proceeds.
Joe and I have been informed by a few of our accounts that we are just about the only strategists expecting earnings to be up this year for the S&P 500. That must be because we are among the few who don’t expect a recession this year. We are currently expecting S&P 500 operating earnings to be $225 per share this year, up 4.7% from $215 last year. For 2024, we are projecting $250, up 11.1% from 2023 (Fig. 7). As of the last week of December, industry analysts were at $220 for last year, $229 for this year, and $253 for next year.
(2) December’s CPI. The start of the earnings season next week may not be as important as December’s CPI report, which will be released on Thursday. A few recent indicators—detailed below—suggest that the result could be a relatively small increase or decrease, which could give another lift to both stock and bond prices.
The national gasoline pump price fell 13.7% to $3.28 per gallon over the four weeks through the January 2 week from $3.80 during the last four weeks of November (Fig. 8). The nearby price of natural gas has plunged from a 2022 peak of $9.68 mmbtu on August 22 to $3.71 mmbtu on January 6 (Fig. 9). By the way, the price of natural gas also plunged in Europe during the second half of last year (Fig. 10).
The Manheim Index for the wholesale price of used cars fell 14.2% y/y during December, the lowest on record (Fig. 11).
Both the Zillow and ApartmentList inflation rates of new rental leases continued to fall through November, suggesting that the peak in CPI rent inflation is nearing (Fig. 12).
The M-PMI’s prices-paid index, which has been under 50.0 for the past three months, leads the CPI goods inflation rate by about three months (Fig. 13). The NM-PMI prices-paid index leads the CPI services inflation rate by about 12 months and suggests that the latter should peak during H1-2023 (Fig. 14).
US Labor Market: Some Moderation. December’s private payroll employment gain of 220,000, reported on Friday by the Bureau of Labor Statistics (BLS), was stronger than expected, just about matching the month’s increase of 235,000 in private payrolls reported by ADP the day before, when stock prices dropped on the news. They rose on Friday partly because there were more signs of moderation in the labor market. Consider the following:
(1) Workweek and wages. Average weekly hours worked fell 0.3% m/m in December, more than offsetting the 0.2% increase in payrolls (Fig. 15). This series actually peaked during January 2021 at 35.0 hours and is now down 2.0% since then, suggesting that new hiring since then has reduced the long hours of employees who were able to work during the pandemic.
Furthermore, in December, wage inflation, as measured by average hourly earnings (AHE) for all workers, eased to 0.3% m/m, resulting in a y/y increase of 4.6%, down from last year’s peak of 5.6% during March (Fig. 16). November’s AHE gain was revised down from 0.6% to 0.4%.
(2) Earned Income Proxy. Our Earned Income Proxy for wages and salaries in the private sector rose just 0.2% m/m during December, reflecting the drop in the average workweek and the slower pace of wage gains (Fig. 17). Nevertheless, after stagnating for the past couple of years, AHE divided by the PCED has been moving higher since June through November (Fig. 18). We are expecting that wages will rise faster than prices this year, boosting the purchasing power of consumers.
(3) Production. The index of aggregate weekly hours in manufacturing fell 0.1% m/m during December, following November’s 0.2% decline. This series is highly correlated with manufacturing production, suggesting that November’s small decline was followed by another small decline during December (Fig. 19).
US Economy I: Purchasing Managers Seeing Hard Landing? What about the NM-PMI’s drop below 50.0, to 49.6, during December (Fig. 20)? In a soft landing, strength in the services sector of the economy should be offsetting the weakness in the goods sector. Keep in mind that the NM-PMI includes the construction industry, which has been very weak. Nevertheless, the drop in the NM-PMI’s new orders index to 45.2 is worrisome.
US Economy II: Capital Spending’s Upside Surprise. Back to this past week’s good news: Tuesday’s construction expenditures report for November remained stalled near its recent record high (Fig. 21). The weakness in single-family private residential construction spending has been partly offset by strength in the multi-family sector (Fig. 22).
Private nonresidential construction spending rose to a new record high during November (Fig. 23). Leading the way higher last year was spending on commercial, health care, manufacturing, and transportation projects (Fig. 24). All this augurs well for capital spending on nonresidential structures in the GDP accounts.
Movie. “Tár” (+) (link) is a biopic about a famous but fictional orchestra conductor played by Cate Blanchett. She is at the top of her career and about to record an album with the Berlin Philharmonic. However, her life quickly spins out of control as her current and past misdeeds are revealed. Blanchett’s performance is Oscar-worthy. The movie is a bit long, but the insights into Western classic music are interesting.
China, Staples & Drones
January 05 (Thursday)
Check out the accompanying pdf and chart collection.
Executive Summary: Covid is ravaging China after the government suddenly abandoned its zero-Covid policy, leaving an under-exposed and under-vaccinated population vulnerable. Jackie reports on the tragic fallout. … The S&P 500 Consumer Staples sector was a top-performer last year, as investors viewed it as a relative safe haven. That might not remain the case given Consumer Staples’ current valuation; its forward P/E actually rose over the past two years. … And: Our Disruptive Technologies focus this week is on the drones that are starting to dot the sky and how they’ll be reshaping retailing, shipping, and war.
China: Looking Beyond Covid. When Covid hit US shores in 2020, experts extolled the importance of flattening the curve. It was important to reduce the rate of Covid infections so that everyone in the country didn’t get sick at the same time and overwhelm hospitals. Fortunately, the curve did flatten in the US; but if you’ve ever wondered what would have happened had cases been allowed to spike, look no further than China.
The Chinese government lifted its zero-Covid policy last month, and the virus is spreading like wildfire through cities. Hospitals and morgues are overwhelmed, according to press reports. The official numbers of Covid cases and deaths are so low that they’re widely discredited, most recently by the World Health Organization. Covid cases are expected to surge in the countryside later this month as city dwellers visit relatives in the country to celebrate the Lunar New Year for the first time in three years. It’s a good bet that rural hospitals will be overwhelmed shortly thereafter.
The Chinese leadership clearly needed to do something different, as its zero-Covid policies were hurting the economy and fueling protests. China’s official manufacturing purchasing managers index (PMI) for December fell to 47.0, and the nonmanufacturing PMI tumbled to 41.6 (Fig. 1). Every element of the manufacturing PMI was below 50: new orders (43.9), employment (44.8), and output (44.6) (Fig. 2).
Despite surging Covid cases and dour PMIs, China’s stock market is rallying. It rose 2.2% Tuesday, and it has jumped 37.3% since bottoming on October 31, 2022 (Fig. 3). For the first time in over a year, optimism about China and its economic recovery may be justified. The unorganized lifting of zero-Covid policies certainly will cause avoidable deaths. But six months from now, the country may find it has learned to live with the disease just as the rest of the world has. In addition, its central bank has opened the spigots and is providing financial support to the country’s real estate developers.
Let’s take a look at some of the anecdotes being carried in the press about the country’s Covid struggles:
(1) Covid peak in cities? The surge of Covid cases in many cities may mean that the number of cases has peaked as the citizenry has achieved herd immunity. About 70% of Shanghai’s 25 million citizens may already have been infected with Covid-19, estimated one a hospital executive quoted in a January 3 South China Morning Post (SCMP) article. One study suggests that the number of Covid cases already has peaked in China’s major cities and will surge in rural areas in mid-to-late January, a January 3 CNN article reported.
Almost all the employees at Shenzhen Jiaoyang Industrial, a toymaker in Shenzhen, were sickened with Covid at the same time in early December. The virus also struck Foxconn Technology Group, Apple’s iPhone contract manufacturer, in December. But iPhone production at the plant has been ramped up and is beginning to catch up to demand, a January 1 WSJ article reported. Some plants that are still reporting new cases of Covid among employees nonetheless are allowing employees to leave early for the Lunar New Year, which begins on January 21.
(2) Health system overwhelmed. With the official number of Covid cases and deaths vastly underreported, articles about overflowing emergency rooms and backed-up crematoriums better depict the unnecessary suffering caused by inadequate vaccination of the population and lack of planning before lifting zero-Covid policies. The number of patients in the emergency unit of Shanghai’s Ruijun Hospital has doubled to 1,600 people per day, with 80% of patients sick with Covid-related illnesses, said the hospital representative in the SCMP article; treatment is being carried out in a “smooth, safe, and orderly manner,” he said. But another, far less reassuring story is told by video and reporting describing patients waiting for hours outside of hospitals until space becomes available in emergency rooms.
Funeral homes are overwhelmed as well. Though she did not die from Covid, an elderly lady’s corpse decomposed in a family’s Shanghai house for five days before a hearse arrived, a January 3 Bloomberg article reported. The crematorium said it had received more than 500 corpses on that day, five times more than it typically handles. Furnaces at funeral homes are operating night and day, with the wait to have a relative cremated extending into mid-January.
“A whole gray economy has emerged to cater to those who are desperate to bury their loved ones. Everything is an opportunity for profit: scalpers hawk queue numbers to skip lines for cremation, rent out hearses and offer all-in-one packages at exorbitant rates. Some trumpet their connections to workers at various crematories and hospitals,” the Bloomberg article reported.
(3) The elderly problem. It’s well known that the elderly—particularly those with other underlying health conditions—are more likely to die from Covid than younger people. Yet in China as of December 14, only 42.4% of those aged 80 and over have had three courses of Covid vaccine.
Some elderly worry that the shots will exacerbate underlying medical conditions, and others have gotten mixed messages from doctors about whether to get the vaccine. But given that China demands conformity to the government’s agenda—even tracking protesters’ locations by their cell phones—why didn’t the government insist or even mandate that the elderly population receive Covid vaccines? Might the lapse have been intentional? A very dark thought to start off a new year.
Consumer Staples: Defensive No Longer? One of last year’s best performing sectors in the S&P 500 was Consumer Staples. Its slow but steady earnings made the sector a winner compared to other sectors that suffered sharp declines in their earnings and/or forward P/Es. But after a year of outperformance, the Consumer Staples sector has among the highest forward P/Es in the S&P 500 and among the slowest earnings growth forecast for 2023.
Let’s take a look at how the stats stack up as 2023 begins:
(1) A banner 2022. A stock price index’s full-year decline of 3.2% isn’t often something to crow about; but the S&P 500 Consumer Staples sector’s drop of just 3.2% over the course of 2022 was a winning hand among the S&P 500’s 11 sectors: Energy (59.0%), Utilities, (-1.4), Consumer Staples (-3.2), Health Care (-3.6), Industrials (-7.1), Financials (-12.4), Materials (-14.1), S&P 500 (-19.4), Real Estate (-28.4), Information Technology (-28.9), Consumer Discretionary (-37.6), and Communication Services (-40.4) (Fig. 4).
Industries within the S&P 500 Consumer Staples sector had a wide range of price performances last year. Even during uncertain times, consumers will find the funds to buy food and maybe toss back a beer. Drug retailers faced tough comparisons to 2021, when consumers were visiting stores for their Covid vaccines and picked up some tissues or a pack of gum on the way out. The Personal Products industry has only one stock, Estee Lauder, which had a tough 2022 because of its exposure to China.
Here are 2022 returns for some of the industries in the Consumer Staples sector: Brewers (11.2%), Soft Drinks (5.2), Tobacco (2.8), Consumer Staples (-3.2), Household Products (-8.3), Hypermarkets & Super Centers (-11.7), Drug Retail (-28.4), and Personal Products (-33.0) (Fig. 5).
(2) Very slow, but positive earnings. Analysts collectively are forecasting earnings growth of 3.2% for the S&P 500 Consumer Staples sector in 2023, only a touch slower than the 3.9% earnings growth forecast for it in 2022 (Fig. 6). The sector’s projected earnings growth for this year matches that of the S&P 500, 3.4%.
Here are analysts’ consensus earnings growth estimates for the S&P 500 and its 11 sectors for 2023 and 2022: Consumer Discretionary (29.9%, -2.6%), Industrials (14.7, 30.8), Financials (12.7, -14.4), Utilities (7.3, 2.6), Communications Services (6.3, -16.7), S&P 500 (3.2, 7.7), Consumer Staples (3.2, 3.9), Information Technology (0.3, 9.0), Health Care (-3.3, 4.6), Materials (-11.4, 8.4), Energy (-13.2, 155.9), and Real Estate (-13.6, 2.5) (Table 1).
(3) Slow growth, high P/E. Investors were willing to pay up last year for the safety found in the S&P 500 Consumer Stapes sector. The sector served as a haven from falling stock prices in the broader market and earnings disappointments. This year may prove different. The forward earnings multiples of many of the S&P 500 sectors have come down sharply over the past two years, while the Consumer Staples sector’s forward P/E actually is up slightly.
Here's the rundown of the S&P 500 sectors’ current forward P/Es ranked by how much they’ve changed over the past two years: Health Care (17.2, 6.1%), Utilities (18.9, 1.8), Consumer Staples (20.9, 0.2), Financials (12.1, -17.3), Industrials (18.0, -24.8), Materials (15.7, -25.0), S&P 500 (16.7, -26.4), Information Technology (19.6, -28.6), Real Estate (33.9, -37.4), Communication Services (13.8, -40.6), Consumer Discretionary (20.6, -43.3), and Energy (9.5, -68.9) (Table 2).
Disruptive Technologies: Drones Take Flight. Walmart and Amazon seem to be inching forward with the use of drones to make fast deliveries. Unfortunately, drones are also being used in the Ukraine war to identify and kill the enemy and to destroy infrastructure more easily. Welcome to the double-edged sword of new technology. Here’s a look at some of the recent drone-related news:
(1) Old retailer, new tech. Walmart is expanding the drone delivery service it started in 2021 in Arkansas to Arizona, Florida, Virginia, Texas, and Utah. The retailer’s goal was to have 34 participating stores in 23 cities by the end of last year. It aims to deliver more than one million packages by drone each year.
In Texas, drone delivery is available to customers living within 11 miles of certain Dallas-area stores. Drones can deliver items weighing up to 10 pounds in as little as 30 minutes for a $3.99 fee, a December 15 Supermarket News article reported. There are no minimum orders, and items as delicate as eggs can be flown. A flight engineer manages the drone and uses a cable to lower a package from the drone to the best spot near the customer’s home. Walmart has partnered with DroneUp.
(2) Internet companies play catchup. Drone delivery services being developed by Amazon and Alphabet units are taking off a bit more slowly. Amazon Prime Air began operations late last year in two locations outside of Sacramento, California and Austin, Texas. The Internet retailer’s drones boast a “sense-and-avoid” system that allows the drones to operate out of the sight of humans and reliably avoid other aircraft, people, and obstacles, a December 30 The Street article reported. But the article also noted that at least eight of Amazon’s drones crashed over the past year, with one sparking a 20-acre brush fire in Oregon. Amazon, which is using MK27-2 drones, aims to make deliveries in less than an hour.
Alphabet owns Google and Wing, a drone delivery service that makes deliveries for a Walgreens and The Star, a small retailer, both in suburban Texas near Dallas. A Wing drone can carry up to three pounds and has a three-foot wingspan. The delivery company also has operations in Australia and Finland.
(3) Fighting drones. We’re getting a look at the evolution of modern warfare in Ukraine, where drones are playing a large role. Russia has been using Iranian-manufactured drones since this fall, Ukraine officials say, despite denials from Iranian officials. Russia reportedly uses Iran’s Shahed-136 drones, which are equipped with a warhead on its nose and are hard to detect by radar because they have an 8.2-foot wingspan, a January 3 BBC article explained.
With a range of 1,550 miles, the drone can fly at 115 miles per hour and has been used to hit both military and civilian targets in Ukraine, including electric power stations. The Ukrainian forces defend themselves by using machine guns, portable anti-air missiles, and electronic jamming devices. Ukrainian forces have become skilled at shooting down Russia’s drones, but the defensive missiles they use can cost $140,000-$500,000, while a drone may cost only $20,000, a January 3 NYT article pointed out. As a result, drones may give Russia a long-run advantage. But drones have helped boost the impact of the much smaller Ukrainian military too.
The US is supplying the Ukraine with Switchblade kamikaze drones, but it’s unknown whether they’ve been used. It’s believed that the Ukrainian military used some type of drone to attack a Russian military base in western Crimea, an airbase near Sevastopol, ships in the Sevastopol harbor, and airbases hundreds of miles inside Russian territory.
Ukrainian forces have used the Turkish-made Bayraktar TB2, which is the size of a small plane and carries cameras and laser-guided bombs, the BBC article reported. Used to sink the Russian warship in the Black Sea last April, the drone can fly for 186 miles and has a speed of 140 miles per hour. Drones are being used by both armies to identify enemy targets and guide missiles toward them, eliminating the need to send out a special forces unit of humans.
We may just be starting to see how drones will change the way wars are fought.
All About Central Banks
January 04 (Wednesday)
Check out the accompanying pdf and chart collection.
Executive Summary: Bears warning that the worst is yet to come for financial assets and the economy emphasize the effects on asset prices of central banks’ recent tightening policy moves, in the US and around the world. Yes, the unconventionally easy monetary policy that greased financial markets for more than a decade is over, but quite a bit of the tightening that has replaced it has been discounted by financial markets already. Moreover, most asset bubbles have burst already without much collateral damage. And the US markets continue to benefit from record foreign capital inflows. … Also: Melissa recaps recent monetary policy developments in Europe, Japan, and China.
YRI Weekly Webcast. A replay of Dr. Ed’s webinar broadcast yesterday is available here.
Central Banks I: Bursting the Bubbles. Since 2021, pessimistic prognosticators have been predicting that the “bubble in everything” would burst. They’ve been mostly right, though they’ve been much too pessimistic about the implications for the financial system and the economy, so far. Then again, many of them aren’t convinced that the worst is over for financial assets and for the economy.
According to the bearish narrative, the bull market from 2009 through 2021 was primarily attributable to the ultra-easy monetary policies of the Fed and the other major central banks. These policies were largely justified by the deflationary forces unleashed by the Great Financial Crisis. The result was that all the major central banks undershot their 2.0% inflation targets. That was their excuse for implementing so-called unconventional monetary policies including zero-interest-rate policies (ZIRP), negative-interest-rate policies (NIRP), yield-curve-control policies (YCC), and quantitative easing (QE).
These unconventional policies had begun to seem like the “new normal” when suddenly, over the past year, inflation soared around the world. Now all the major central banks are scrambling to subdue inflation rates well exceeding their 2.0% targets by tightening their monetary policies.
In the US, the bullish case looking forward is that “this too shall pass” and indeed is passing. In other words, most if not all the bubbles have burst already, without much collateral damage. The FOMC will probably raise the federal funds rate by 25bps at each of its next three meetings to 5.00%-5.25% and then pause. Monetary policy will have turned restrictive enough to moderate inflation without causing a recession. So corporate earnings are more likely to move sideways than take a dive. The same goes for stock valuation multiples.
Moreover, US financial markets continue to benefit from “TINAC,” i.e., the very sound investment rationale that “there is no alternative country” to serve as a safe haven for global investors during these challenging times around the world. Indeed, investment funds have been flooding into the US: Although the dollar index (DXY) peaked at 114.10 on September 27 last year, falling to 103.52 by year-end, US Treasury data show that US private net capital inflows totaled a record $1.7 trillion over the 12 months through October 2022 (Fig. 1). Private net foreign purchases of US Treasury, agency, and corporate bonds soared to a record $1.2 trillion over this period, led by $1.0 trillion purchases of US Treasury notes and bonds (Fig. 2).
Central Banks II: The Bears’ Favorite Chart. One of the bears’ favorite charts shows the relationship between the S&P 500 and the size of the Fed’s balance sheet. The former rose 609% from March 9, 2009 through January 3, 2022 (Fig. 3).
Over this same period, the Fed’s assets rose 1,005% from $760 billion in March 2009 to $8.4 trillion in January 2022. That was all wildly bullish for stocks and bonds.
On January 5, 2022, the Fed released the minutes of its December 14-15, 2021 FOMC meeting. It included a long section titled “Discussion of Policy Normalization Considerations.” It signaled that the Fed soon would respond to rising inflation by reducing the size of its balance sheet.
The Fed’s quantitative tightening (QT) program began in June of last year and started accelerating in September. At the current runoff pace of $95 billion per month, the Fed’s asset holdings would drop by $2.8 trillion from a record high of $8.5 trillion during May 2022 to $5.7 trillion by the end of 2024.
The bears reckon that QT of this magnitude will continue to send stock prices lower. They might be right. But keep in mind that the forward P/E of the S&P 500 has already dropped from 21.5 on January 3 of 2022 to 16.7 at the end of the year (Fig. 4). So the market already has discounted quite a bit of the Fed’s pivot from accommodative to restrictive monetary policy.
The S&P 500 is also highly correlated with the sum of the assets of the Fed, the European Central Bank (ECB), and the Bank of Japan (BOJ) (Fig. 5). This series rose from about $3.3 trillion during mid-2008 to a record high of $25.1 trillion during February 2022 and was down 12% to $22.1 trillion in November of last year. The problem with this series is that it is in dollars, which exaggerates the decline of the assets held by the ECB in euros and BOJ in yen. Nevertheless, we acknowledge that the two series have been and remain highly correlated.
Central Banks III: ECB Scrambling. The Eurozone’s headline CPI inflation rate soared to a record 10.6% y/y in October, with the core rate at a record 5.0%. The former fell slightly to 10.1% in November, while the latter remained at 5.0% (Fig. 6).
The ECB responded by raising interest rates on December 15 for the fourth consecutive time, ECB President Christine Lagarde clearly telegraphed that the tightening wasn’t over. We have “more ground to cover,” she said, adding: “The ECB is not pivoting.” She noted that at least two more 50bps rate increases could be expected in February and March. In its latest move, the ECB increased its deposit rate to 2.0% from 1.5%. The rate had been at -0.50% during the first half of 2022 (Fig. 7).
The ECB also announced plans to decrease its over €8 trillion lending and bond portfolio and recently has begun doing so. But not all the European central bankers agree on what should happen next. And Lagarde has a history of changing her mind.
Here’s more:
(1) Risk of overtightening. Other ECB board members don’t appear to be on board with raising rates as aggressively as Lagarde implied, as we observed in our November 15 Morning Briefing. For example, ECB board member Fabio Panetta had said in November that monetary policy should not “ignore the risks of overtightening.”
(2) Bad forecasts. Vítor Constâncio, former ECB vice-president, wrote on Twitter that the ECB’s December move indicated “an excessively hawkish policy that will aggravate the coming recession unnecessarily.” Constâncio explained that Lagarde’s statements were “grounded on controversial inflation forecasts.” The ECB has different procedures to calculate the forecasts in June and December, he said. In these months, the forecasts are coordinated by the national central banks, “whereas in the other quarters ECB staff does it.”
In turn, the national bank forecasts resulted in the following rather large increases: to 8.4% (from 8.1%) for 2022, 6.3% (from 5.5%) for 2023, and 3.4% (from 2.4%) for 2024. Rates closer to 2.0% are not expected until 2025. It’s hard to believe the inflation forecasts, however, when recently the bank issued a mea culpa for its poor job in creating them, observed the April 28 Financial Times. Then again, the ECB’s forecasts may be no worse than those that the other global central banks put out.
(3) Quantitative tightening. The ECB has started its QT program to reduce the size of its balance sheet. At December’s end, the ECB posted its update for the total assets on its balance sheet, which plunged by €492 billion from the week before to €7.98 trillion, led by a big drop in its Targeted Longer-Term Refinancing Operations programs (TLTRO) (Fig. 8). That was the lowest since July 2021 and €850 billion below the June peak.
During the October meeting, the ECB announced that it would make the terms less favorable on pandemic-related TLTRO loans and allow for voluntary early repayment of them. At its December 2022 meeting, the ECB announced that it would reduce its bond holdings beginning in March 2023 at a rate of €15 billion a month.
We also are watching for the ECB’s potential use of its untested “Transmission Protection Instrument” (TPI), an important backstop. Officials are acutely aware that its aggressive tightening is at the risk of disorderly market adjustments, as outlined the ECB’s November 2022 Financial Stability Report. After longer-term government bond yields went haywire for debt-ridden Eurozone regions in response to the initial steps of the ECB’s tightening phase, the bank announced in July 2022 that it could give special treatment (i.e., via increased targeted liquidity with the purchase of specified bonds) to qualifying areas if necessary. Use of the TPI could indicate that the ECB could tip into a pivot.
(4) Whatever-it-takes. Notably, Lagarde is no stranger to pivots. She once disavowed the “whatever-it-takes” mantle associated with her predecessor Mario Draghi, who delivered on his pledge to “do whatever it takes” to defend the euro following the previous crisis—saying she’s not “whatever-it-takes number two.” Yet on March 18, 2020, she pivoted to an all-in stance on ECB’s Pandemic Emergency Purchase Program, essentially saying the ECB would do what it takes to end the pandemic.
We don’t know how long Lagarde will remain a vigilant hawk this time. But if the ECB’s aggressive interest-rate hiking and QT tips the Eurozone into a recession, it might not be for long.
Central Banks IV: BOJ’s Mixed Message. Rising inflation in Japan has increased the odds that the BOJ soon could let go of its long held accommodative monetary policy stance. That includes negative short-term interest rates and its Yield Curve Control (YCC) policy (introduced in 2016) to hold 10-year Japanese Government Bond yields (JGB) near 0.0% with its bond purchases.
For now, the bank’s Governor Haruhiko Kuroda has said that it is “too early to consider reviewing or exiting” current policies, mainly because demand-driven inflation remains lacking, according to the bank. The bank has maintained in its policy statement that it will “not hesitate to take additional easing measures, if necessary.” But Kuroda won’t be heading the BOJ for much longer.
Here’s more:
(1) Inflation soaring for headline & core. Japan’s inflation jumped to record-high rates of 3.9% for the headline and 3.7% for the core (excluding food) during November, showing that it’s not just energy and food prices driving inflation higher (Fig. 9). Both the headline and core rates had fallen well below the BOJ’s 2.0% inflation target up until April 2022. Nikkei reported on December 31 that, according to sources, the BOJ is considering raising its inflation forecasts in January to show price growth close to its 2% target in fiscal 2024, a move that could provide grounds for a pivot away from ultra-loose monetary policy.
(2) Yields rising as caps raised. Last week, on December 20, the bank raised its YCC cap to 0.5%, saying that it was not a mark of a policy shift but a move to ensure the functioning of the bond markets. Consensus thinking was that the bank would stand pat on policy until this year, so the move surprised markets. In addition, the bank’s statement said it would increase its monthly bond purchases to $67 billion from about $55 billion. But its near-zero short-term interest rates were kept unchanged. Total assets on the BOJ’s balance sheet have declined from a peak of ¥742.3 trillion during the June 17 week to a recent low of ¥684.9 trillion during the final week of September; but they subsequently rose slightly to ¥698.2 trillion through the week of December 16 (Fig. 10).
(3) Kuroda exits. Recent monetary policy moves (or non-moves) could be moot given that the bank’s entire monetary policy framework comes up for review when Kuroda’s term expires in April, after two more policy meetings.
Current Deputy Governor Masayoshi Amamiya and former Deputy Governor Hiroshi Nakaso are among the names floated to take Kuroda’s spot, according to the Japan Times. The current deputy presumably would follow along Kuroda’s track. The former deputy has not worked at the BOJ since 2018 and has criticized Japan’s economic policies as too reliant on monetary rather than fiscal approaches.
(4) Weak demand. Some say a fundamental policy shift in Japan is unlikely because household spending and consumer confidence remain weak. Contractual earnings per employee on a real basis have been mostly negative since fall 2021. Also, the BOJ projects that core inflation will decline to 1.6% during 2023 as pricing pressure on oil imports declines (as of October, the latest projections available).
Central Banks V: PBOC Is Easing. Keep injecting money into the financial system, Xi Jinping, China’s President, effectively told the People’s Bank of China (PBOC) late last year. The Politburo, the top decision-making body of the Communist party, has pledged to make monetary policy “targeted and forceful” in 2023. With the leadership push, the central bank is expected to maintain its accommodative monetary in early 2023.
Most of Chinese households’ assets are tied up in real estate, however, limiting the effectiveness of central bank stimulus. Corporate demand for loans has been weak given the wave of insolvencies in China’s property market. Recently, China has relaxed its zero-Covid policies, aiming to revive its economy. However, that’s caused a rampant rise in infections, and residents may opt to remain at safe social distances in any case. So what’s a central bank to do? Consider the following:
(1) Injecting cash. On Friday, December 23, China’s key money rate fell to the lowest level on record after the central bank made its largest weekly cash injection (a net 704 billion yuan, or $100.76 billion) via open-market operations since late October, reported Reuters. China’s required reserve ratios were cut five times over the past two years (Fig. 11).
(2) Disinflation & deflation. Despite all the stimulus, China’s CPI eked out a mere 1.6% y/y rate, and China’s PPI for industrial products fell into deflationary territory at a -1.3% y/y rate during November (Fig. 12). Domestic demand has been weak amid the Covid restrictions, with China’s retail sales falling 5.9% y/y during November.
(3) Ailing property market. Last month, Chinese regulators released a 16-point plan to rescue the struggling property industry, reported the South China Morning Post. New home sales fell 31% y/y in November after declining 23% in October, according to National Bureau of Statistics data. President Xi recently reaffirmed the importance of the property sector as a “pillar” of the Chinese economy.
(4) Contagion spreading. Meanwhile, nearly 37 million people in China may have been infected with Covid-19 on a single day this week, according to estimates from the government’s top health authority, reported Bloomberg on December 23.
Recession in 2023: 60/40 or 40/60?
January 03 (Tuesday)
Check out the accompanying pdf and chart collection.
Executive Summary: With last year thankfully behind us, we take stock of what could go both wrong and right for the economy in 2023. We’re optimistic that 2023 will be better than 2022 for several reasons, but that’s a contrarian viewpoint. We maintain our 60% subjective odds that the economy will achieve a soft landing in 2023 and 40% odds that it will land hard, with a broad-based recession and no bull market resuming for stocks. Much depends on what happens with Fed policy and inflation. ... Dr. Ed reviews “Causeway” (+).
YRI Weekly Webcast. This week, Dr. Ed’s live Q&A webinar will be held on Tuesday at 11 a.m. EST. You will receive an email with the link to the webinar one hour before showtime. Replays of the weekly webcasts are available here.
2022: Annus Horribilis. Good riddance to 2022! For us at Yardeni Research, it was a tough year up to the very end. One of our main database vendors was attacked by ransomware hackers in mid-December. The vendor paid the ransom in bitcoin. The hackers responded with great customer service, providing a chat line to help restore the vendor’s systems. Nevertheless, doing so required a couple of weeks of an all-hands-on-deck, round-the-clock effort. The automatic updating feature of our chart system was down for the last two weeks of 2022 but was functioning again just in time for us to write this first Morning Briefing of the new year.
Two weeks before Thanksgiving, I was hit with Covid for the first time. That’s even though I had the two shots of the Pfizer vaccine and the booster shot. Perhaps they eased my symptoms. In any event, one week later, I tested negative. However, during the first week of December, I was hit by another virus, RSV (a common respiratory virus that usually causes mild, cold-like symptoms). That was followed by a case of pneumonia over the remainder of December. I hope that’s it for a while.
Of course, 2022 was a much worse year for lots of other people around the world. It was certainly an annus horribilis for Ukrainians under attack by Russians. It was a deadly year for Russians who opposed the war with Ukraine started by President Vladimir Putin. Several Russian businessmen, bureaucrats, oligarchs, and journalists died of “Sudden Russian Death Syndrome,” reported the December 29 issue of The Atlantic. Many Russians who had dared to criticize the war fell to their deaths by either jumping or getting pushed out of windows of tall buildings.
Also, women continued to suffer under the misogynistic and stifling totalitarian rule of the Taliban in Afghanistan and the Mullahs in Iran. The authoritarian Chinese Communist Party (CCP), led by President-for-life Xi Jinping, imposed a senseless zero-Covid policy until widespread protests at the harshness of the government’s lockdowns led to the total dismantling of the policy in recent weeks. Now the virus is spreading like wildfire because the population hasn’t been properly vaccinated or allowed to achieve herd immunity. Deaths are soaring, especially among seniors, which may be the CCP’s novel approach to dealing with the burden of a rapidly aging population attributable to the disastrous one-child policy that was imposed by the CCP between 1980 and 2015.
Xi’s regime continues to threaten to invade Taiwan. On December 26, 71 Chinese military aircraft, including fighter jets and drones, entered the island’s air defense identification zone, the largest reported incursion to date. On December 30, a Chinese military jet got so close to an American spy plane that the US pilot had to perform evasive maneuvers to avoid a collision while flying in international airspace over the South China Sea.
Here in the US, crime soared during 2022 in many urban areas because of more lenient bail standards. Illegal immigration also soared last year because the government failed to stop it, resulting in a deluge of people crossing into the US through the southern border. Article IV, Section 4 of the Constitution of the United States reads: “The United States shall guarantee to every State in this Union, a Republican Form of Government, and shall protect each of them against invasion; and on Application of the Legislature, or of the Executive (when the Legislature cannot convene) against domestic violence.”
On December 29, President Joe Biden, while on vacation in St. Croix, signed a $1.7 trillion federal spending bill that avoids a partial government shutdown. It’s unlikely that he or anyone else read the 4,100-page measure in its entirety. However, various summary compilations confirm that it is loaded with pork.
2023: What Could Go Wrong? Of course, investors are also saying “Good riddance to 2022!” But will 2023 be any better? Joe, Debbie, and I think so. But that seems to be a minority view currently.
We continue to assign a 60% subjective probability to a soft-landing scenario and the remaining 40% odds to a hard-landing one. So we acknowledge that a recession is a significant possibility. The consensus view among economists and strategists seems to be the reverse of ours, with 60% odds of a hard landing and 40% of a soft landing. Some of the most vocal of them, along with several prominent business executives and investors, have asserted that a recession is all but inevitable in 2023.
As we often observed last year, if a recession happens, it will be the most widely expected downturn ever. Indeed, there was some chatter during the first half of 2022 that the economy was already in a recession. It’s possible that we might all talk ourselves into a recession.
Let’s review what could go wrong in 2023, before doing the same for what could go right:
(1) Imminent recession. The Index of Leading Economic Indicators (LEI) peaked at a record high during February 2022 (Fig. 1). It is down 4.9% since then through November. Since 1962, the LEI’s peaks accurately predicted the peaks in the Index of Coincident Economic Indicators with an average lead time of 12 months. That suggests that the next recession could start very soon, i.e., in March of this year.
The S&P 500 is one of the 10 components of the LEI. Since 1945, it has peaked on average by five months before the business cycle has peaked (Fig. 2). So a recession is overdue according to the S&P 500. The yield-curve spread between the 10-year US Treasury bond yield and the federal funds rate is also one of the LEI’s components (Fig. 3). It turned negative (i.e., inverted) several months before the previous eight recessions.
As we have previously observed, we prefer the yield-curve spread between the 10-year and 2-year US Treasury notes. It has tended to invert near the tail end of monetary policy tightening cycles (Fig. 4). It has been inverted since July 8. In the past, the yield-curve inversions correctly anticipated financial crises that morphed into credit crunches and recessions. This time might be different if the credit system is more resilient than in the past and inflation moderates rapidly in 2023, as we anticipate.
(2) Persistent inflation. In recent months, the economic indicators have supported the “no-landing” scenario rather than either the hard-landing or soft-landing alternatives. Surprisingly resilient economic growth might cause inflation to persist at high levels rather than to moderate. If so, the Fed will have no choice but to hike the federal funds rate higher for longer. The narrowing path to a soft landing would no longer be an option for the Fed. Instead, Fed officials likely would conclude that the only way to bring inflation down is by causing a recession. In this scenario, they might have to raise the federal funds rate much closer to the inflation rate (or even above it) until that does the job.
Upward pressure on inflation once again could result from supply-chain disruptions attributable to geopolitical developments. The latest wave of the pandemic in China could shut down production of key parts needed by manufacturers around the world. China’s M-PMI and NM-PMI both fell further below 50.0 during December, to 47.0 and 41.6 (Fig. 5). The virus could spread even more rapidly during China’s upcoming New Year holiday, which begins on January 22 and ends on February 5.
Energy prices soared in early 2022 but eased significantly as the year progressed (Fig. 6). They might fall further in 2023 if China’s economy continues to be challenged by the pandemic. They could also rebound sharply once China’s latest Covid wave peaks.
(3) Fed accident. Fed officials first recognized that they were way behind the inflation curve early last year. They spent the rest of the year scrambling to catch up to it. As a result, they raised the federal funds rate from 0.00%-0.25% at the start of 2022 to 4.25%-4.50% by the end of the year. It has been the most significant tightening of monetary policy since late 1979, when then-Fed Chair Paul Volcker had to deal with soaring inflation.
Fed officials often have observed that monetary policy operates with long and variable lags before impacting the economy. Yet they might continue to tighten aggressively if high inflation persists over the short term. The Fed’s latest projections for the federal funds rate indicate a peak rate of 5.1% by the end of 2023. And Federal Reserve Chair Jerome Powell has suggested that the rate might have to go higher. During his December 14 presser, he said that “we’re not at a sufficiently restrictive policy stance yet,” mentioning the word “restrictive” 14 times.
The remaining question may be what pace of hiking will the Fed take to get to “sufficiently restrictive.” Dictating the pace likely will be consumer prices for services excluding housing-related prices. Powell noted that “there's an expectation” that this inflation component “will not move down so quickly.” He is concerned that these prices are being inflated by rising wages. As a result, Fed policy is aimed at reducing the demand for labor relative to its supply.
The yield curve seems to be saying “no más.” The Fed already has tightened enough, raising the risks of a financial accident, credit crunch, and recession. Our interpretation of the inverted yield curve is that the Fed has done enough to bring inflation down further in coming months.
But it’s possible that the Fed might mistakenly overdo the tightening in an attempt to correct for its prior mistakes—i.e., having held monetary policy too easy for too long.
(4) Shortage of M2. Monetarists seem to be making a comeback, and they are sounding the alarm that the recent weakness in the M2 measure of money is confirming that monetary policy already is tight enough to cause a recession. We’ve addressed this issue in the past, and we still aren’t alarmed.
M2 peaked at a record high during March 2022 (Fig. 7). It is down 1.8% since then through November. We estimate that it is still about $2.0 trillion above its pre-pandemic trendline. At least half of that represents the excess saving accumulated by consumers during the pandemic. M2 has been closely tracking personal saving on a 12-month basis since the start of the pandemic (Fig. 8).
The rest of the above-trend surplus M2 holdings probably represents precautionary liquidity held by consumers and businesses, as evidenced by the $3.6 trillion increase in demand deposits to $5.2 trillion since February 2020 (just before the pandemic) through November 2022.
Demand deposits as a percent of M2 rose from 10.3% just before the pandemic to 24.1% in November, holding around its highest percentage since the summer of 1972 (Fig. 9). The economy remains awash in liquidity, with the ratio of M2 to nominal GDP (i.e., the reciprocal of M2 velocity) still near its recent record high, 84% during Q3-2022 (Fig. 10).
2023: What Could Go Right? Pessimism is easier to sell than optimism, especially following last year’s annus horribilis. Nevertheless, let’s review what could go right in 2023:
(1) Transitory vs persistent inflation. We acknowledge that there is only one narrow path by which the economy could avoid a recession. Therefore, there is only one narrow path by which a bull market in stocks could resume this year. Both paths require a moderation of inflation. We continue to expect that inflation will moderate to 3%-4% based on the headline PCED in 2023. The Fed’s December Summary of Economic Projections shows that the FOMC’s participants are aiming for 3.1% this year, 2.5% in 2024, and 2.1% in 2025. We think that’s doable without (much) additional tightening and without a recession.
The PCED inflation rate peaked at 7.0% during June 2022 (Fig. 11). It was down to 5.5% during November. So it has peaked, but it remains high. A more definitive peak can be seen in the PCED for durable goods. It led inflation on the way up and is now doing so on the way down. It peaked at 10.5% during February and was down to only 2.7% during November of last year. Inflation in that component of the PCED has been relatively transitory.
We expect the same will be said about nondurable goods inflation in the PCED, which peaked at 13.2% during June 2022 but was still high at 8.1% during November. The more persistent source of inflationary pressure remains the PCED for services, which peaked at 5.5% during October 2022 and has yet to show signs of a definite peak, which might not occur until mid-2023 given the inertia in rent inflation.
The three-month annualized percent changes in these PCED components are also mostly lending support to the moderating inflation story. Here they are through November compared to their y/y readings for the core PCED (3.6%, 4.7%), durable goods (-3.8, 2.7), core nondurable goods (1.0, 3.8), and core services (5.7, 5.0) (Fig. 12).
(2) Resilient consumers. A recession forecast for 2023 requires that consumer spending weakens significantly. JPMorgan Chase CEO Jamie Dimon has claimed that excess savings boosted consumer spending in 2022. He expects excess savings to run out during the second half of this year, resulting in a consumer-led recession. That’s a plausible scenario.
However, employment gains also have supported consumer spending and may continue to do so in 2023 given that labor shortages are likely to persist. More importantly, we expect that wages will be rising faster than prices in 2023, boosting consumers’ purchasing power, as started occurring late last year (Fig. 13). That could put downward pressure on corporate profit margins, though we expect to see better growth in productivity this year than last year.
There was a “rolling recession” in consumer spending last year as consumers reduced their purchases of goods while increasing their spending on services (Fig. 14). That followed their buying binge on goods during the pandemic years of 2020 and 2021. Retailers had to lower their prices last year to reduce bloated inventories, contributing to the drop in goods inflation.
(3) Mixed housing. Many recession alarmists have observed that housing has almost always been the epicenter of economy-wide recessions and that it will be so once again. We disagree because some of the weakness in single-family housing construction is being offset by strength in multi-family construction and spending on home improvements (Fig. 15). In other words, housing is also experiencing a rolling recession, not a broad-based one that leads the rest of the economy southward.
(4) Solid capital spending. The regional business surveys conducted by five of the 12 Fed district banks did show slowing capital spending activity last year through December (Fig. 16). But the averages of the current and future regional capital spending indexes remained solidly in positive territory. In a recession, corporate profits would fall, forcing companies to cut their costs by reducing headcount and capital outlays. In a rolling recession, that’s less likely to happen on an economy-wide basis.
Furthermore, we continue to expect that companies will respond to chronic labor shortages by spending more on labor-saving capital equipment and technologies. In addition, the pandemic-induced onshoring of supply chains implies more capital spending, not less.
(5) Full fiscal pipeline. As noted above, the federal government will stay open and will continue to spend money. Lots of fiscal stimulus remains in the pipeline because of various spending bills passed under the Biden administration that will significantly boost outlays on infrastructure, semiconductor manufacturing plants, defense, and green projects. During the pandemic, the federal government dramatically boosted spending on income redistribution (Fig. 17). In 2023 and coming years, the federal, state, and local governments are on course to spend more on goods and services, boosting their contribution to real GDP (Fig. 18).
Movie. “Causeway” (+) (link) is a slow-paced movie about Lynsey, a US soldier played by Jennifer Lawrence who struggles to adjust to life back home after suffering a traumatic brain injury while serving in Afghanistan. Lynsey befriends James, an auto mechanic played by Brian Tyree Henry. He also has experienced trauma in his life, because of an auto accident. Their friendship helps them to heal some of their wounds. Both actors provide heartfelt performances and will probably be nominated for acting awards.

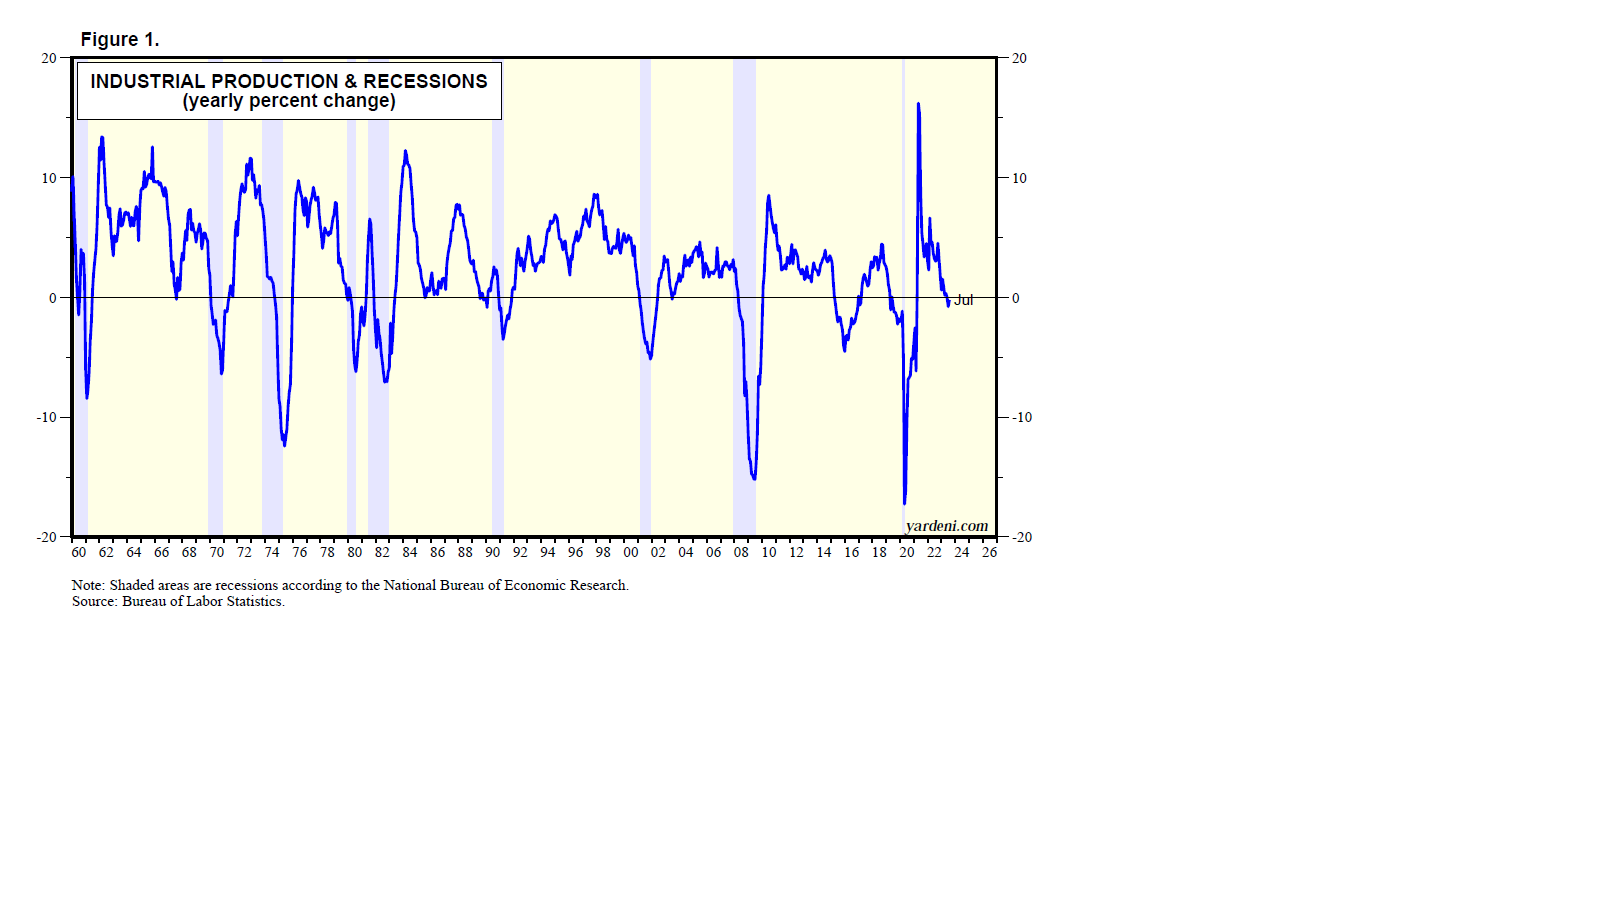
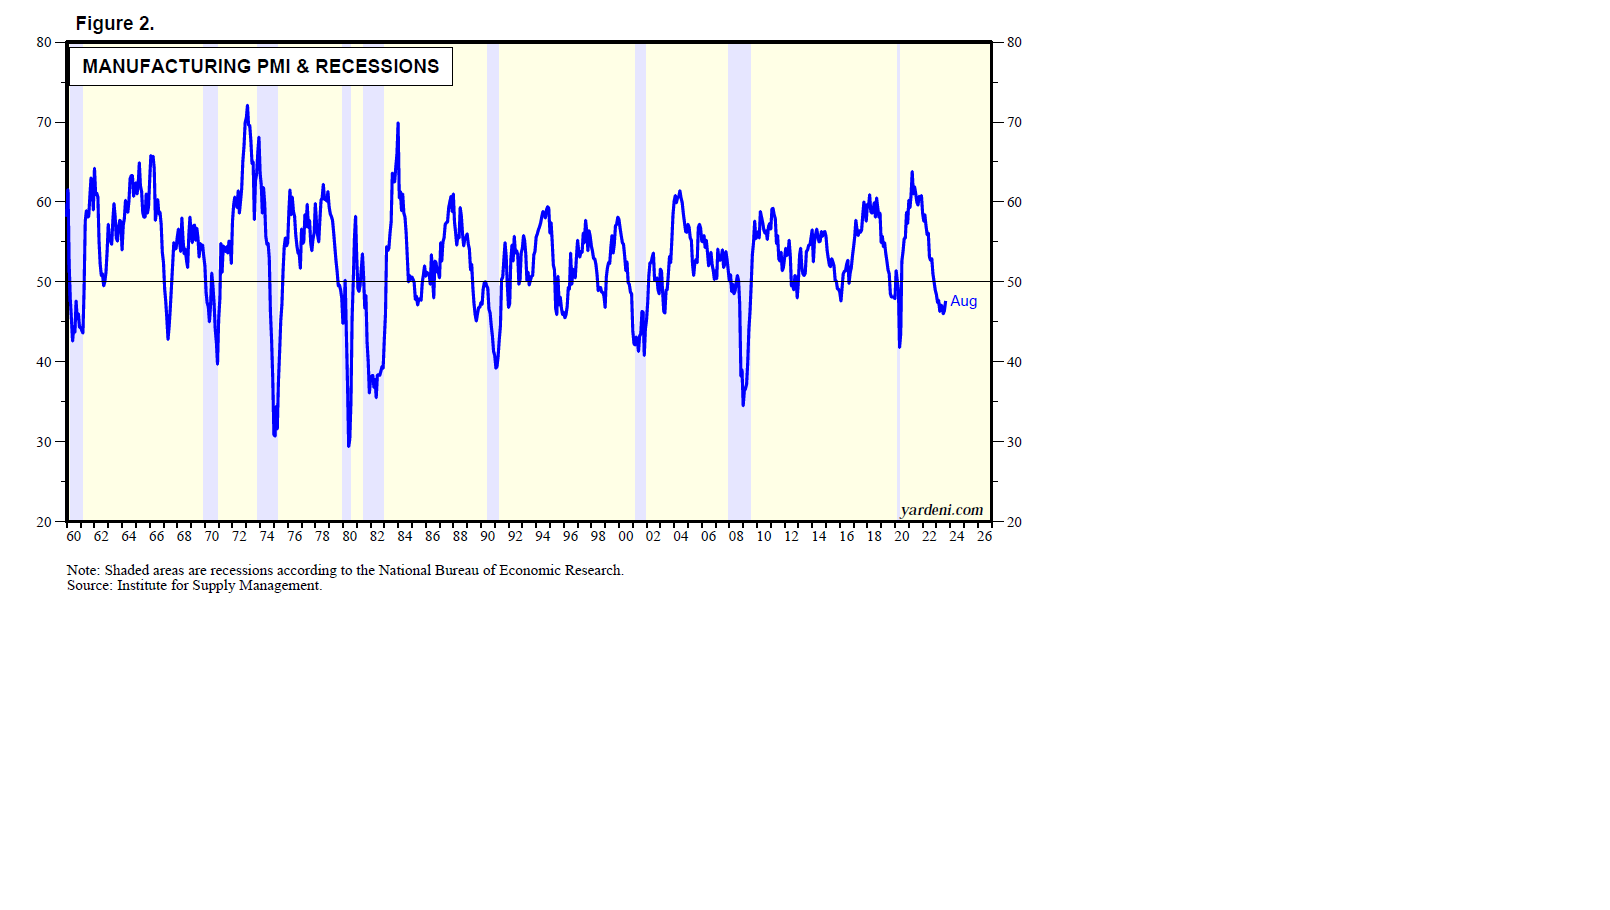
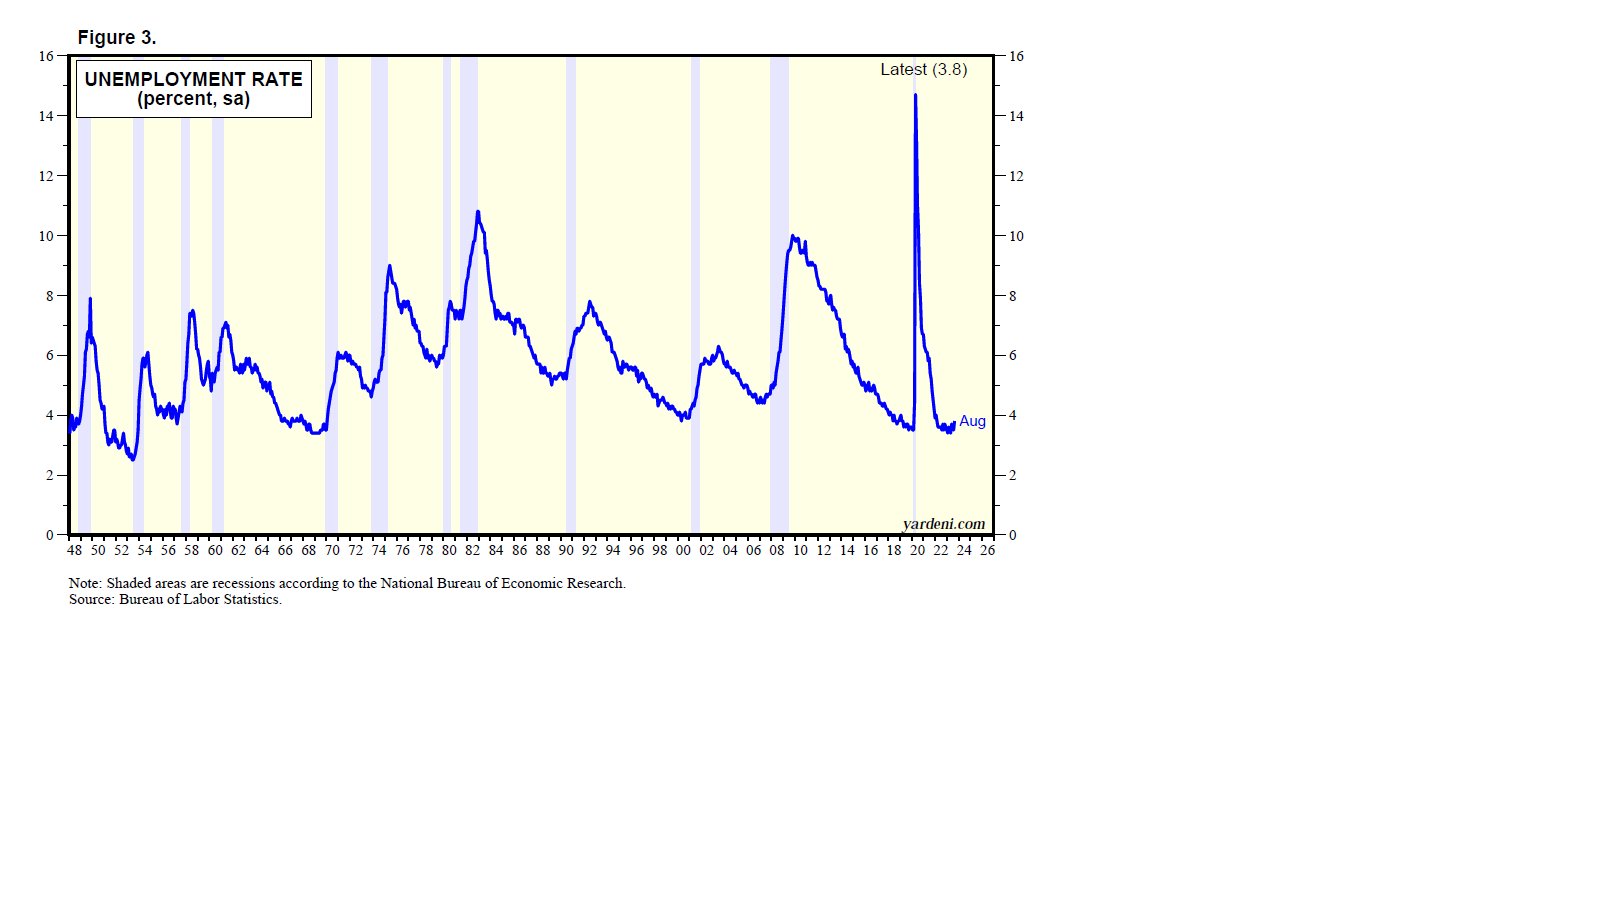
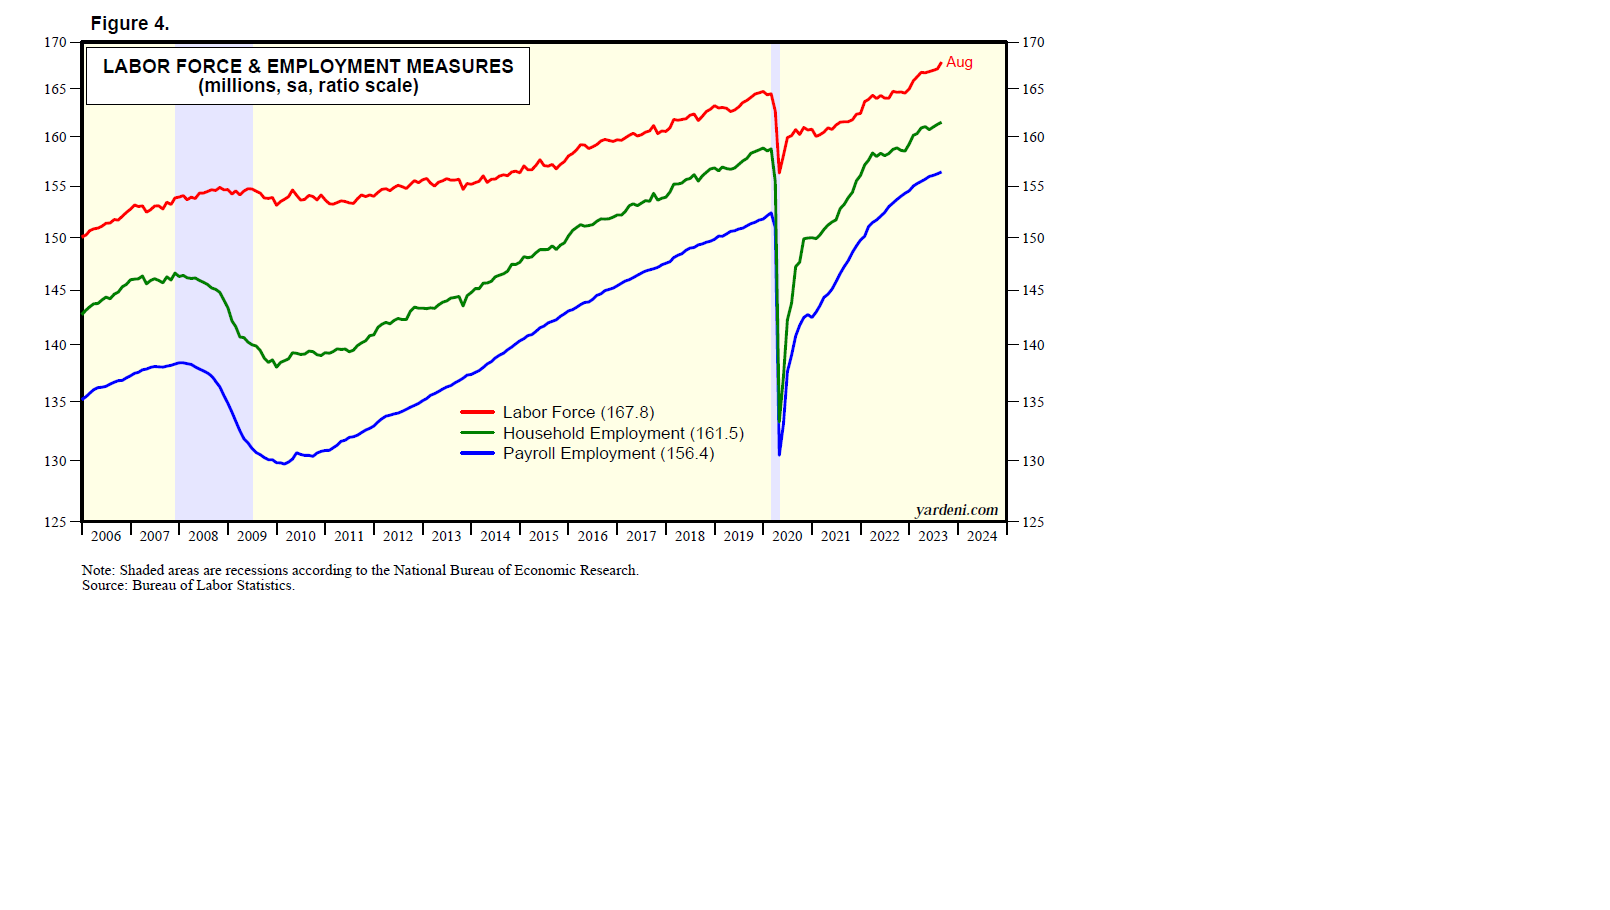
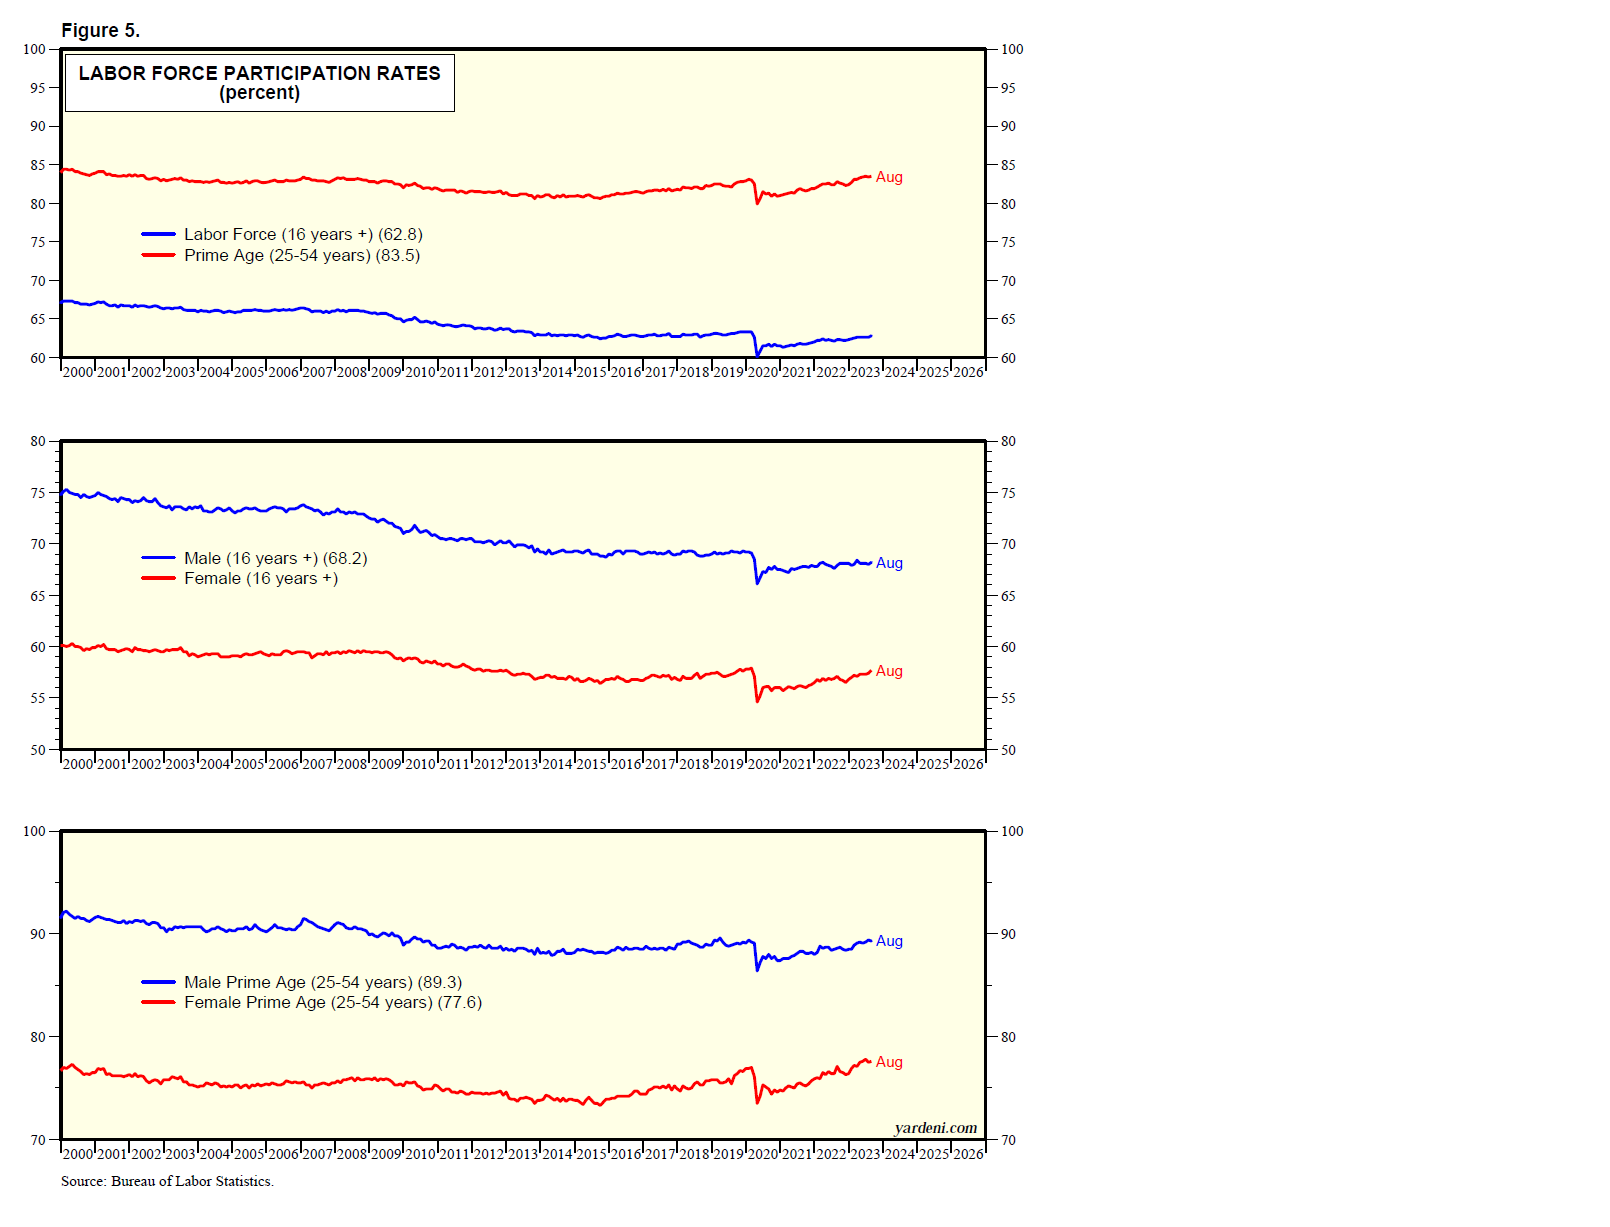
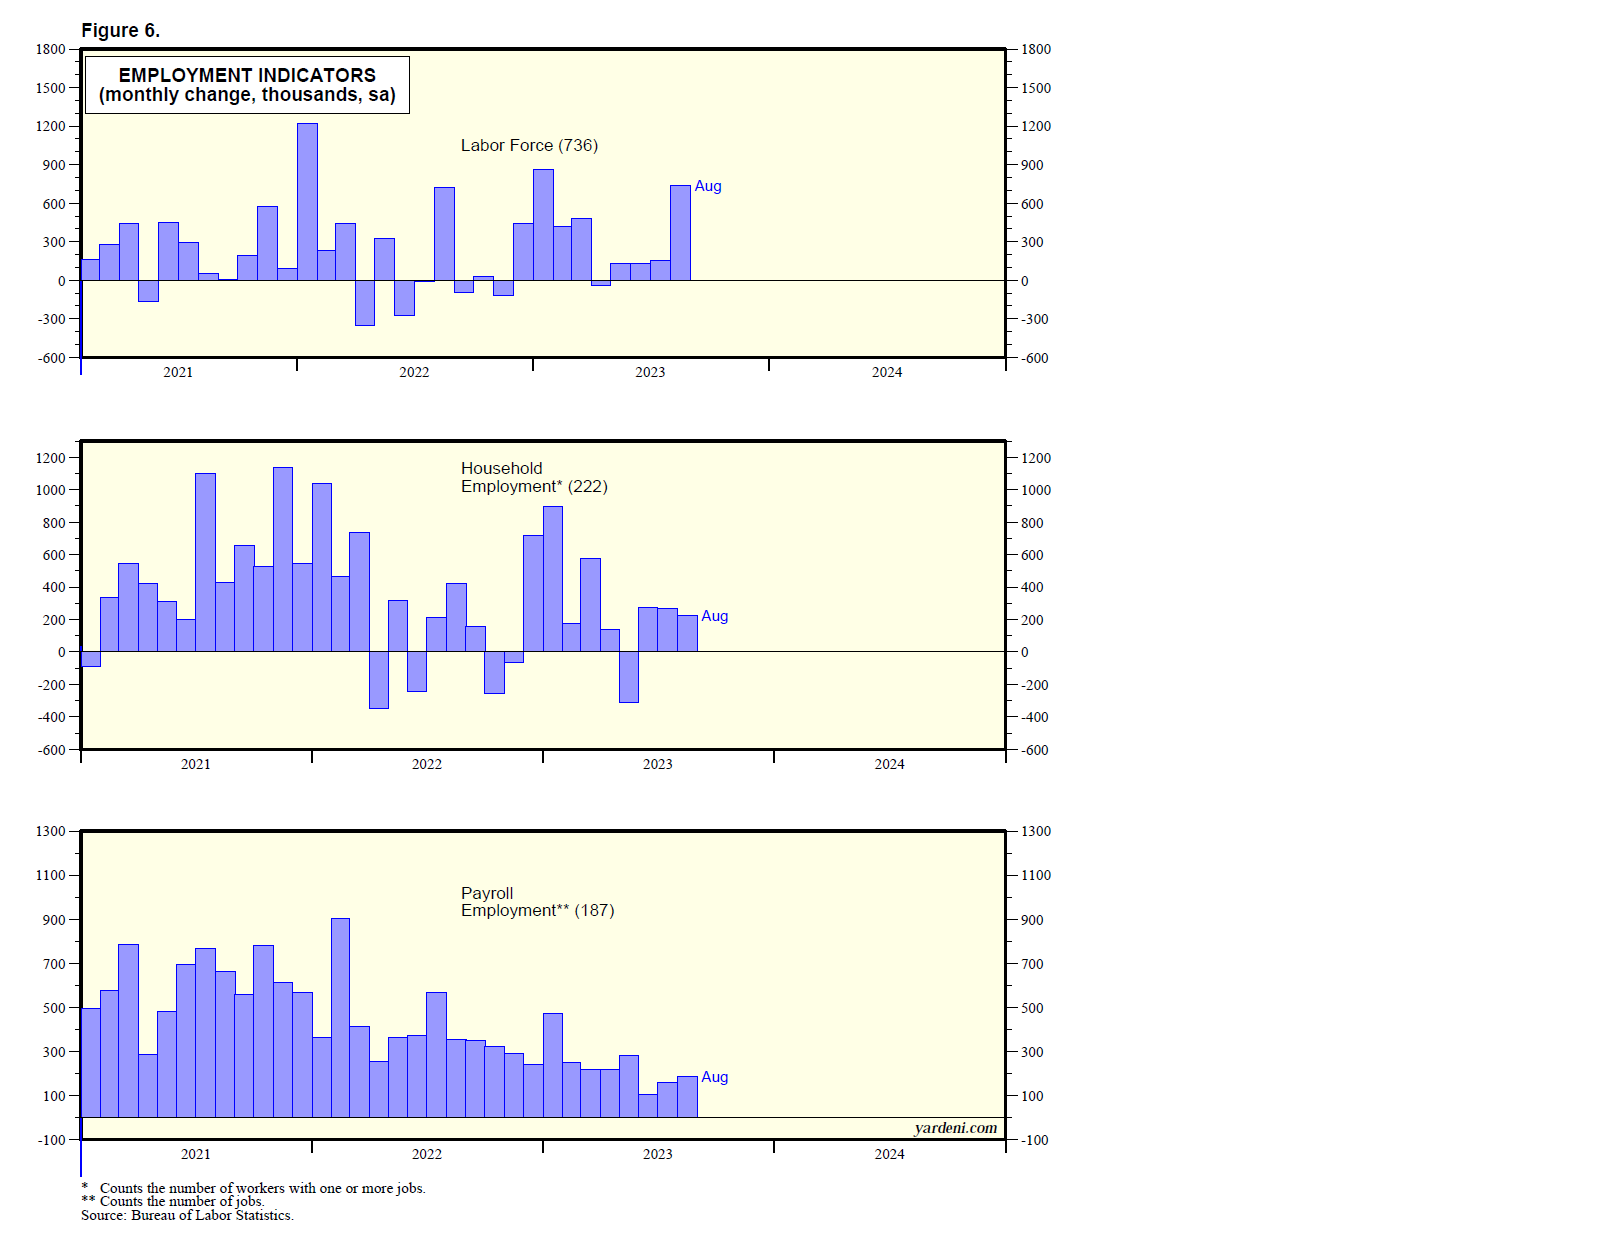
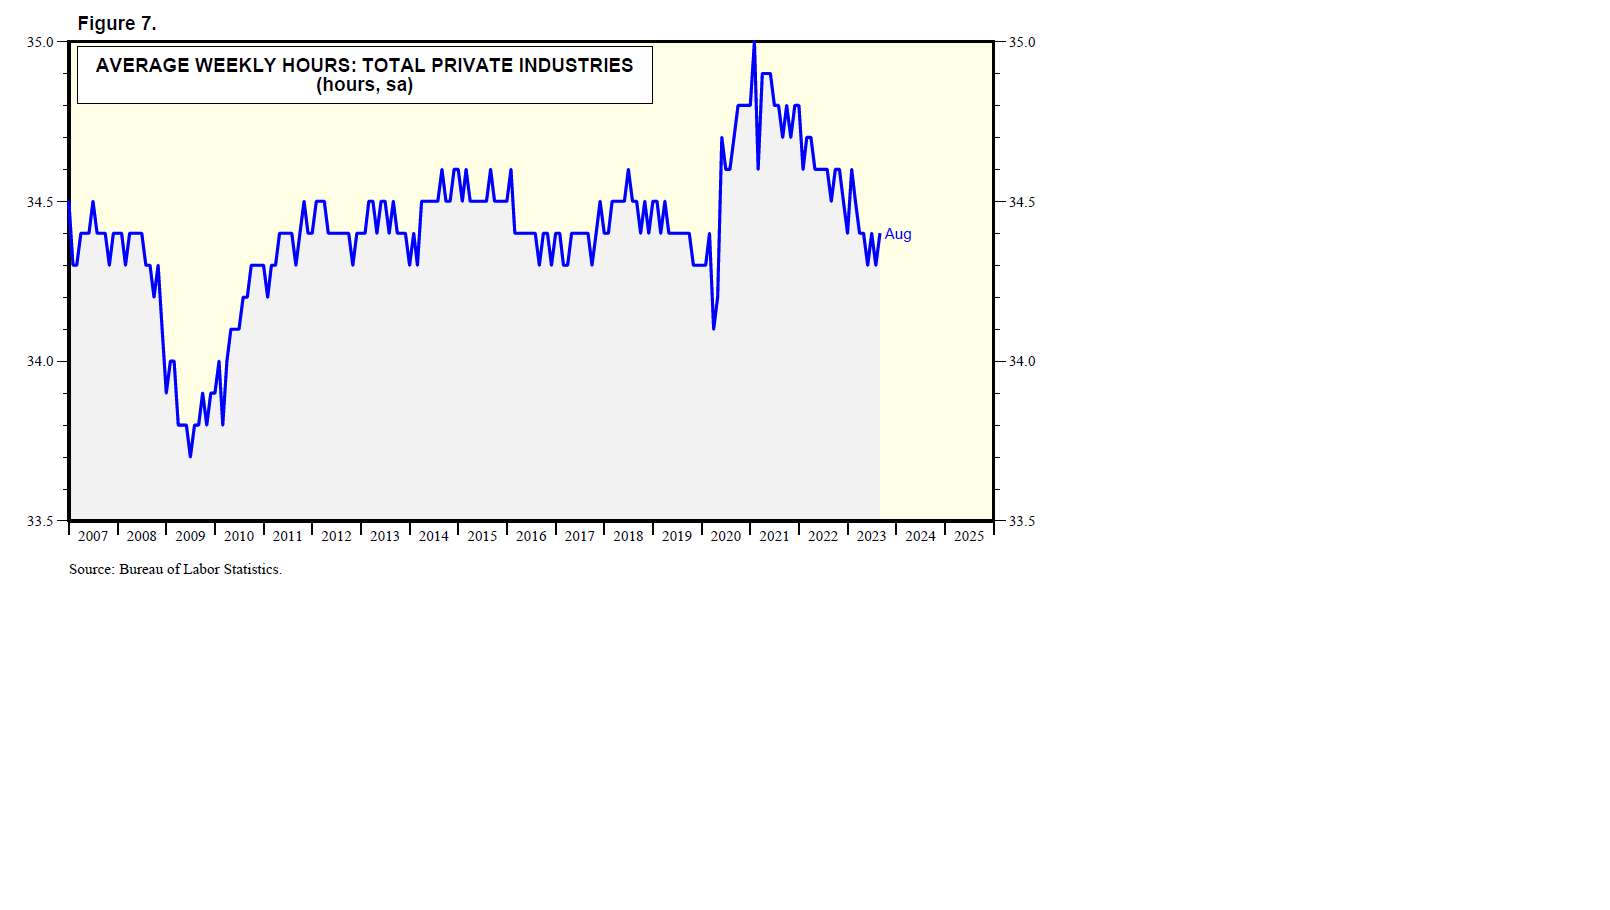
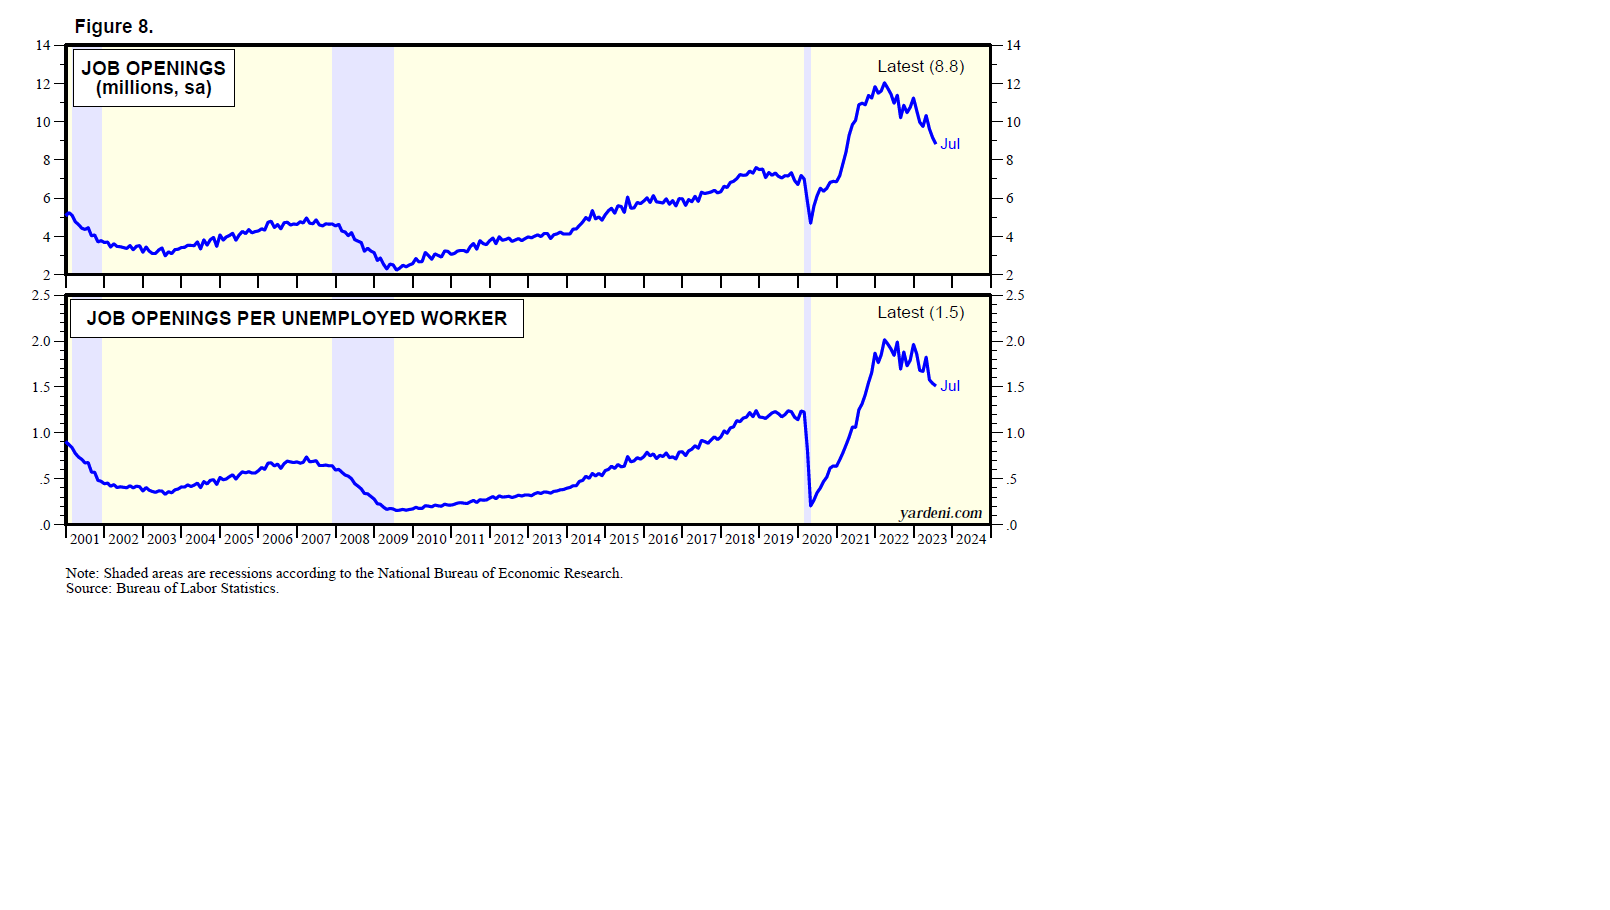
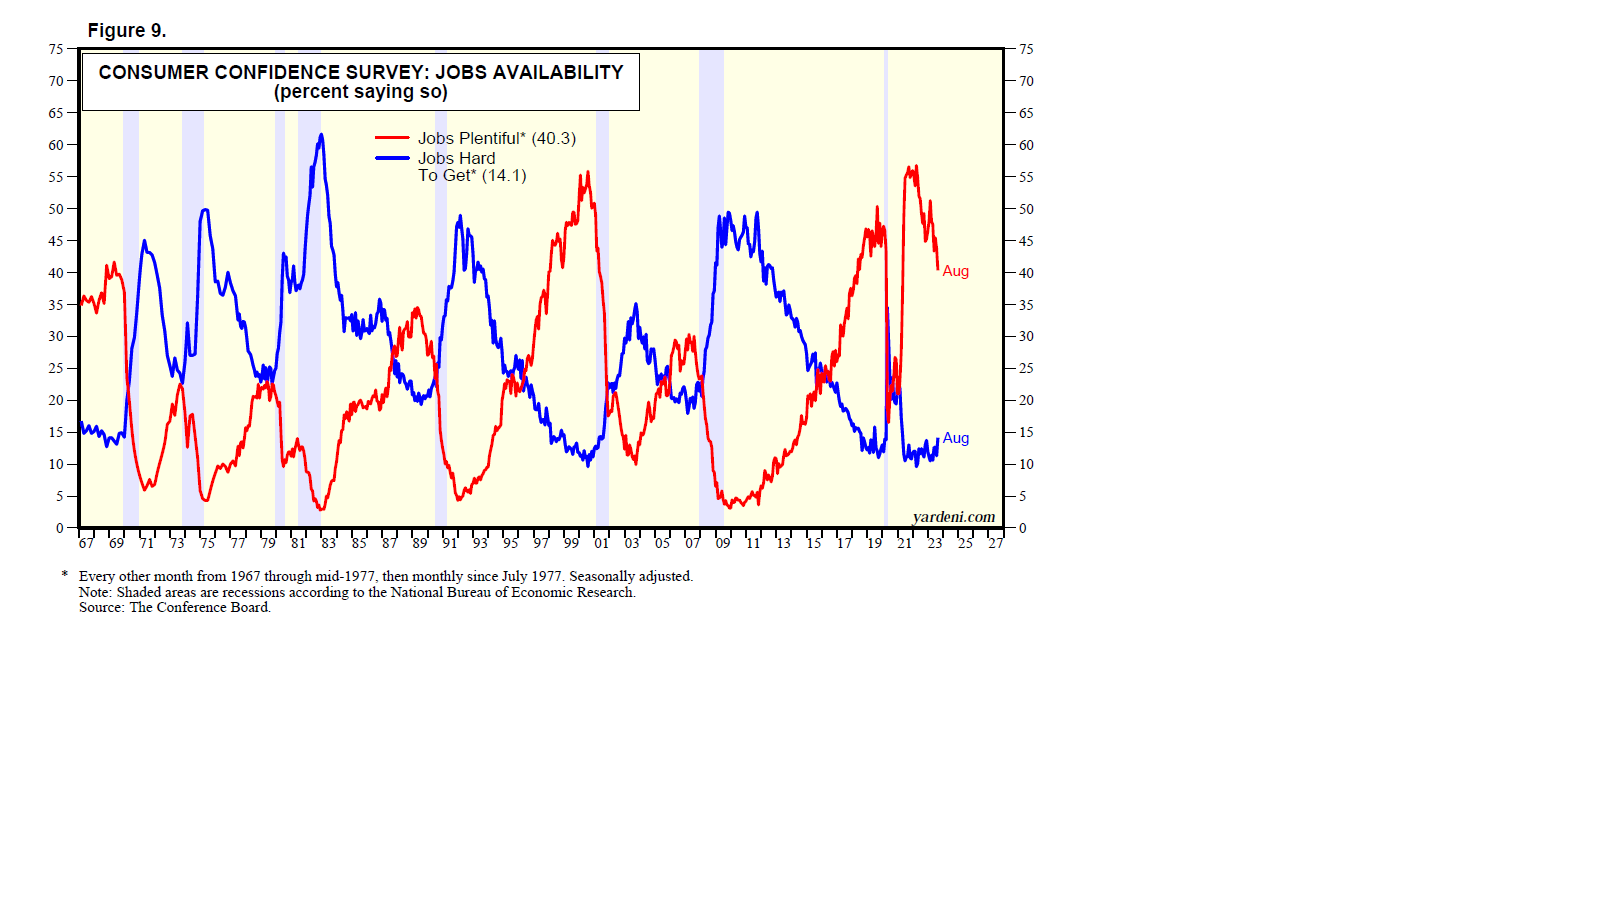
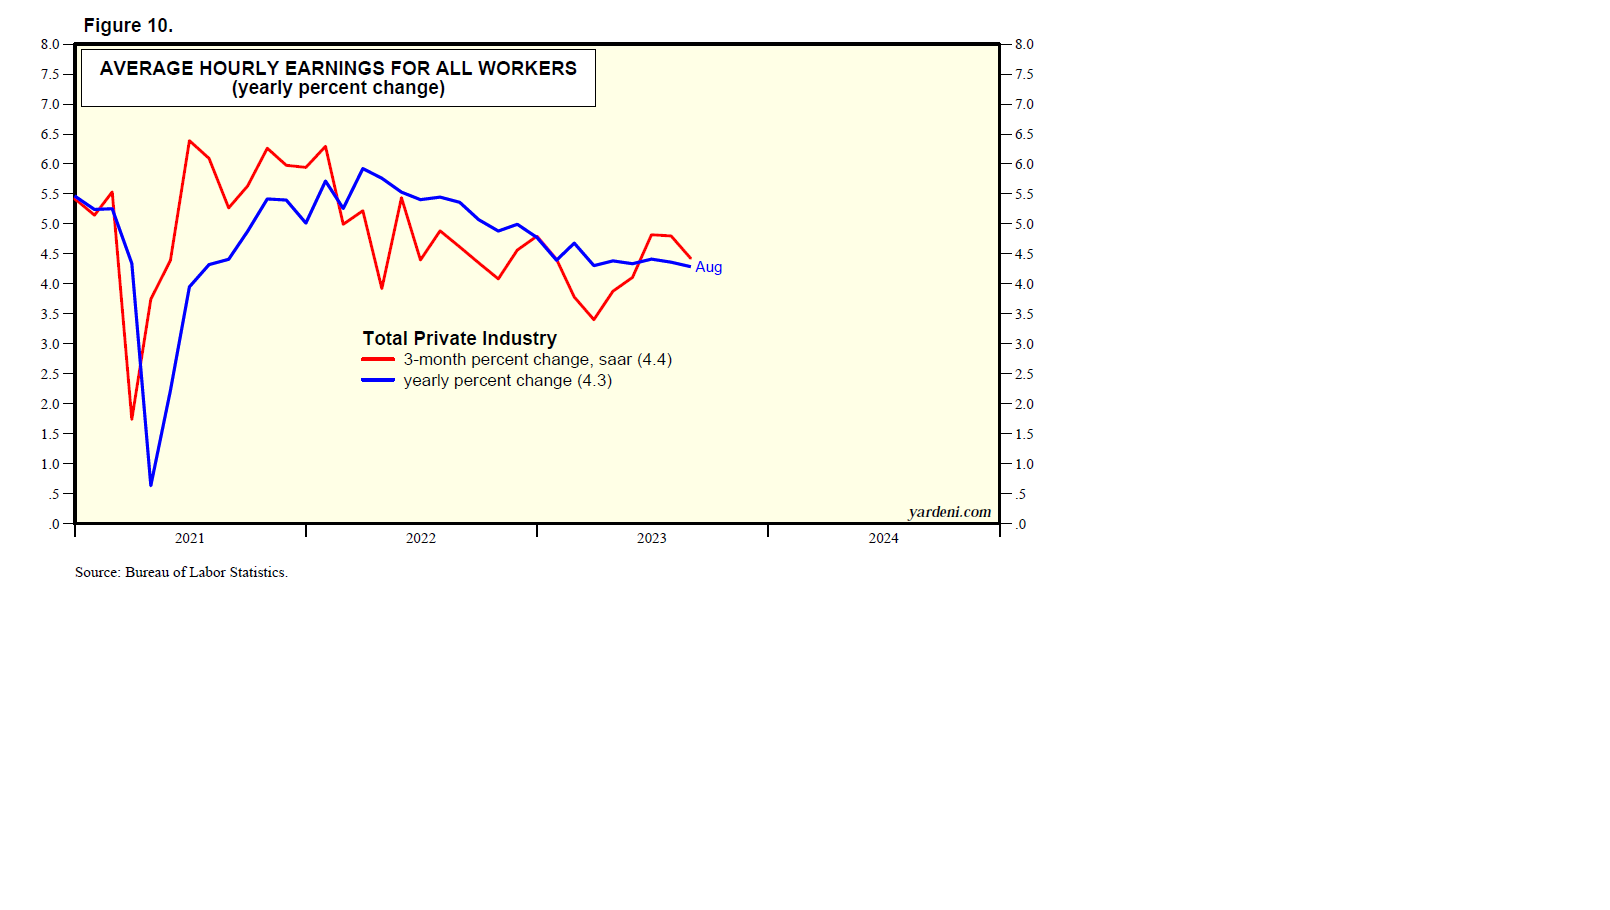
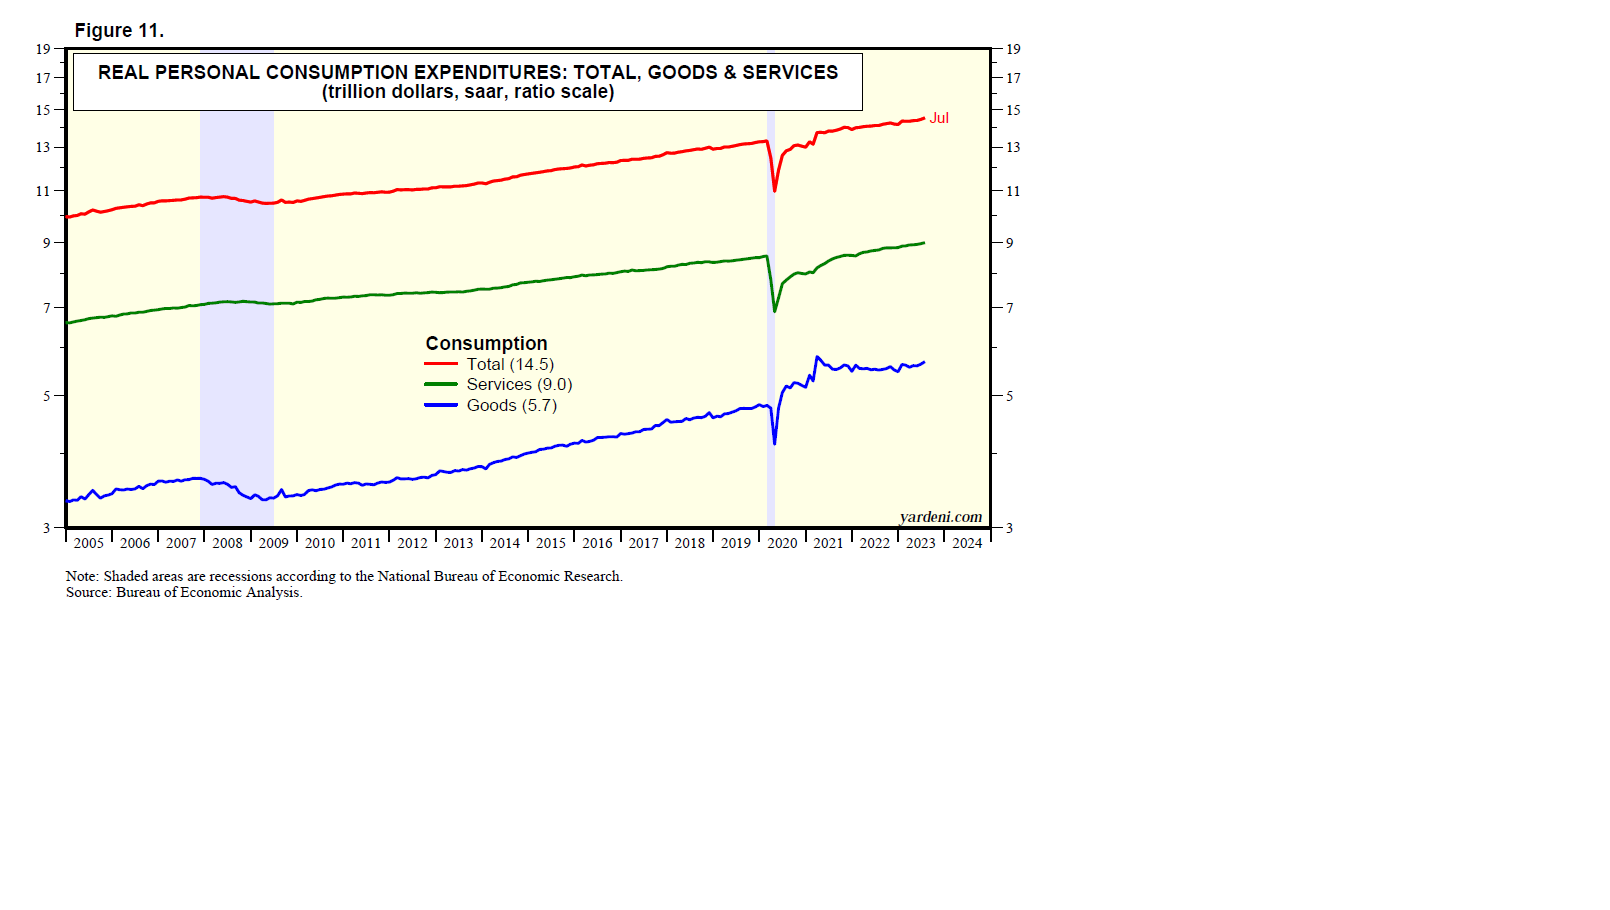
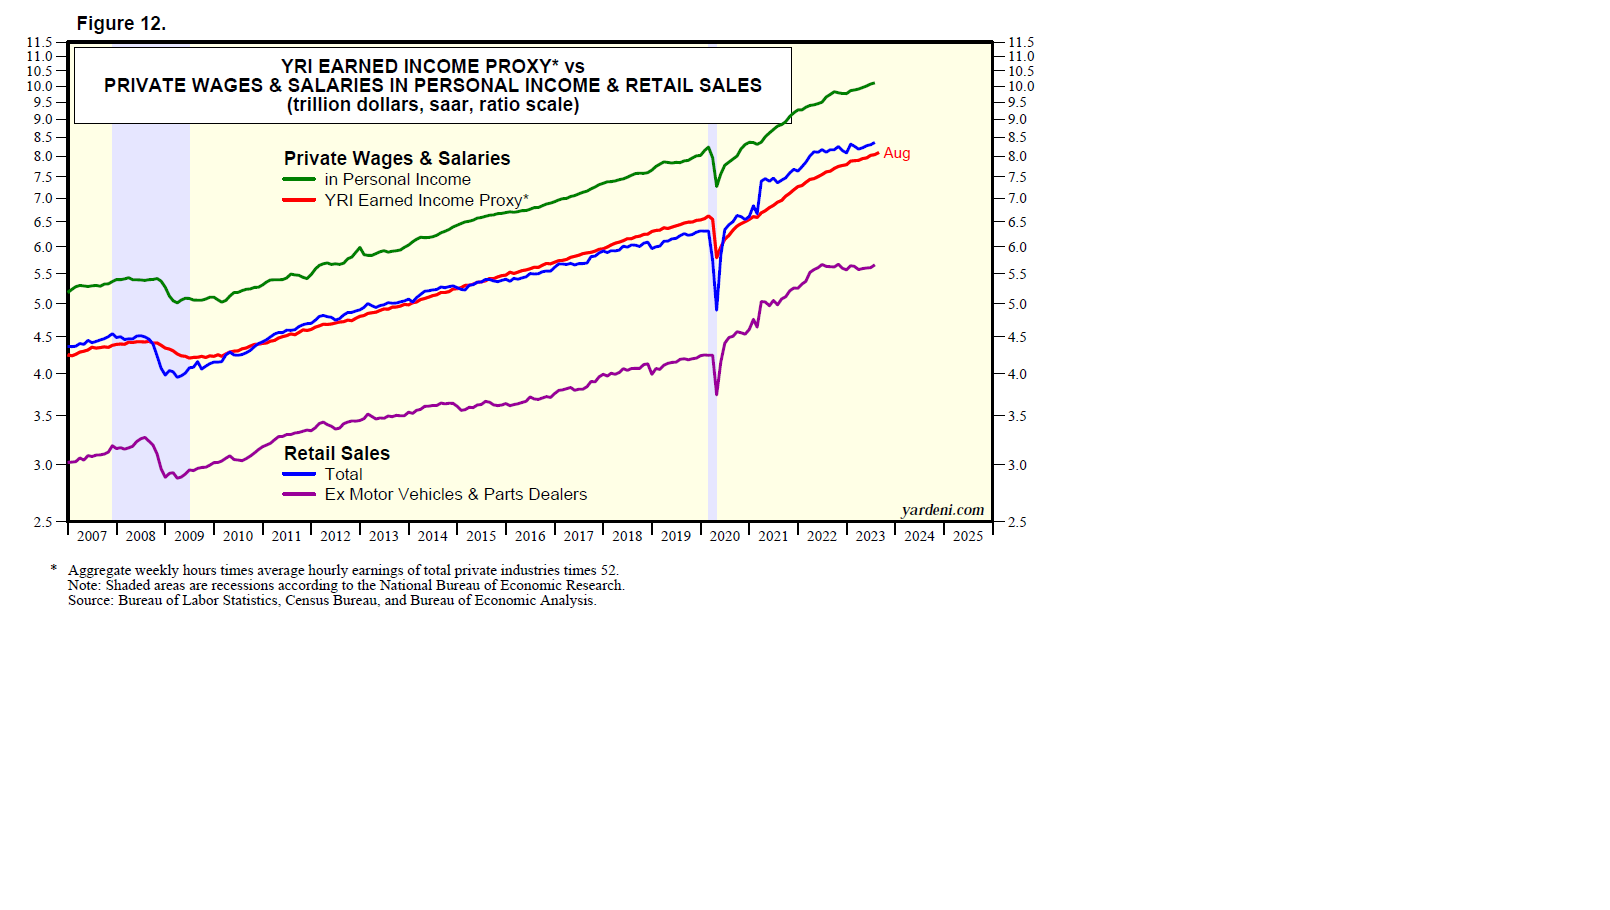
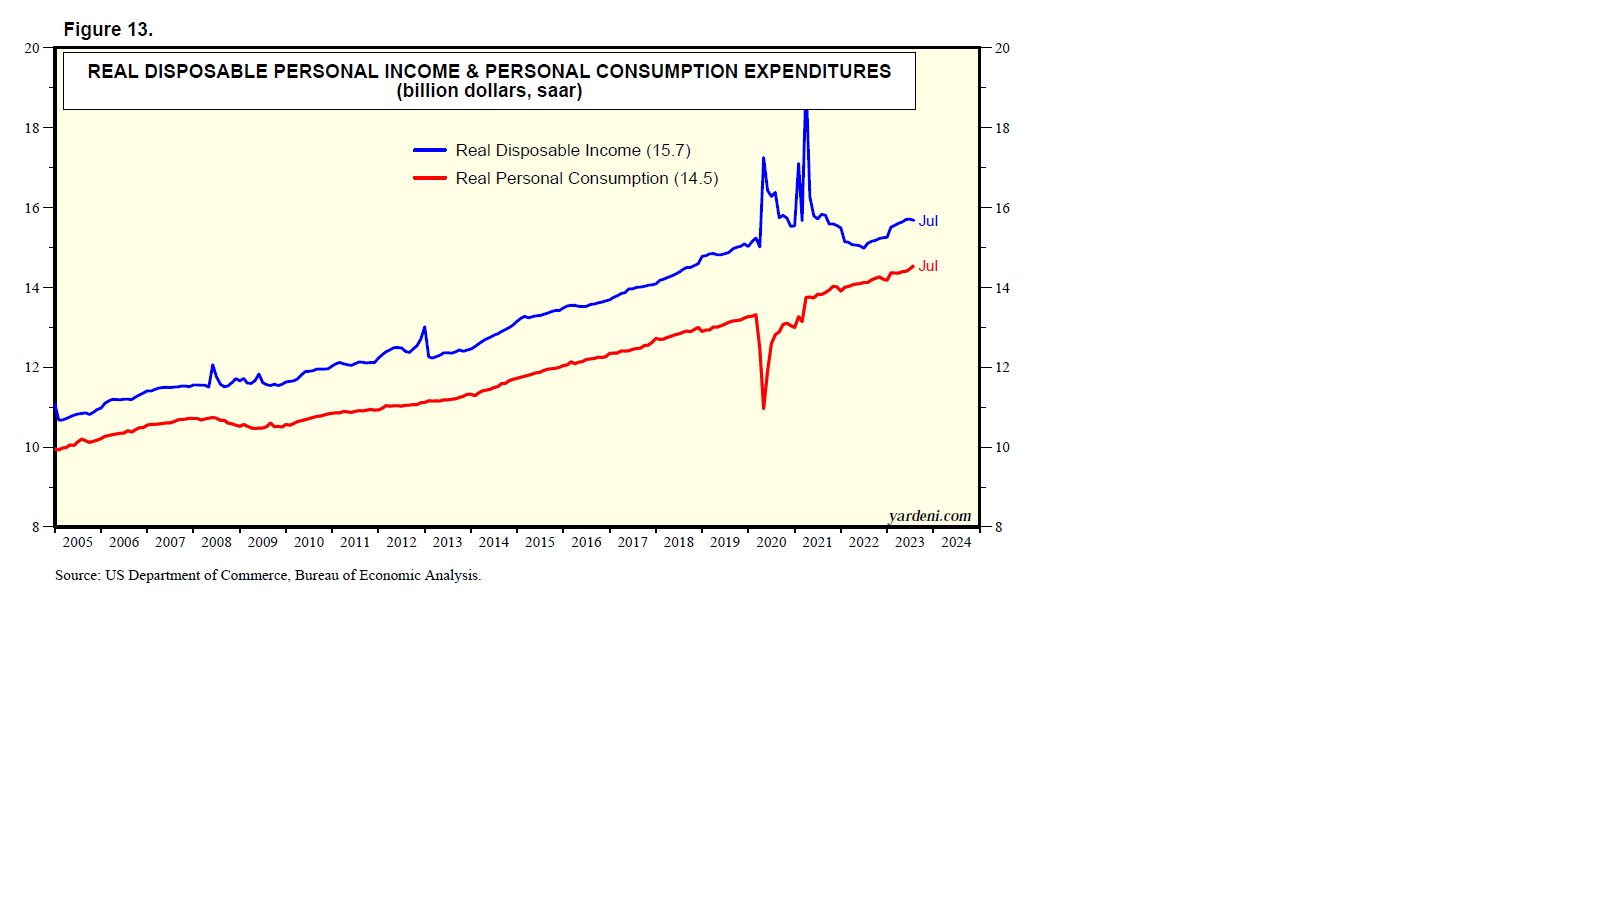
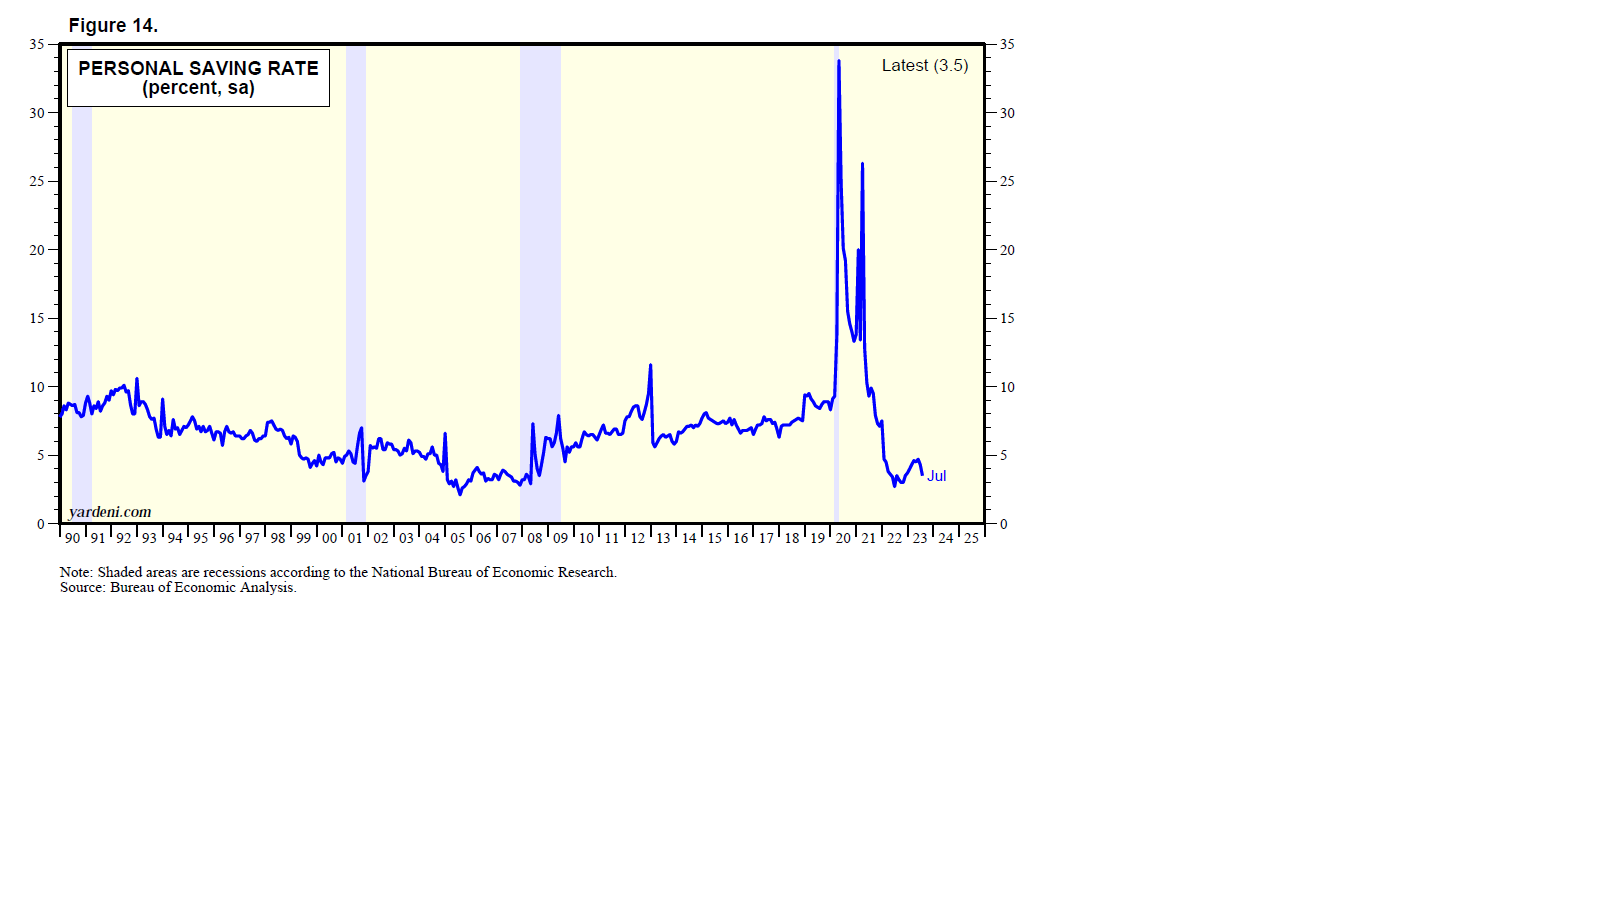
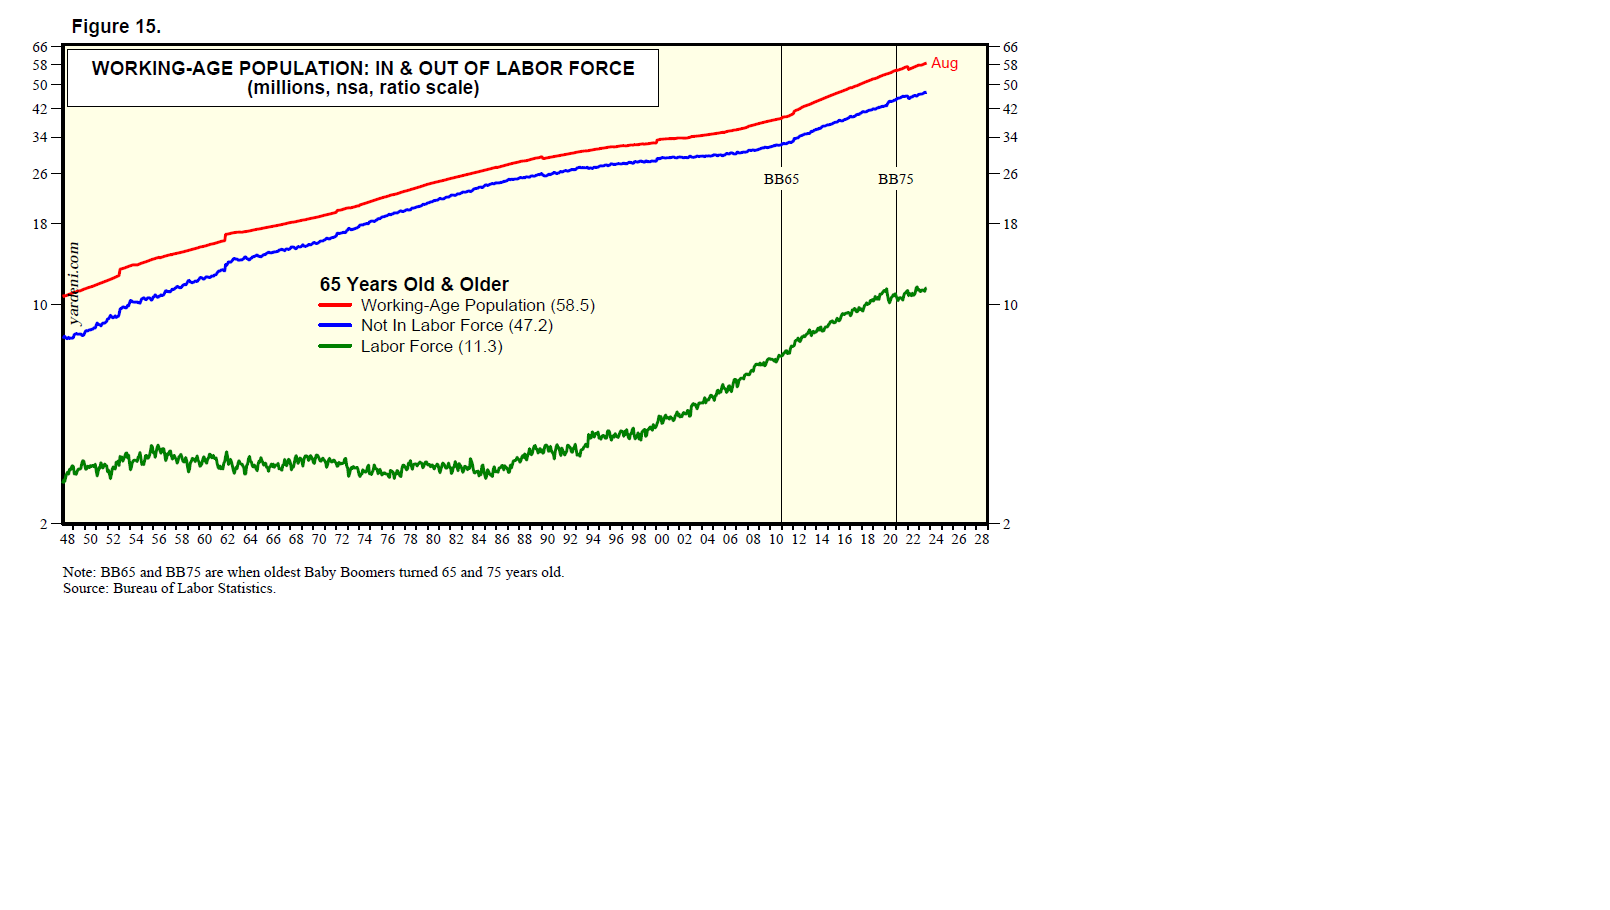
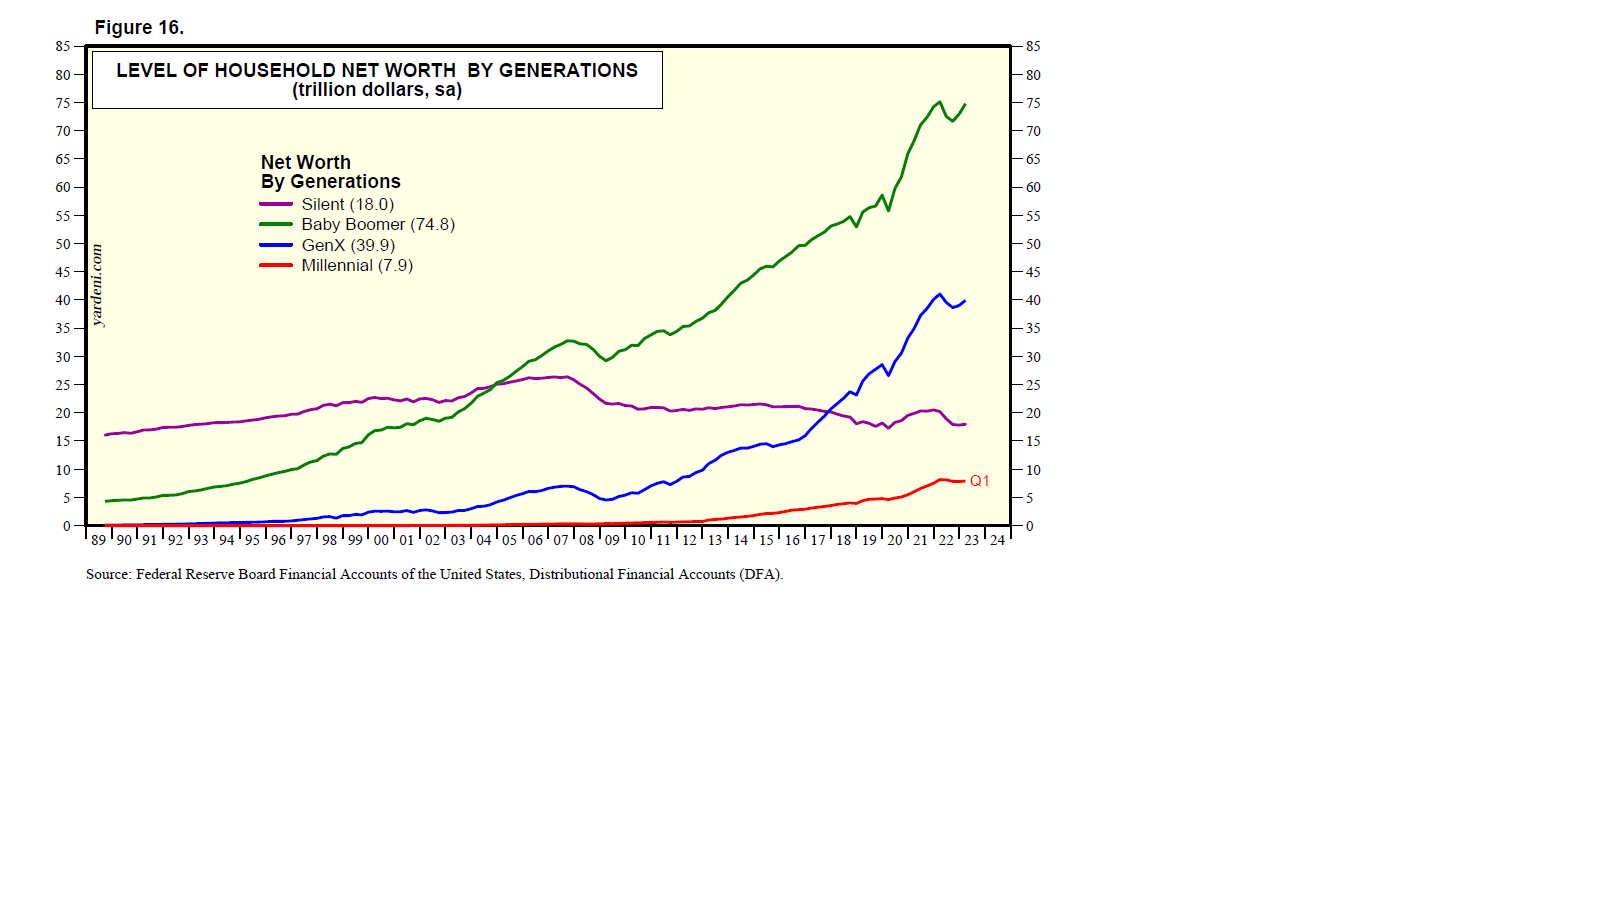
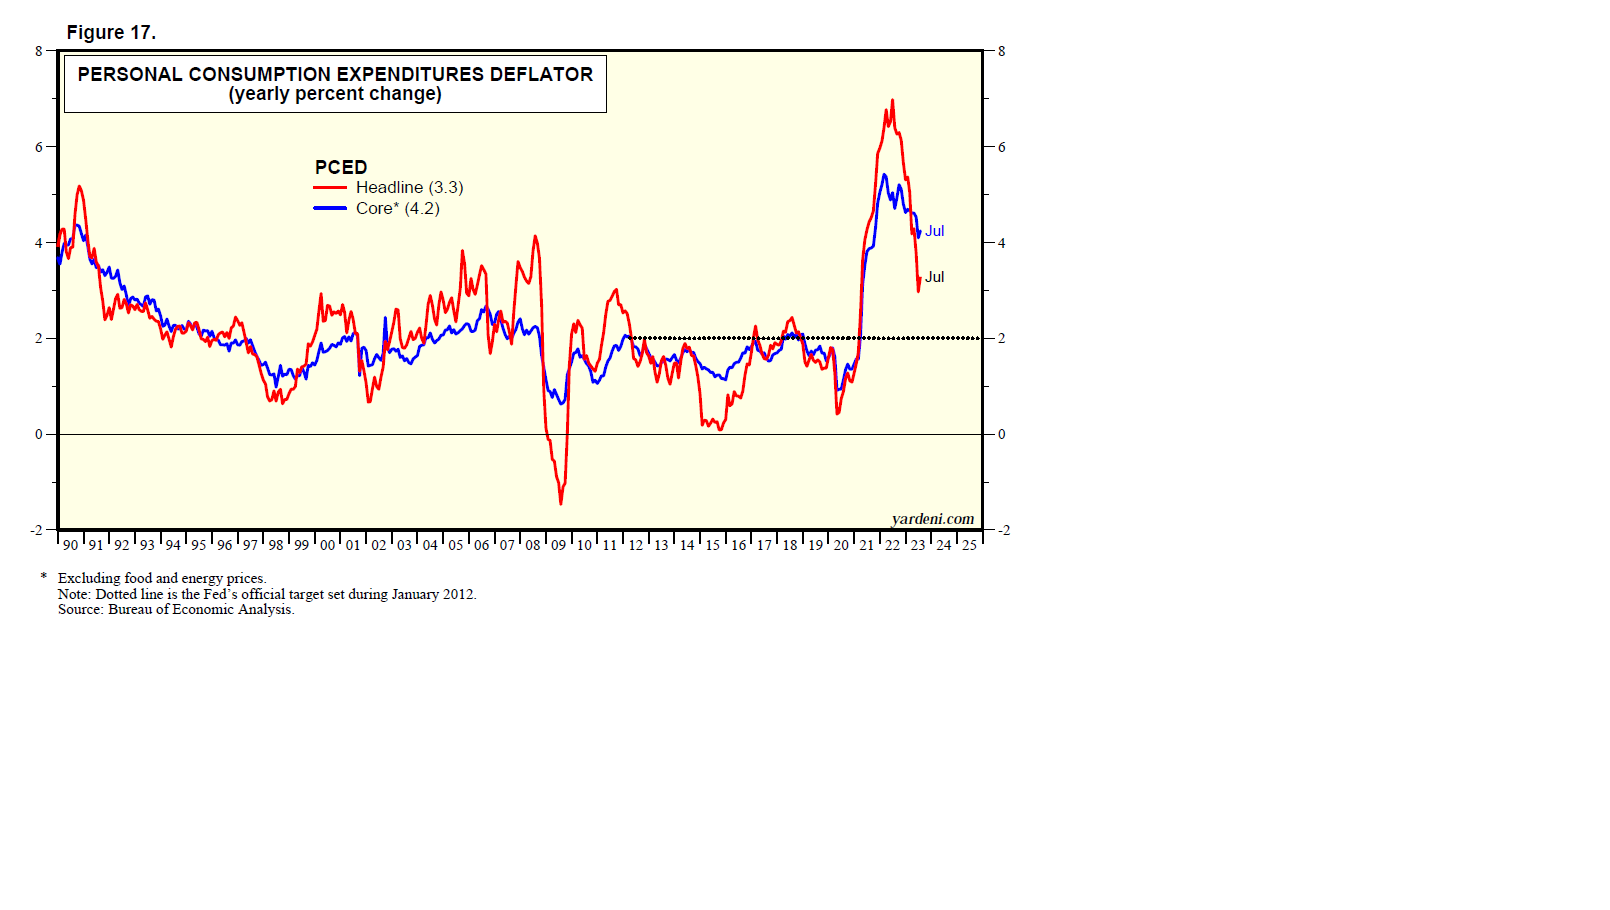
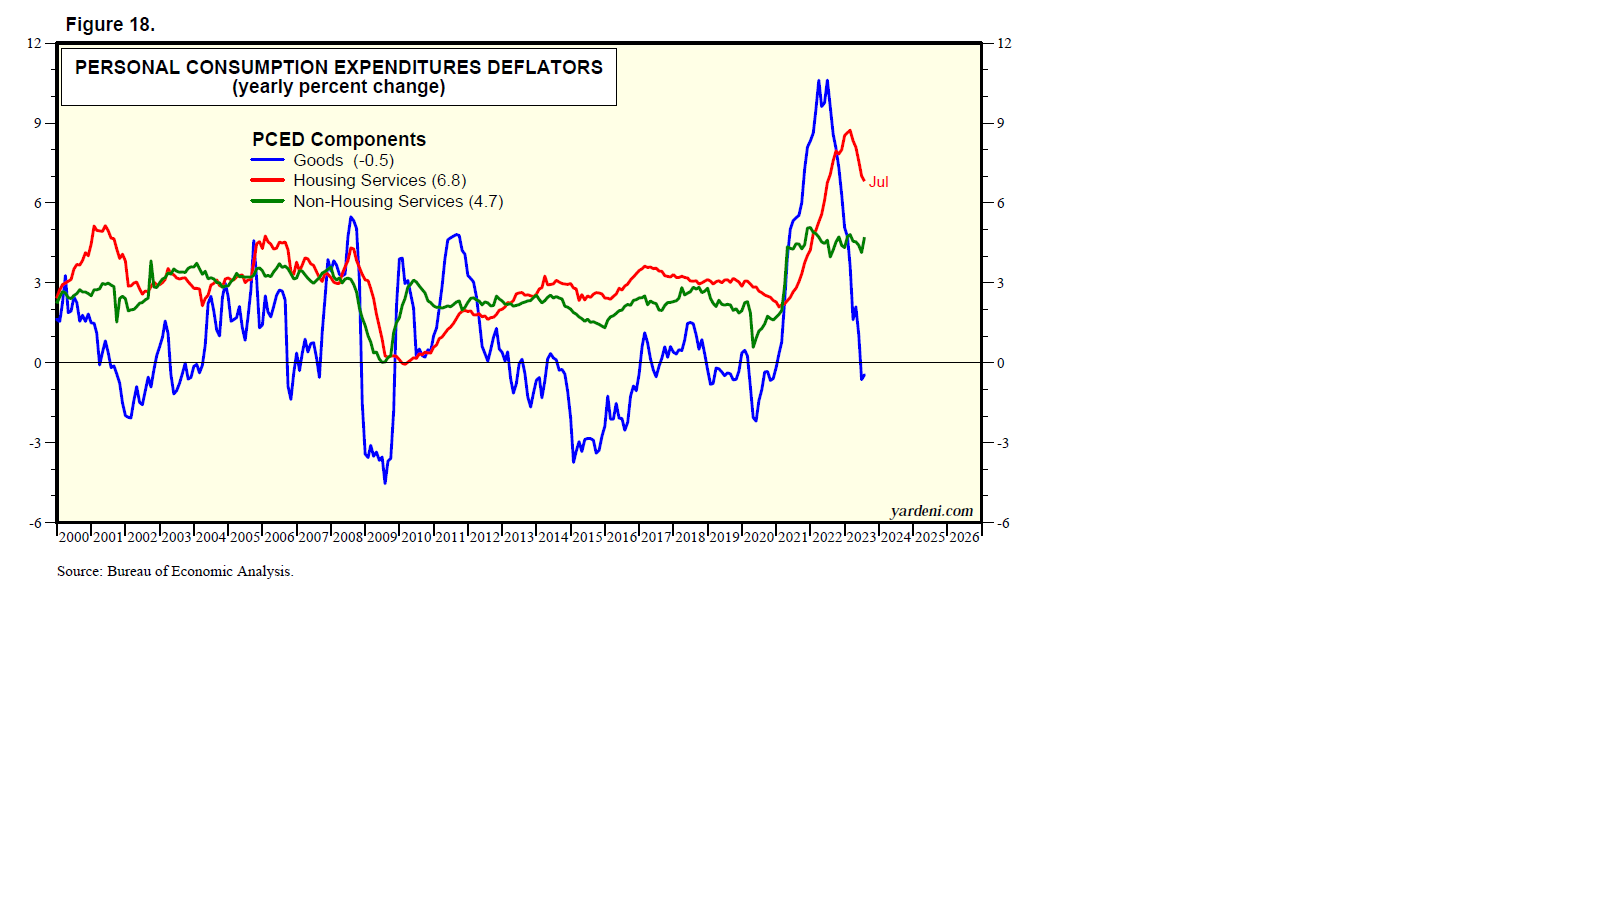
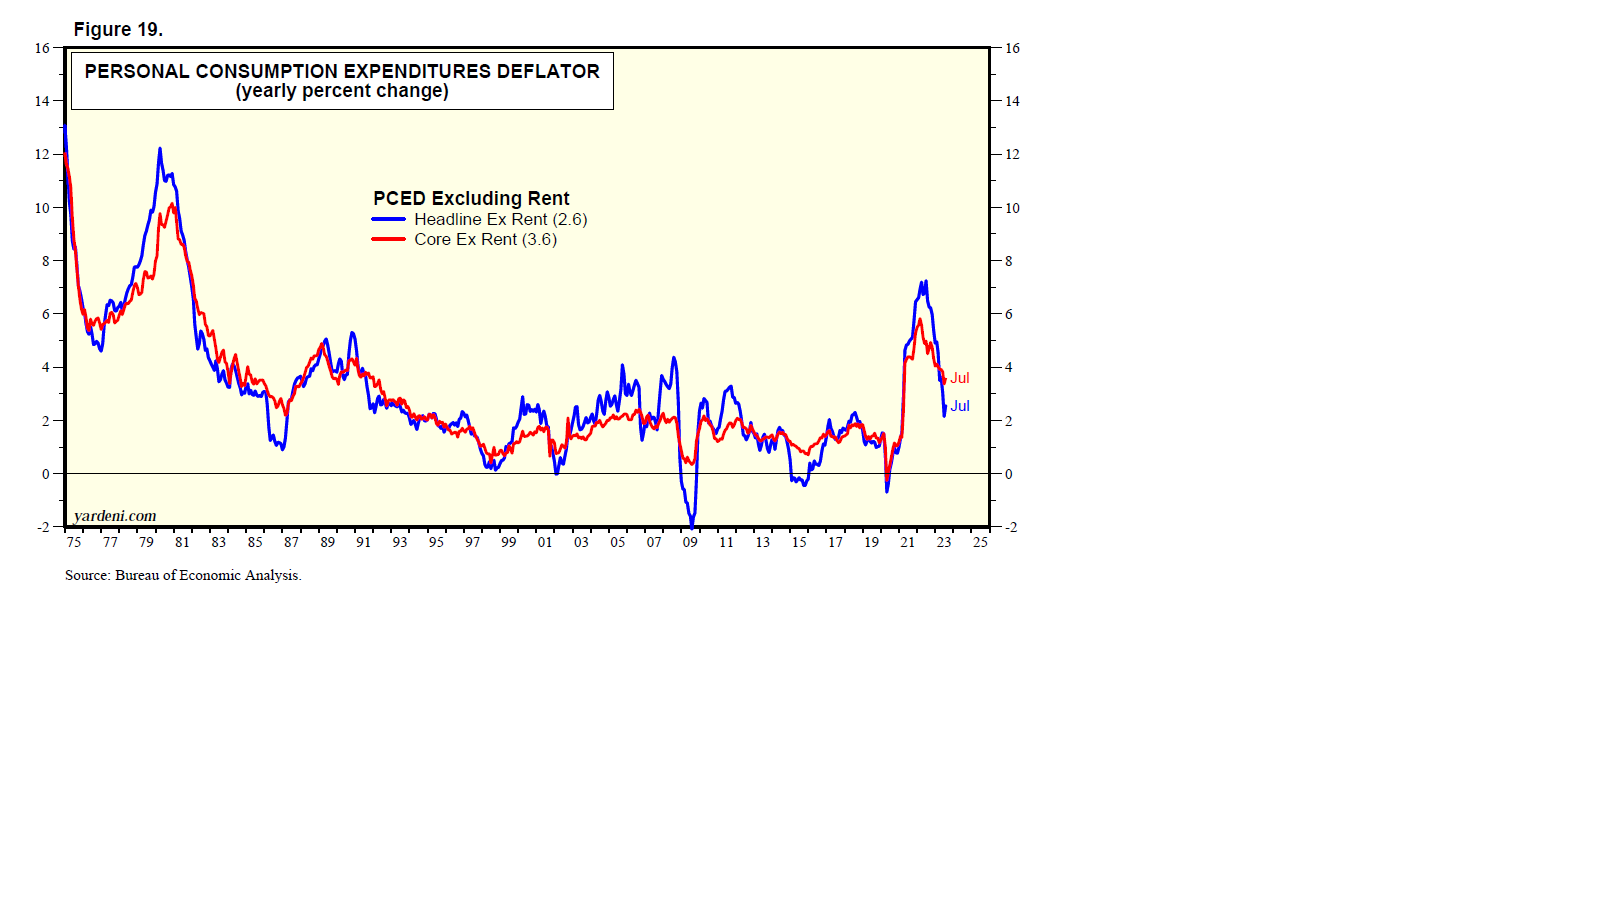
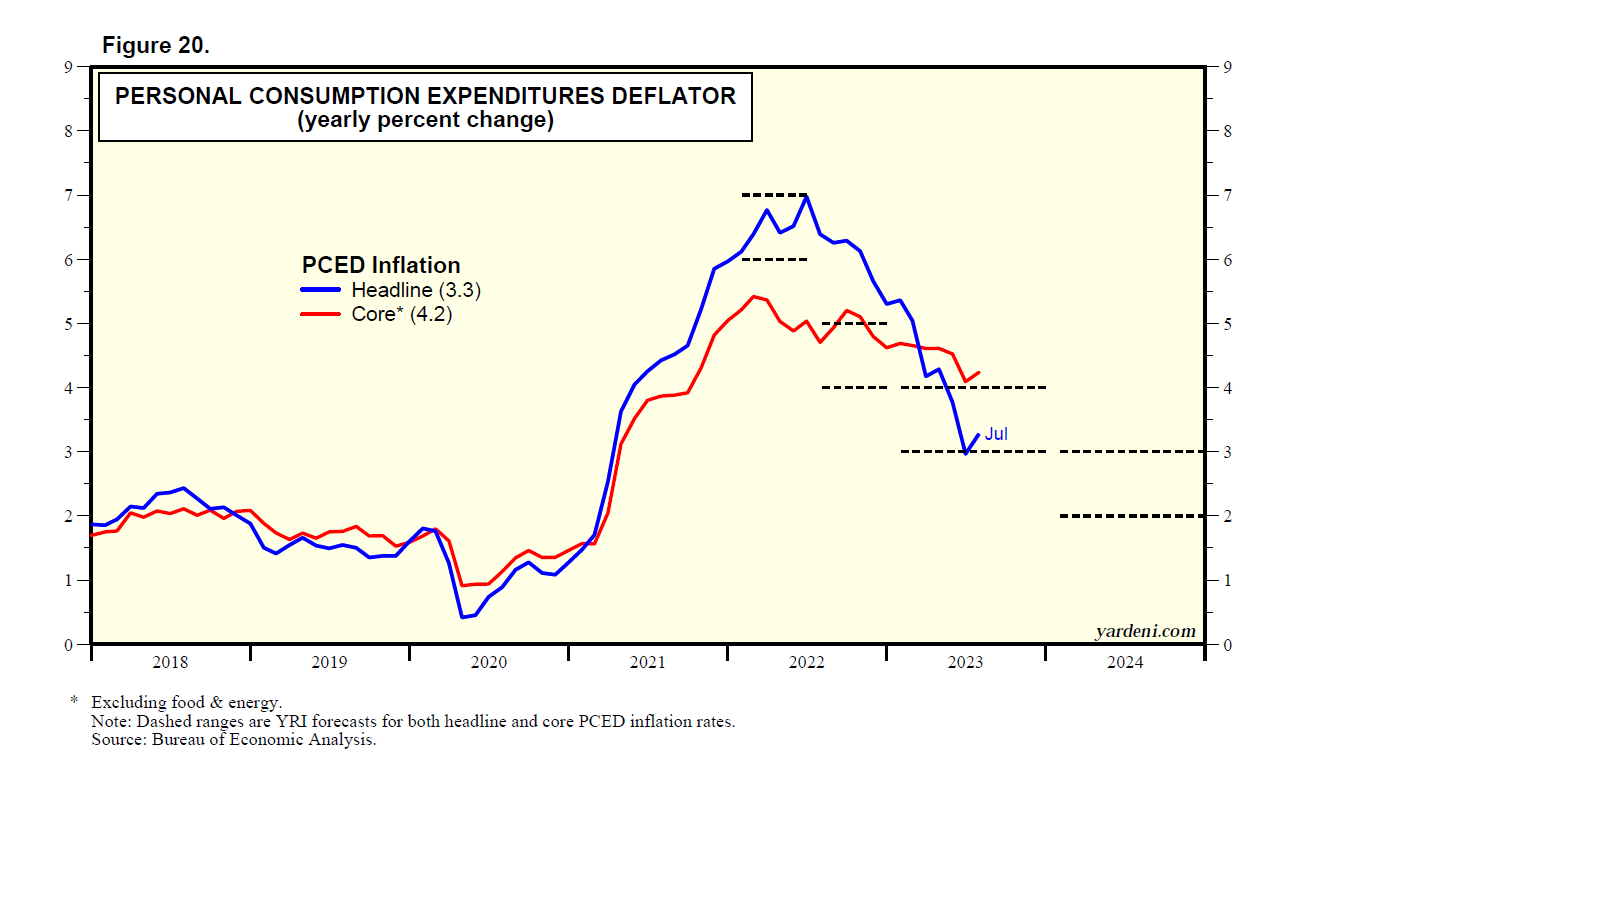
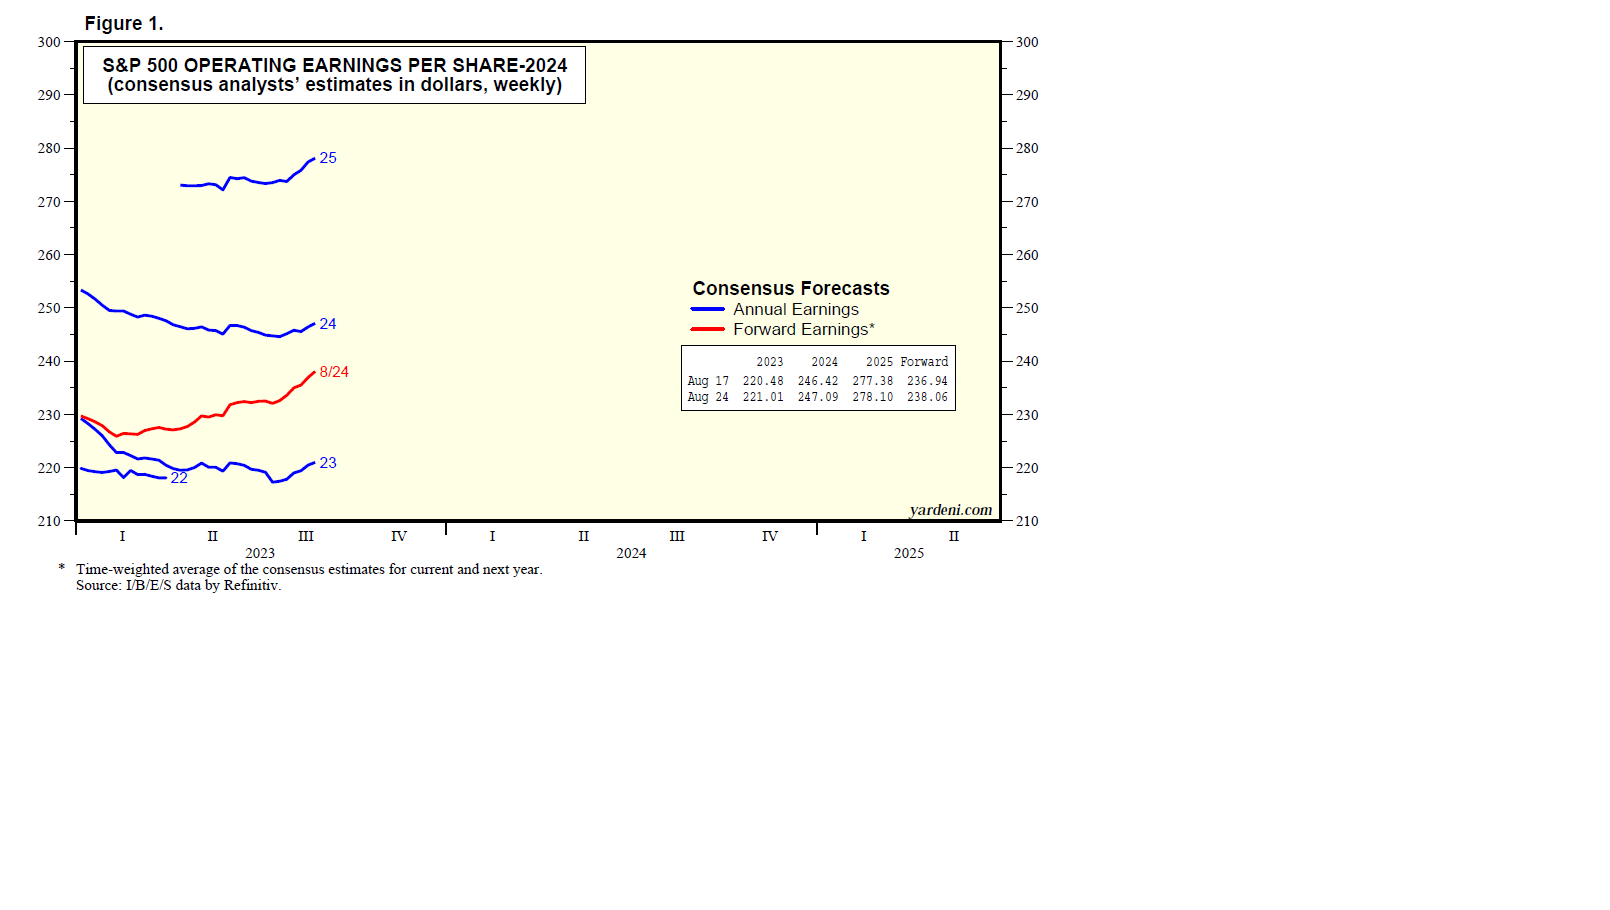
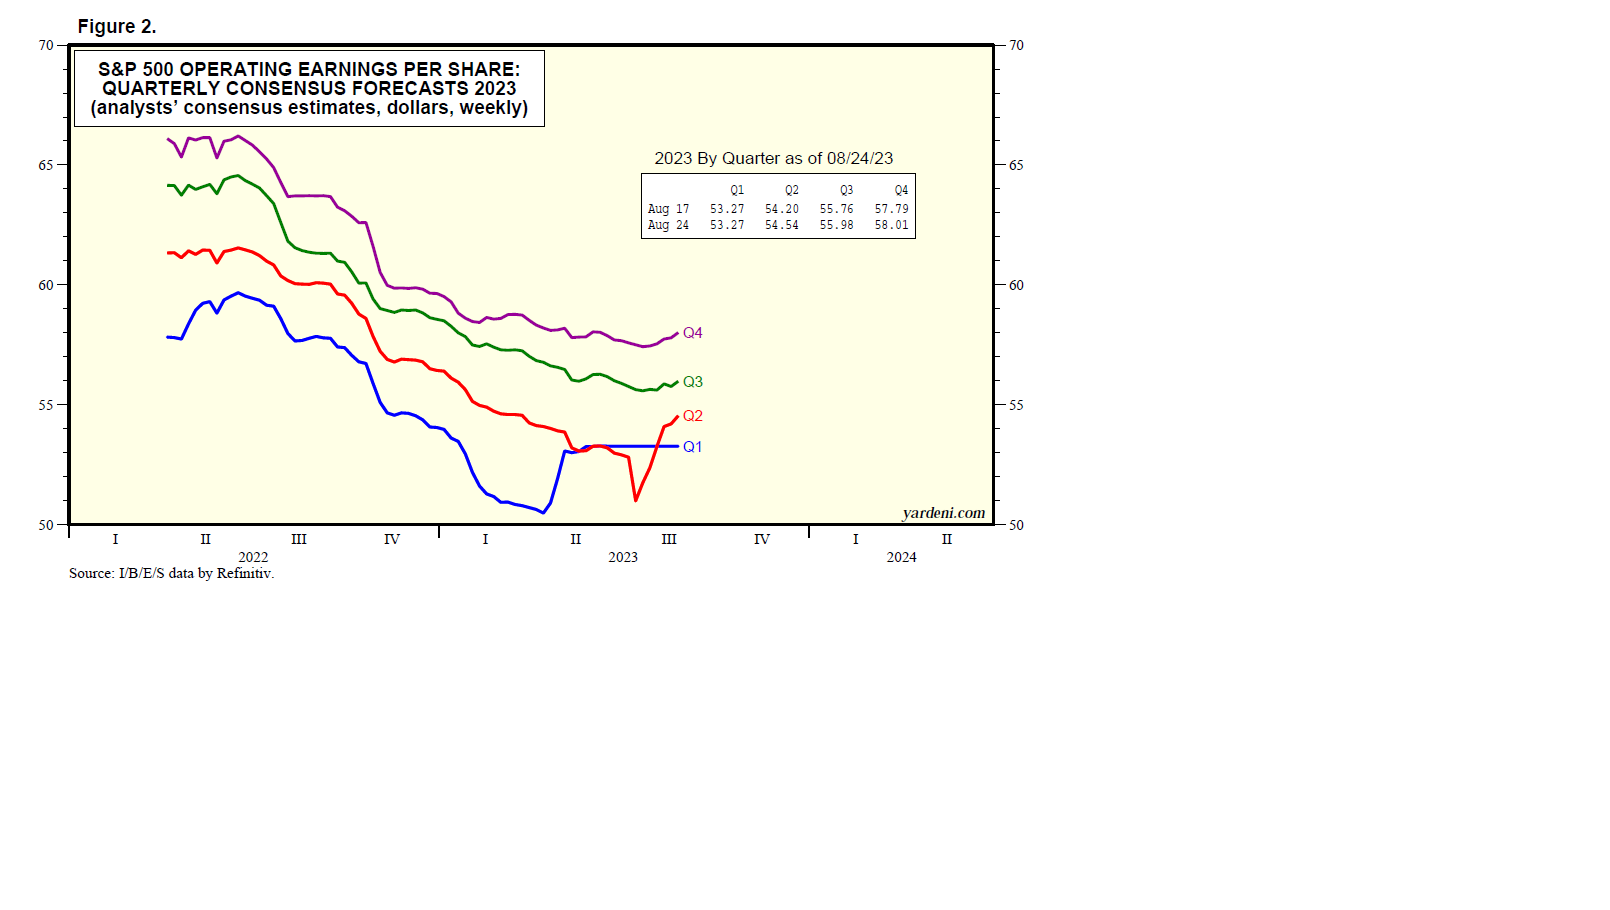
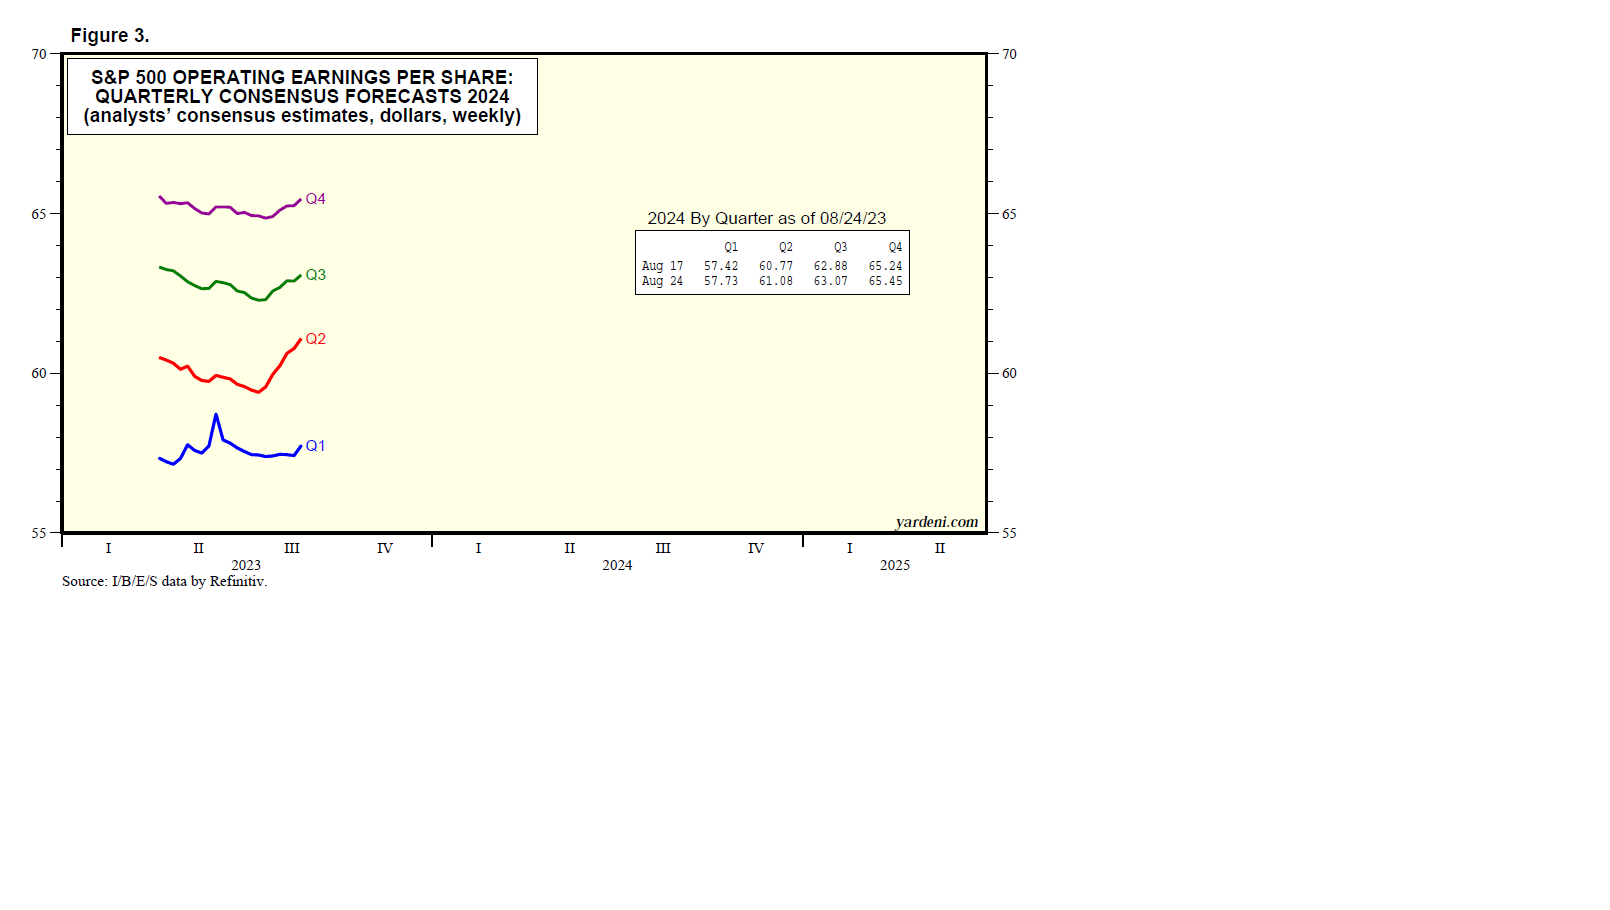
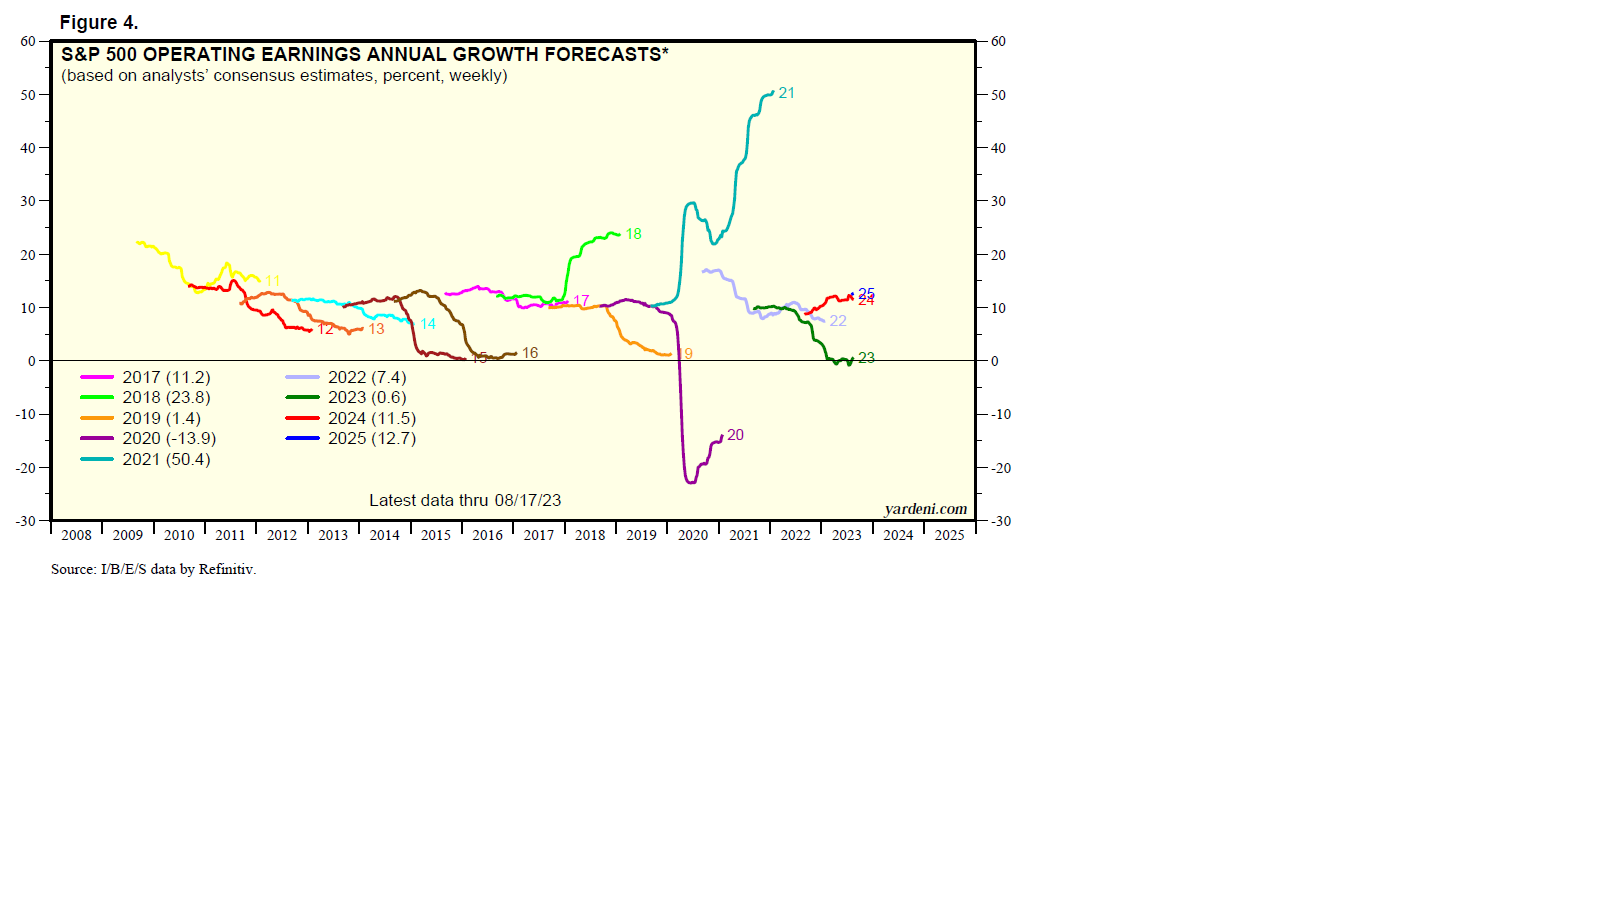
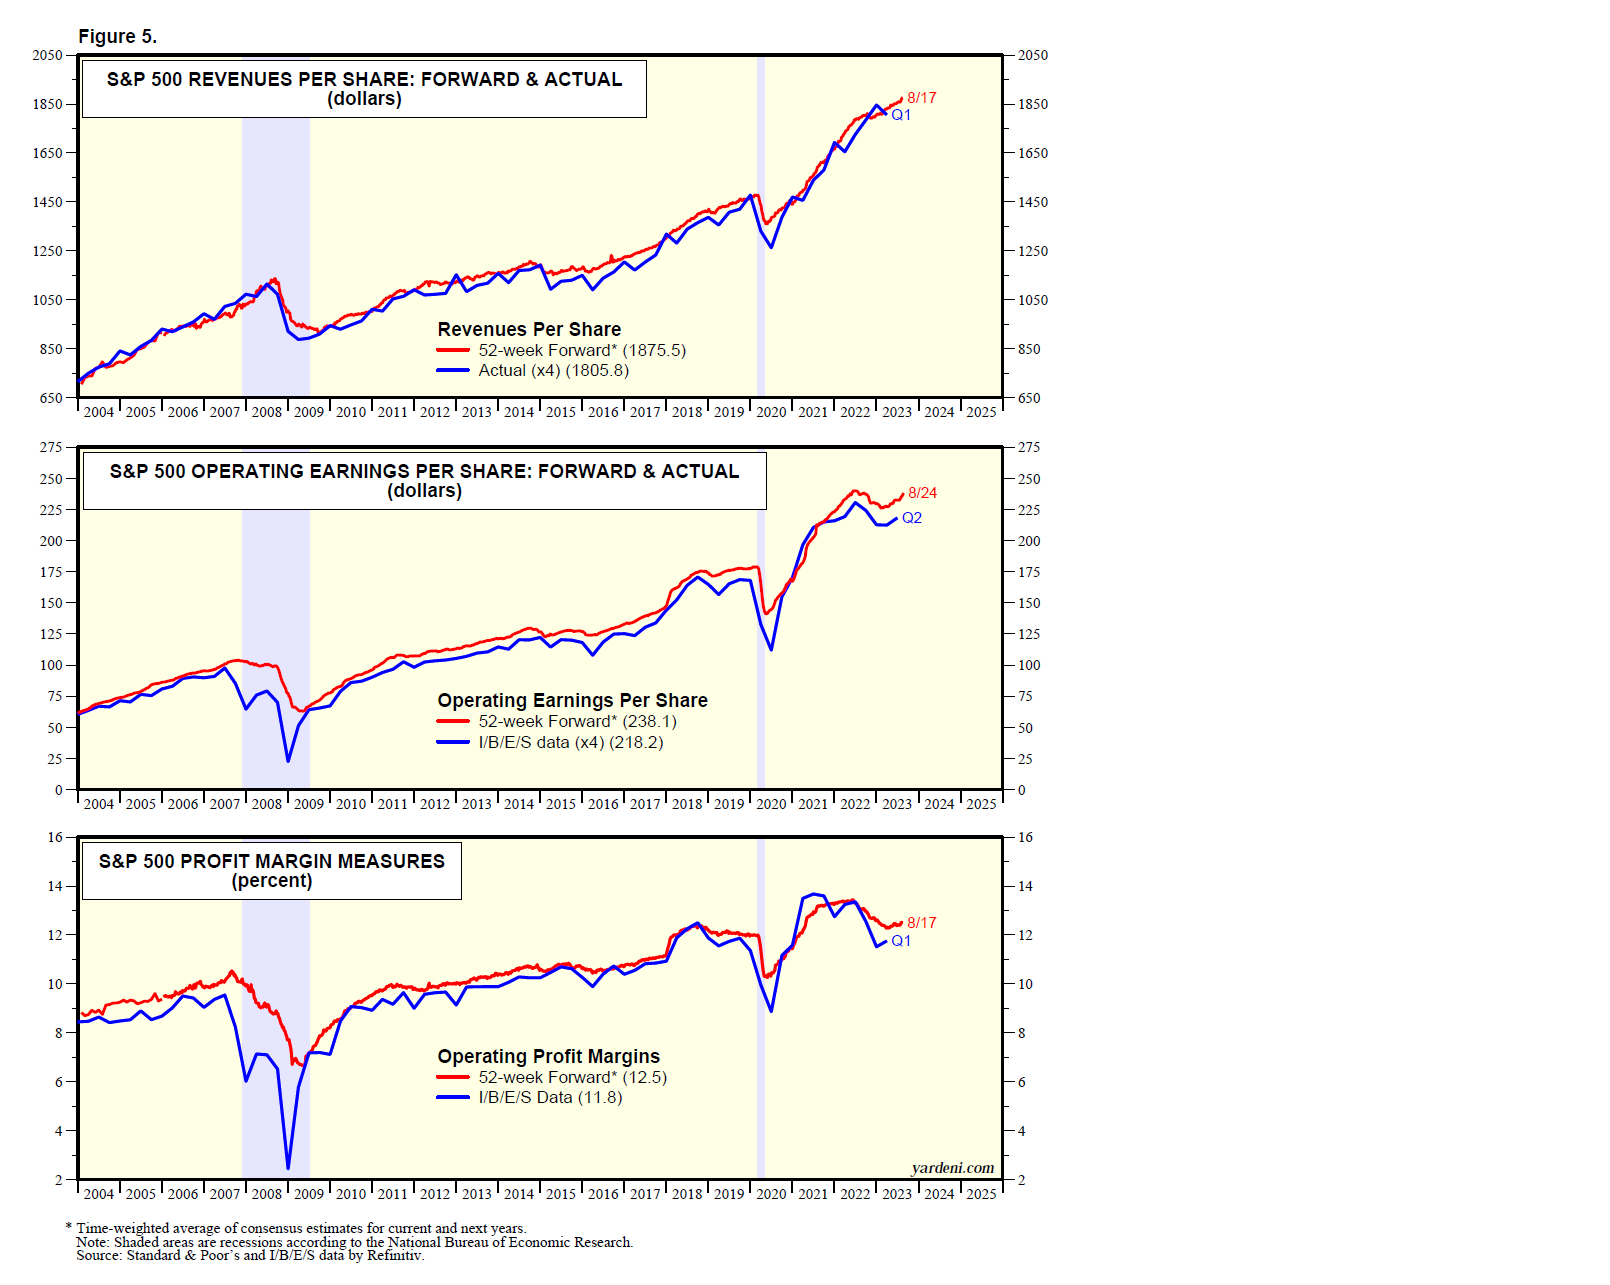
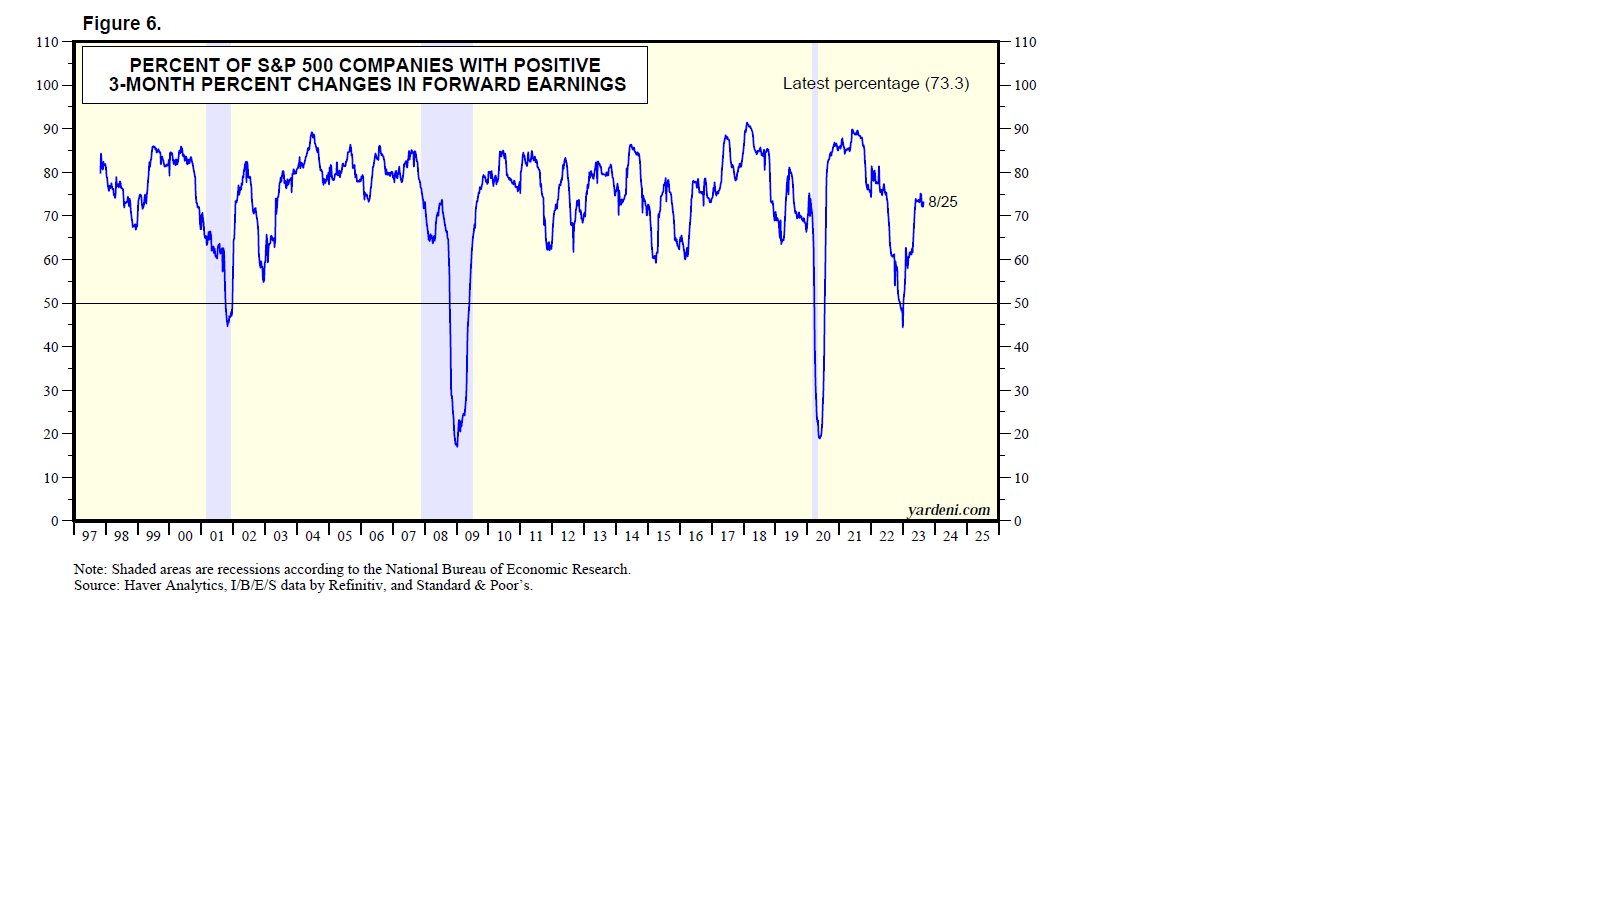
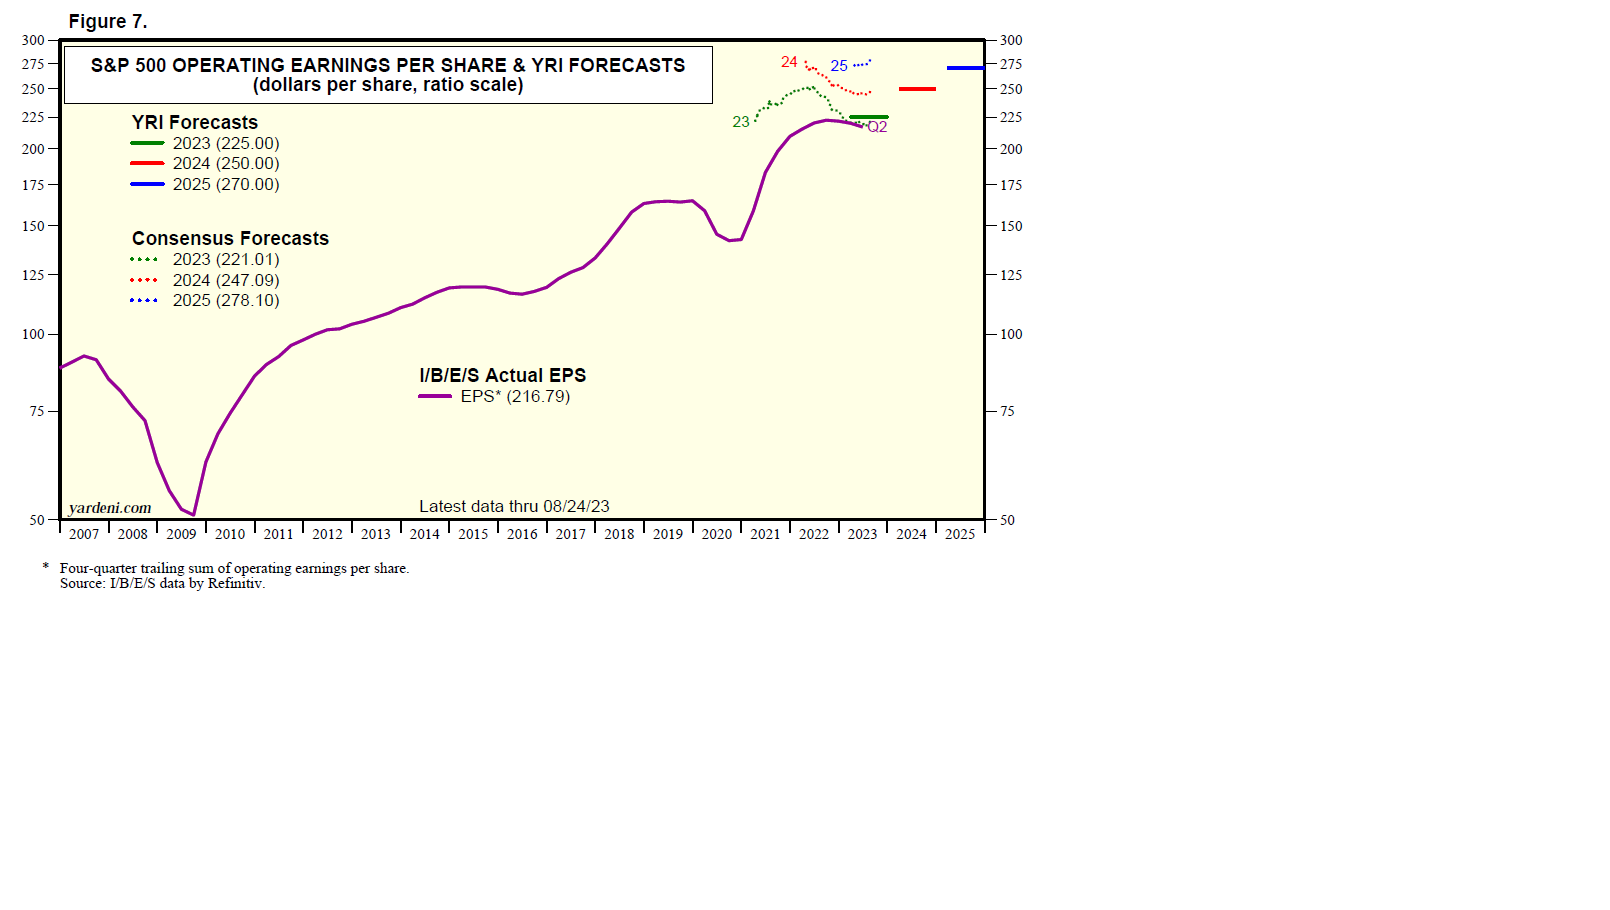
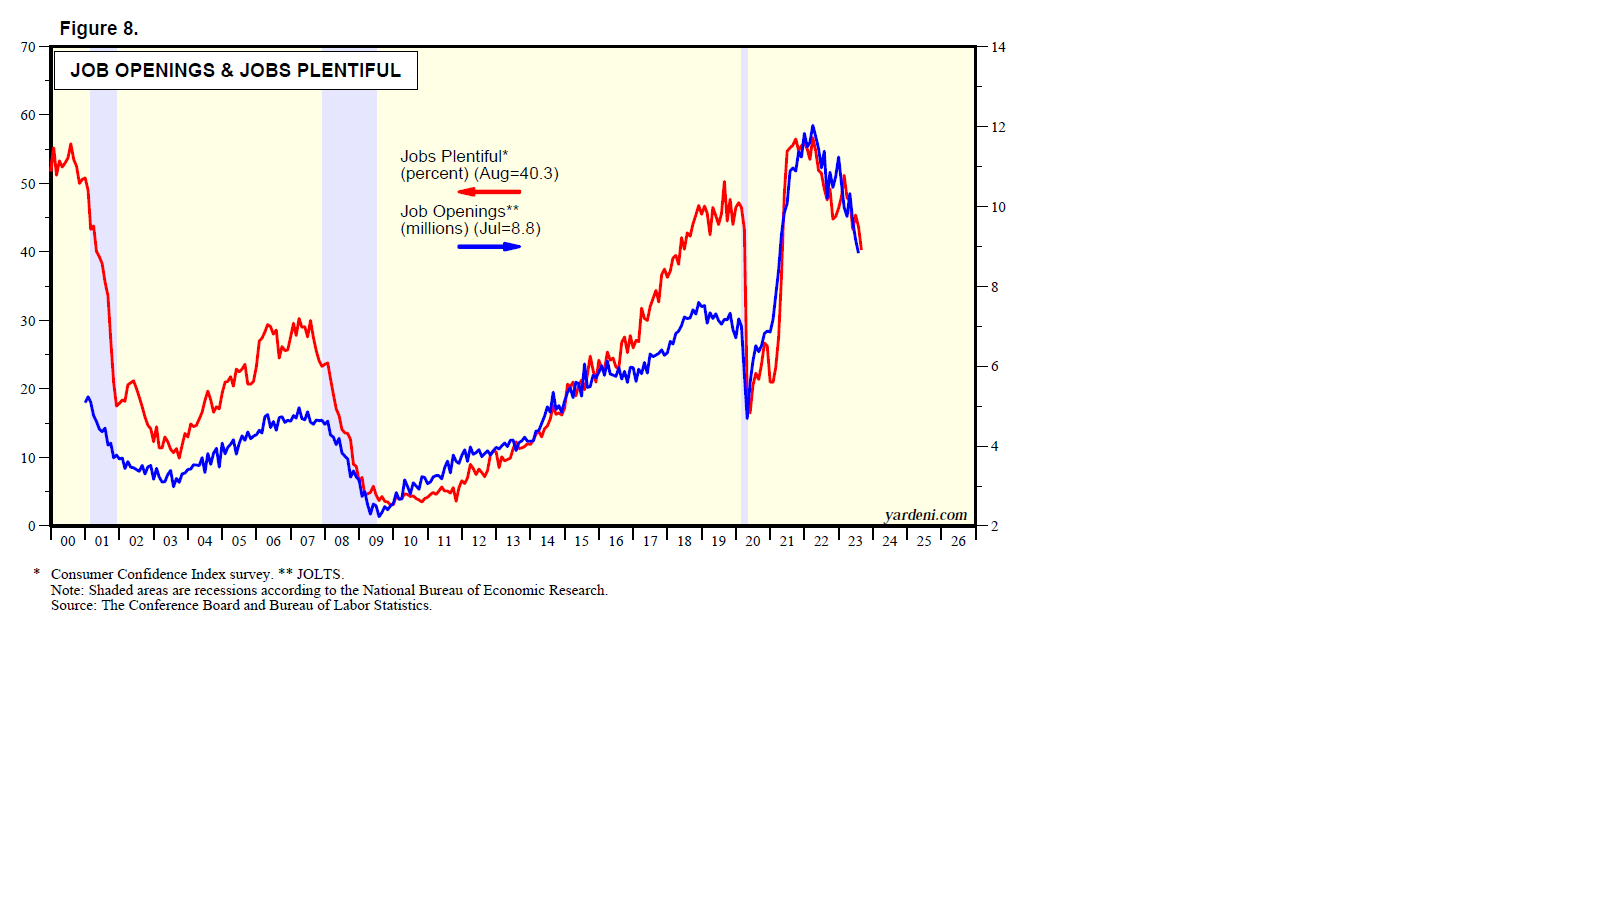
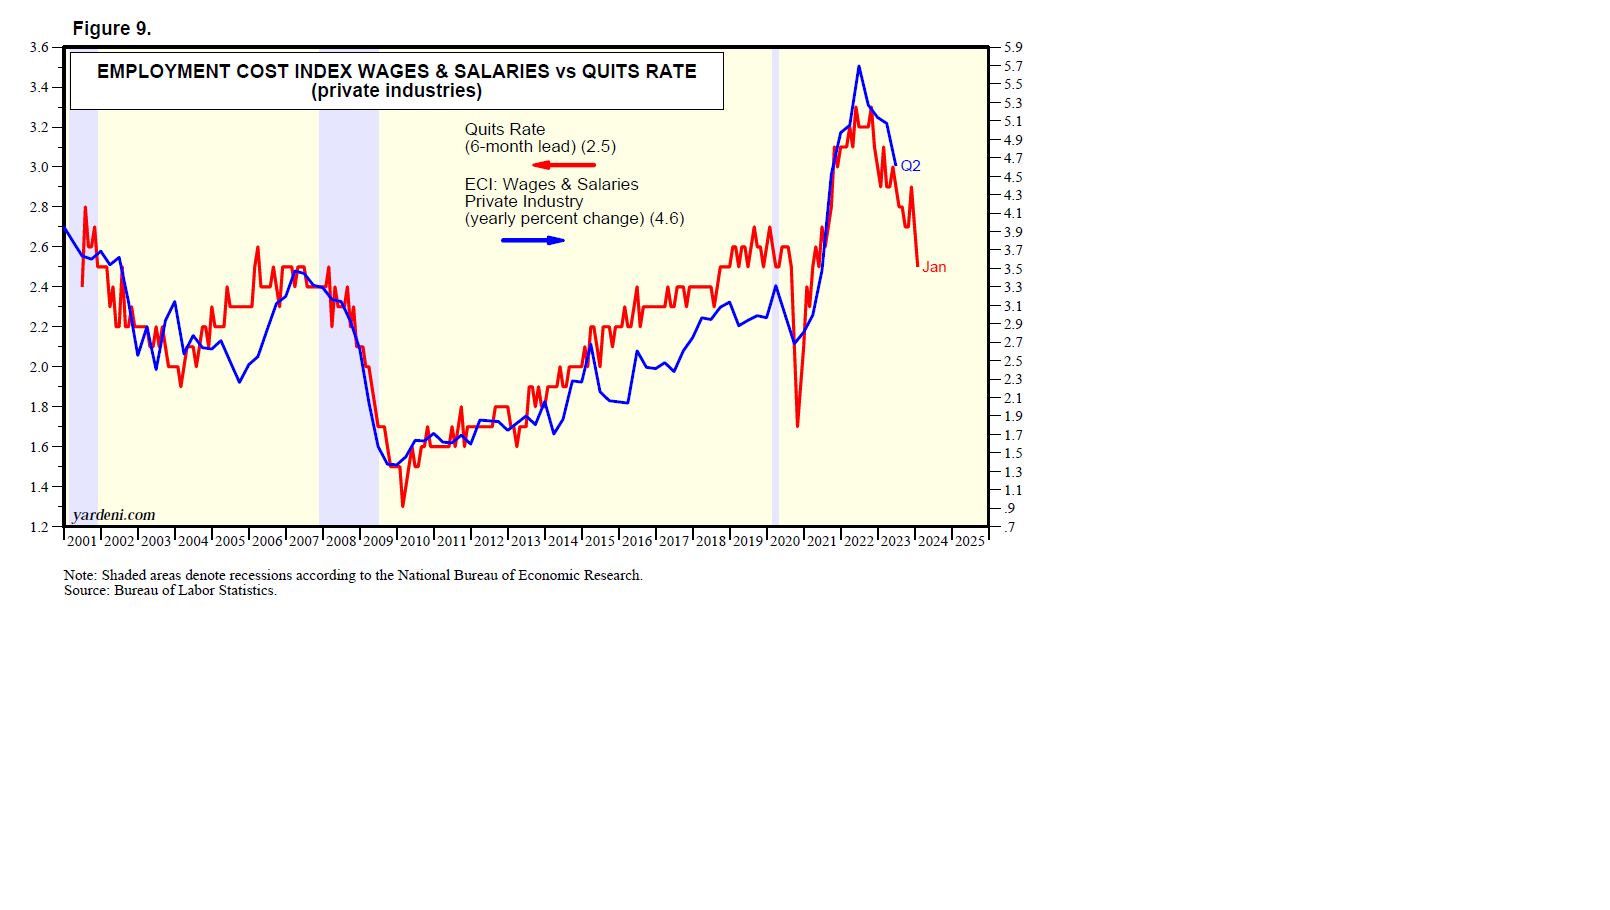
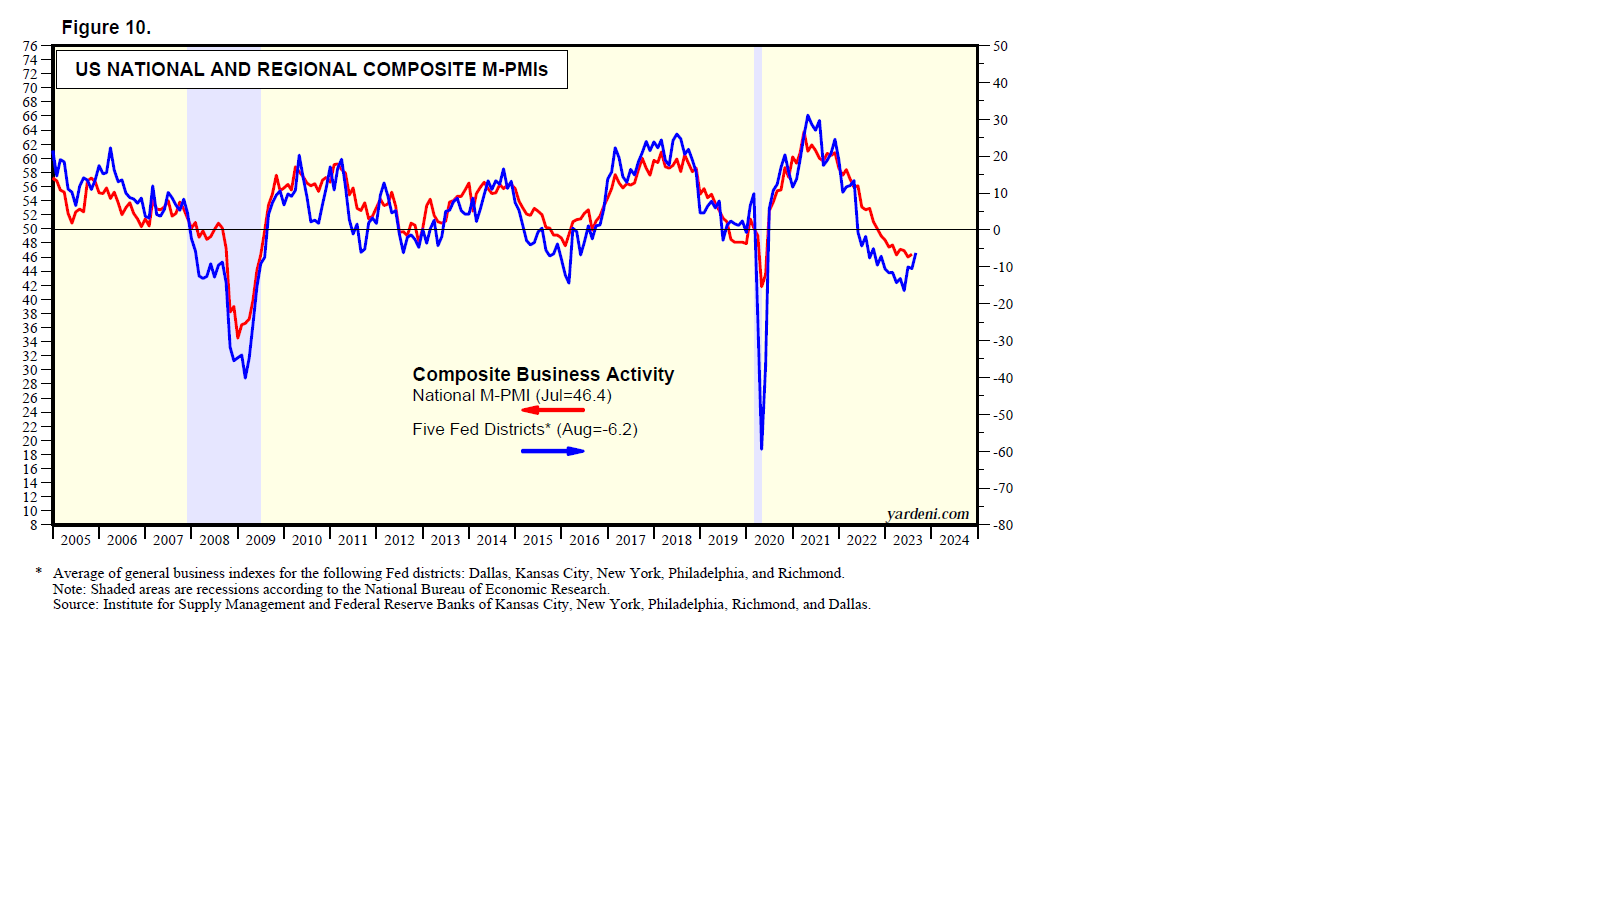
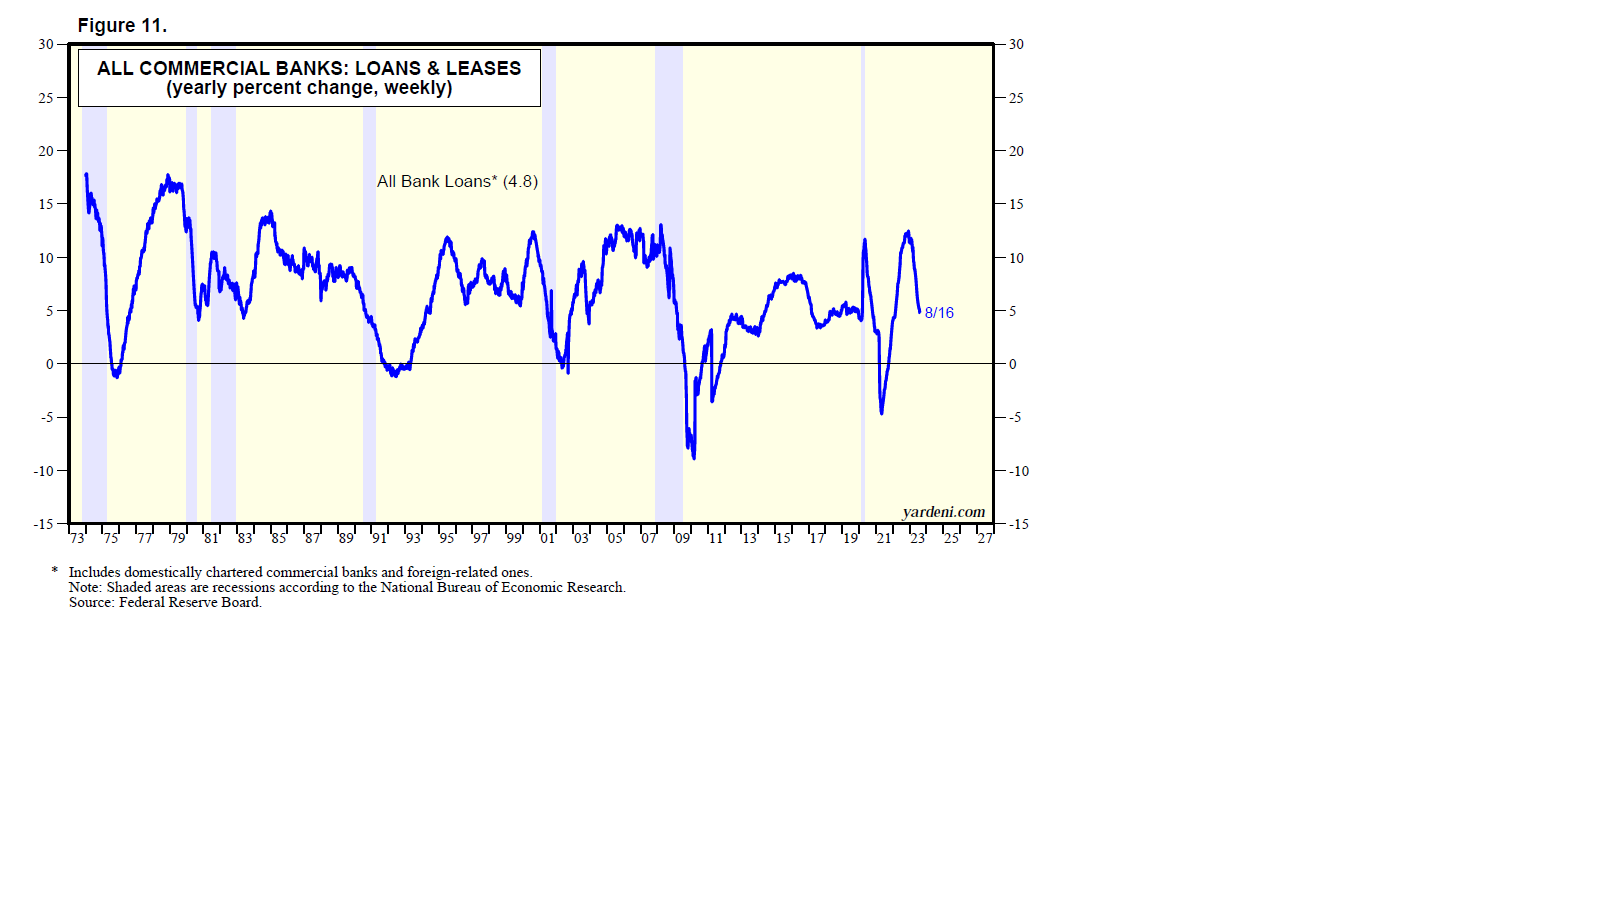
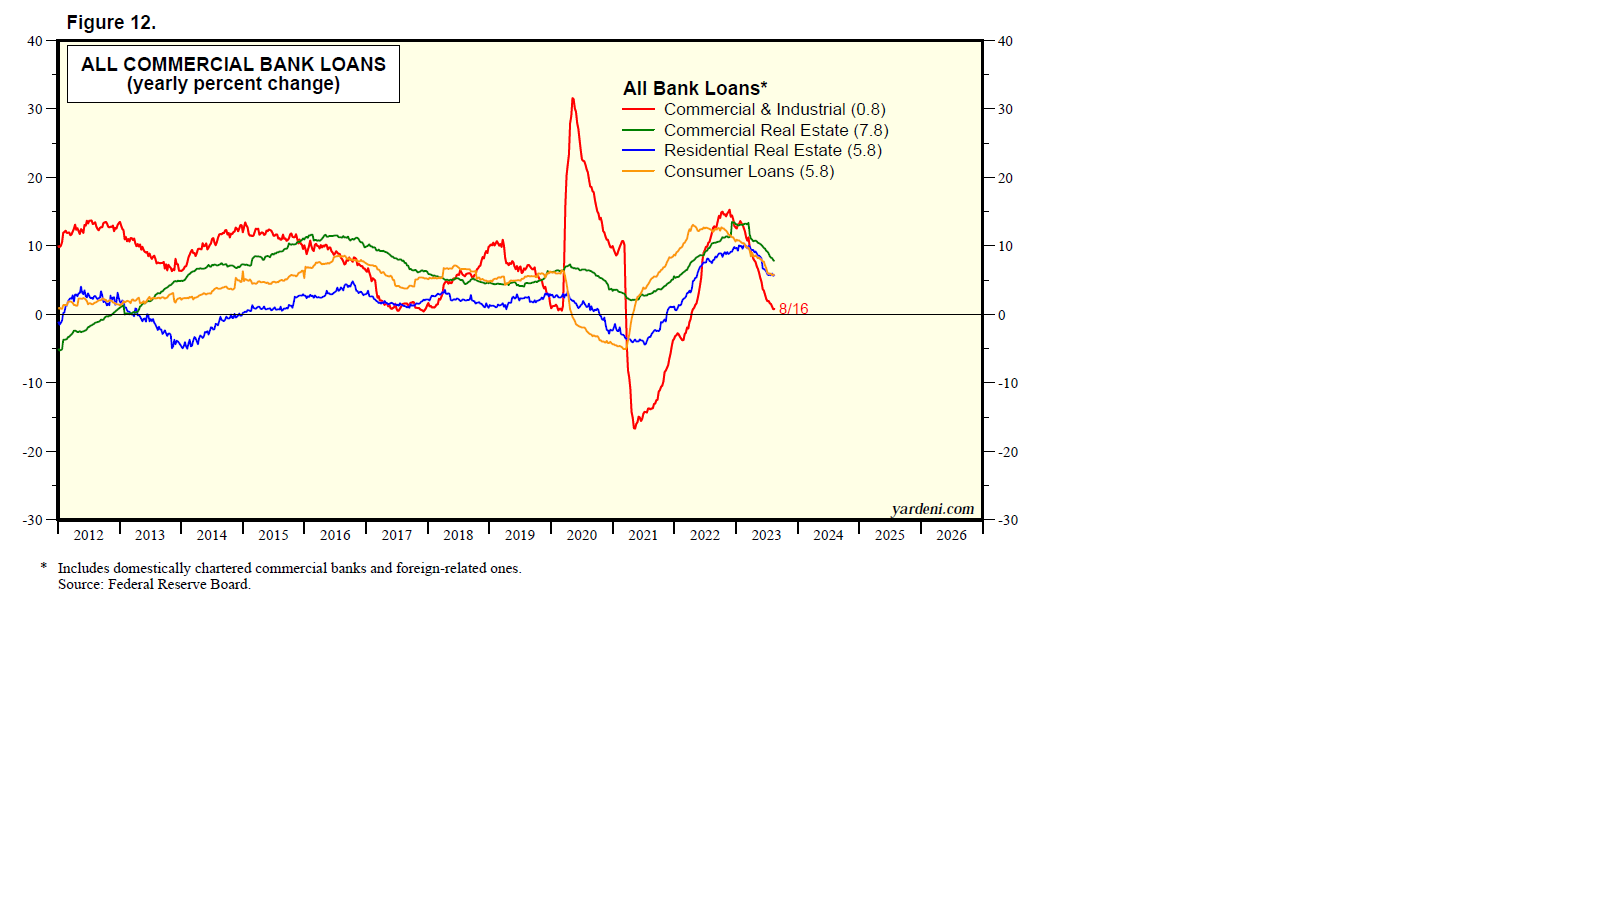
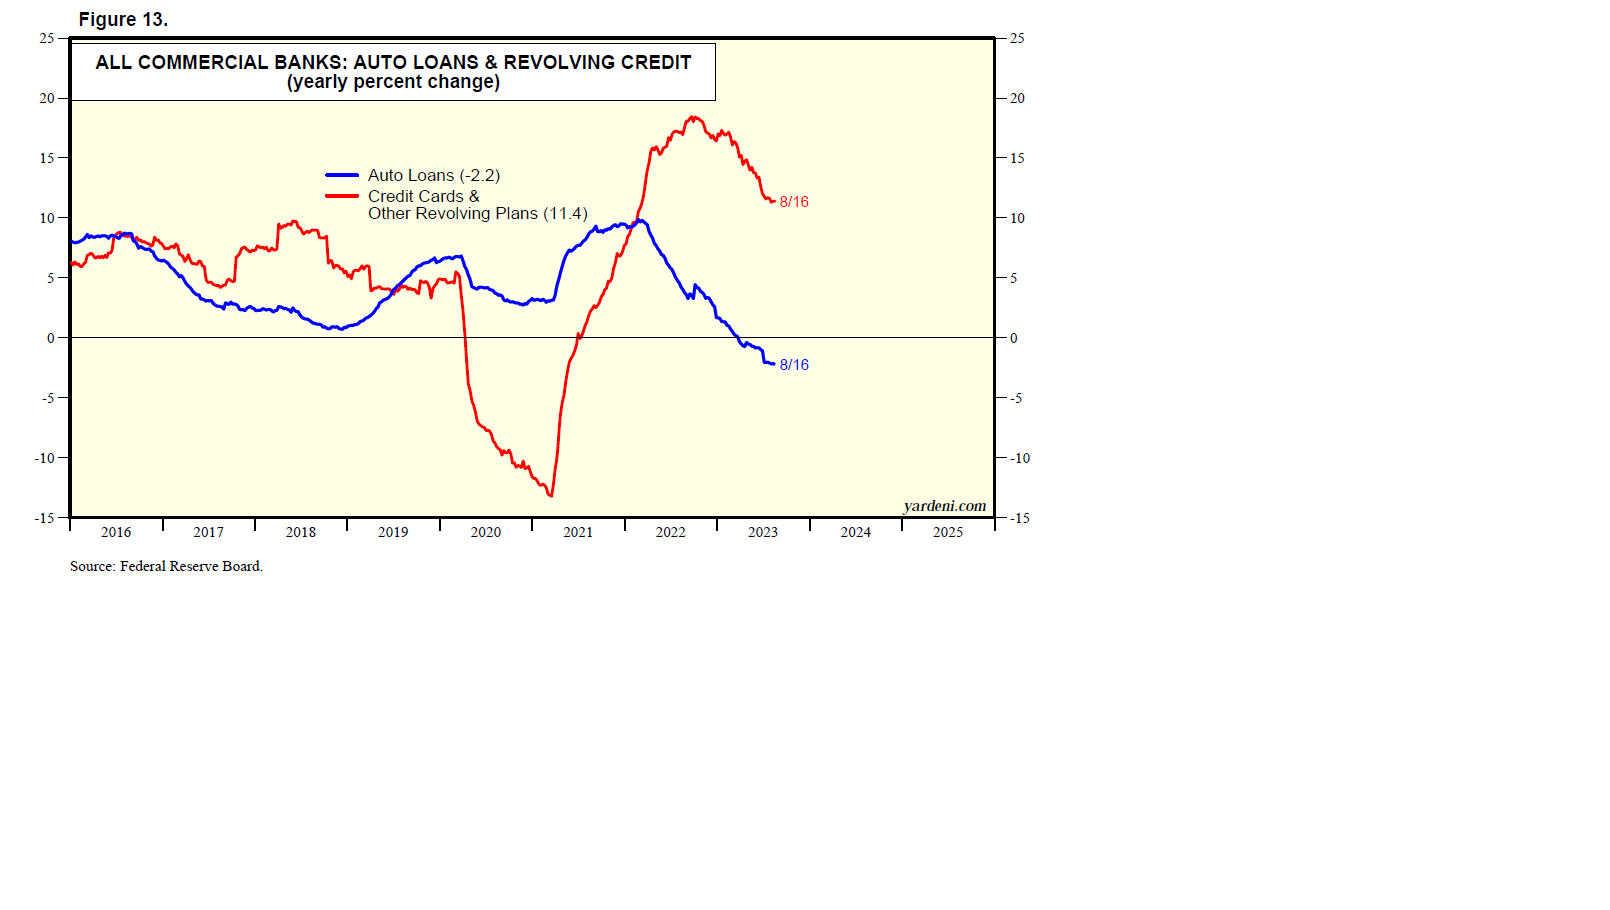
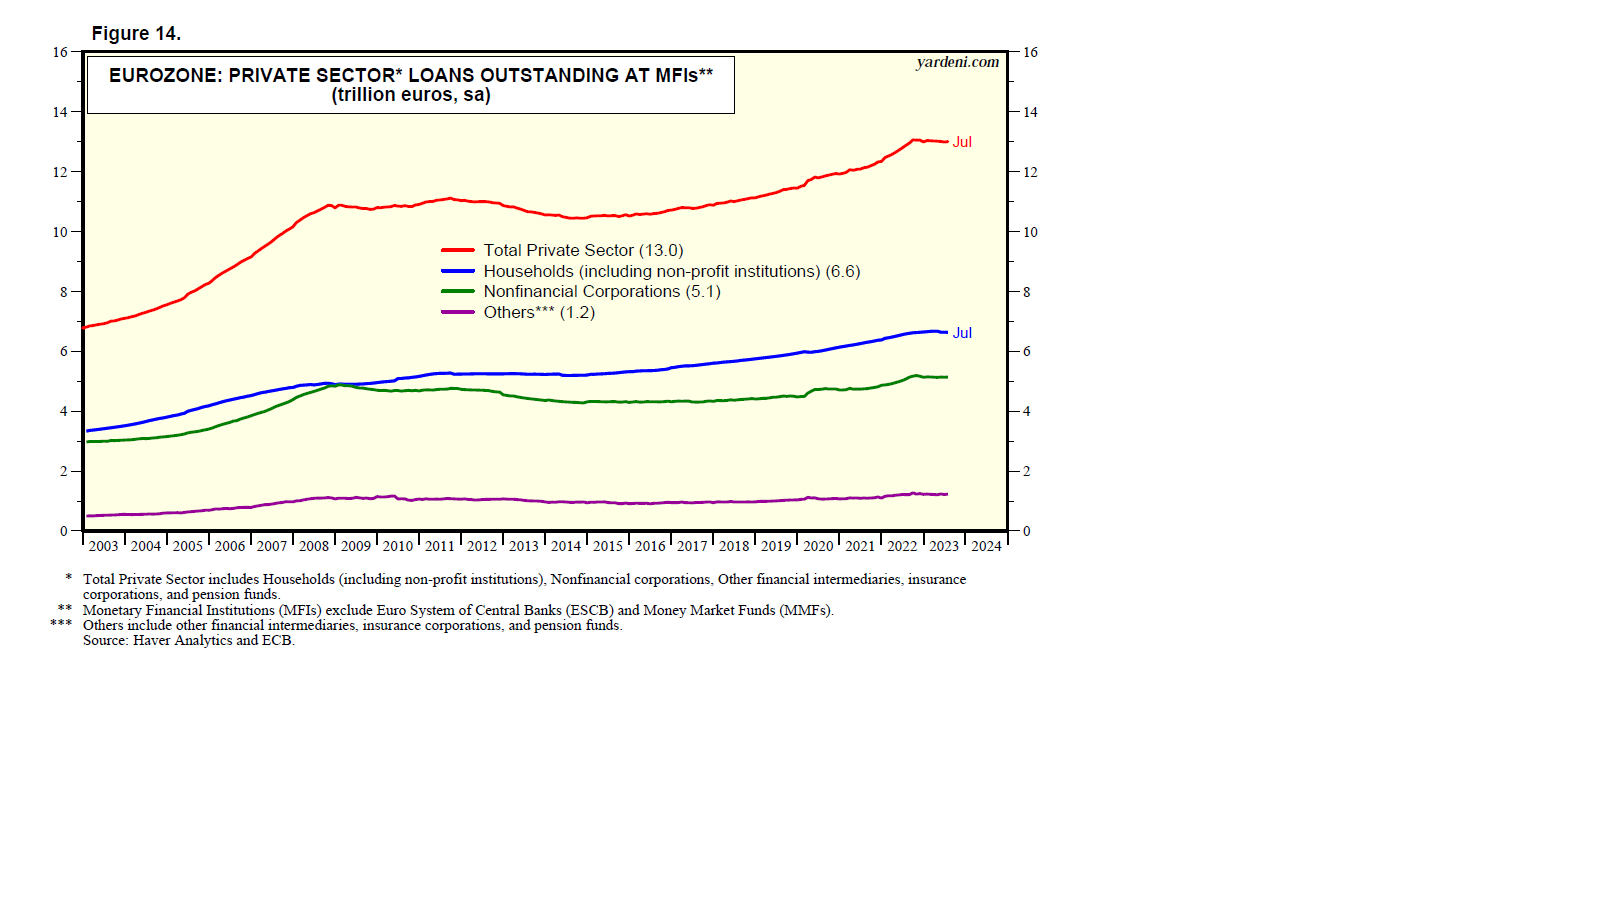
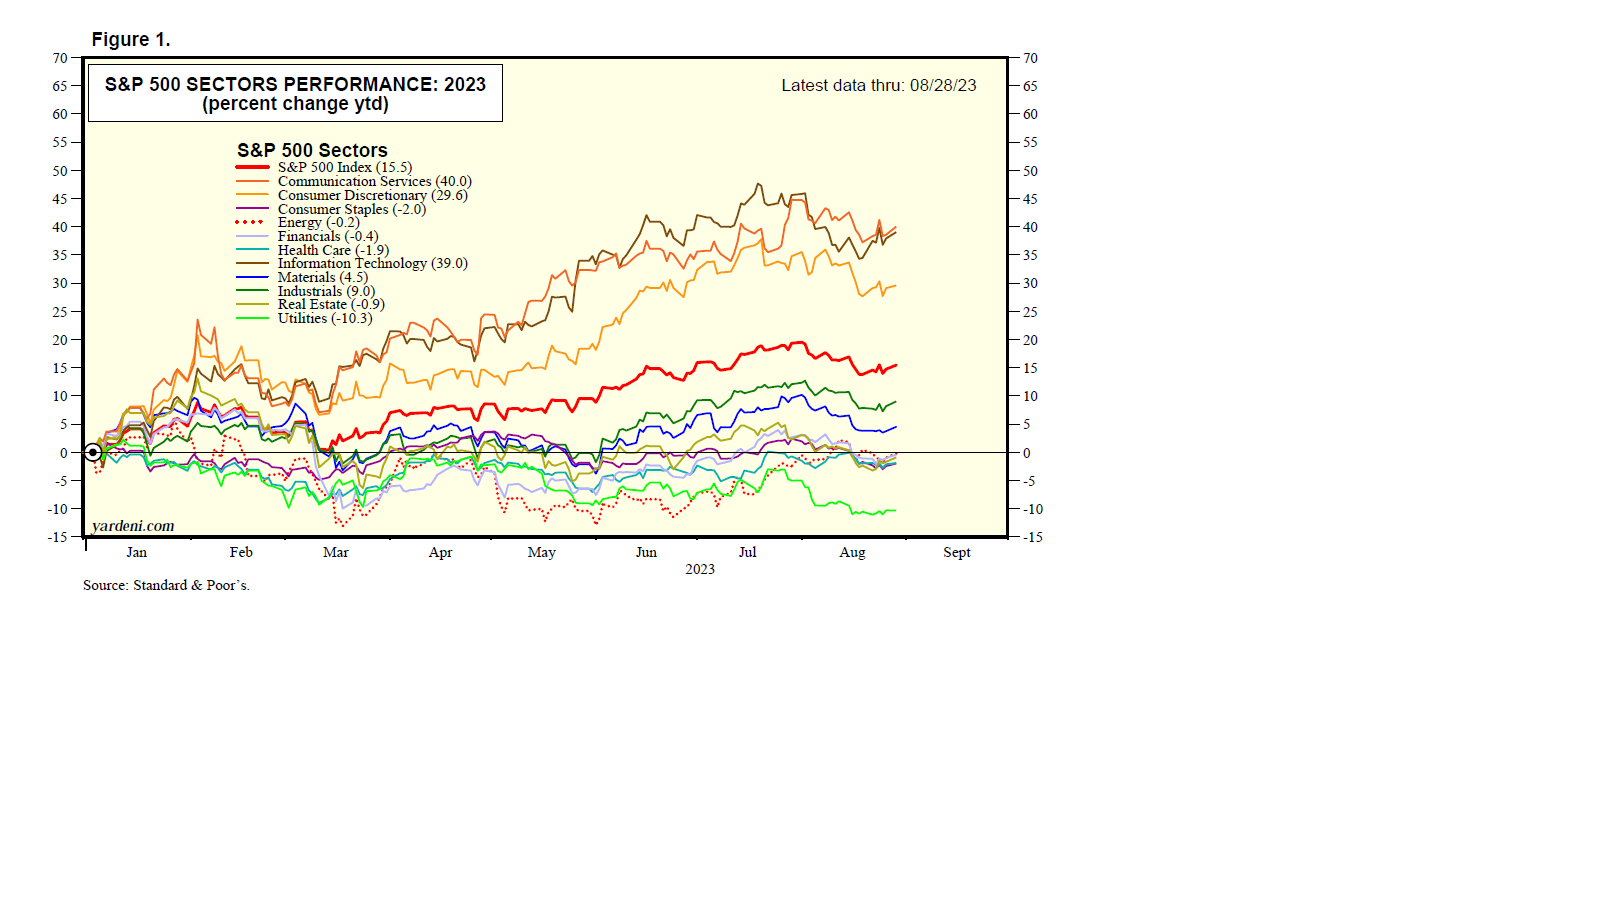
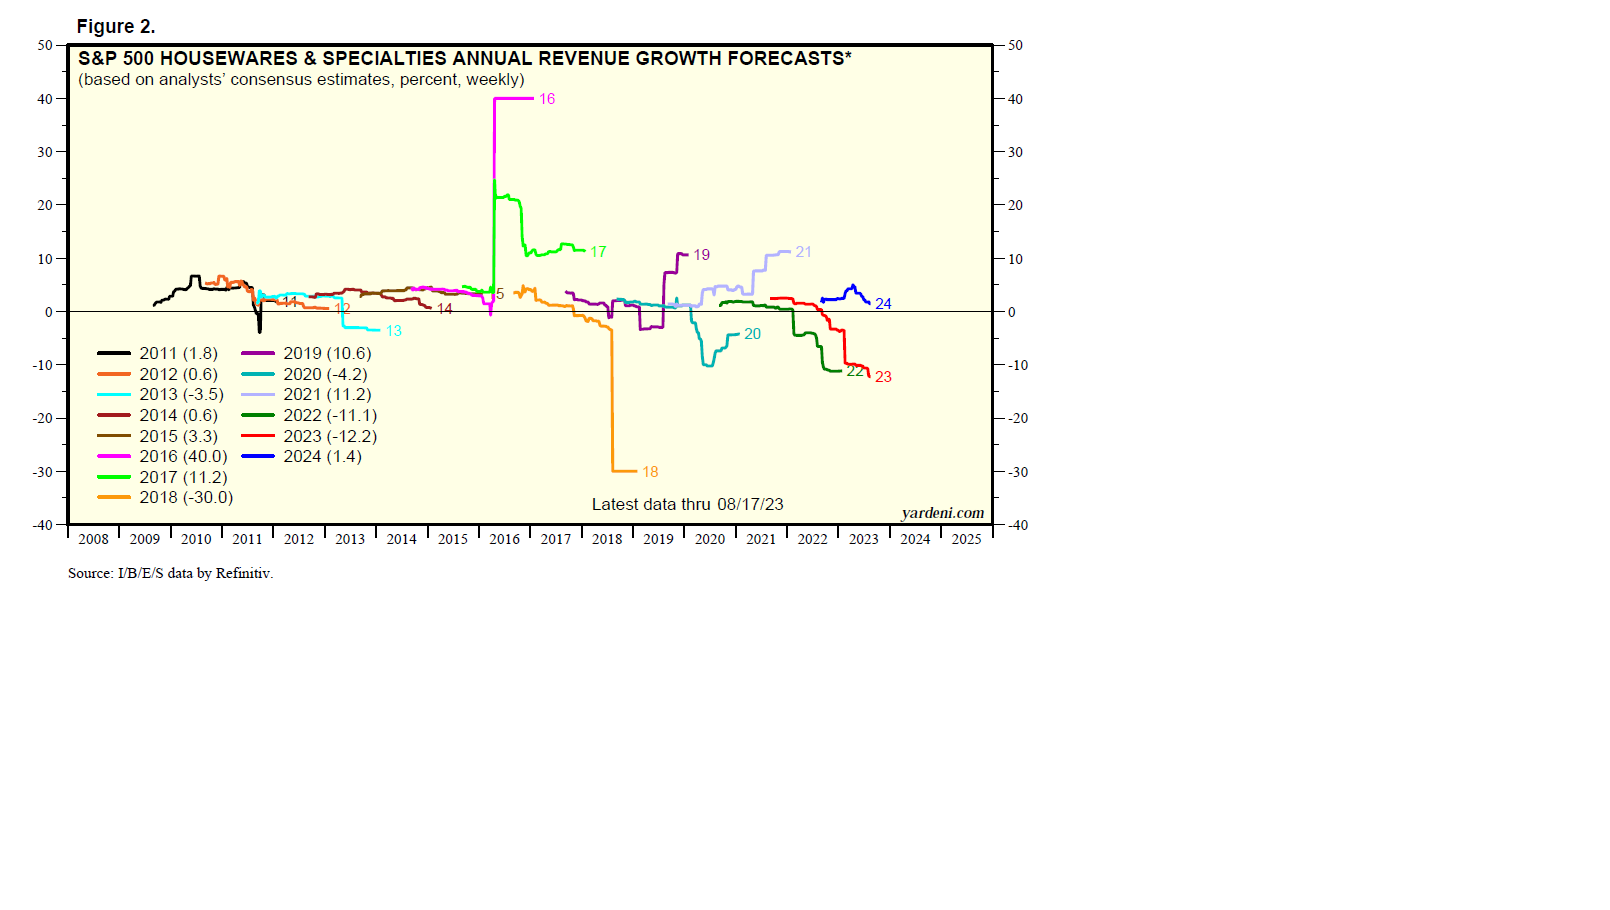
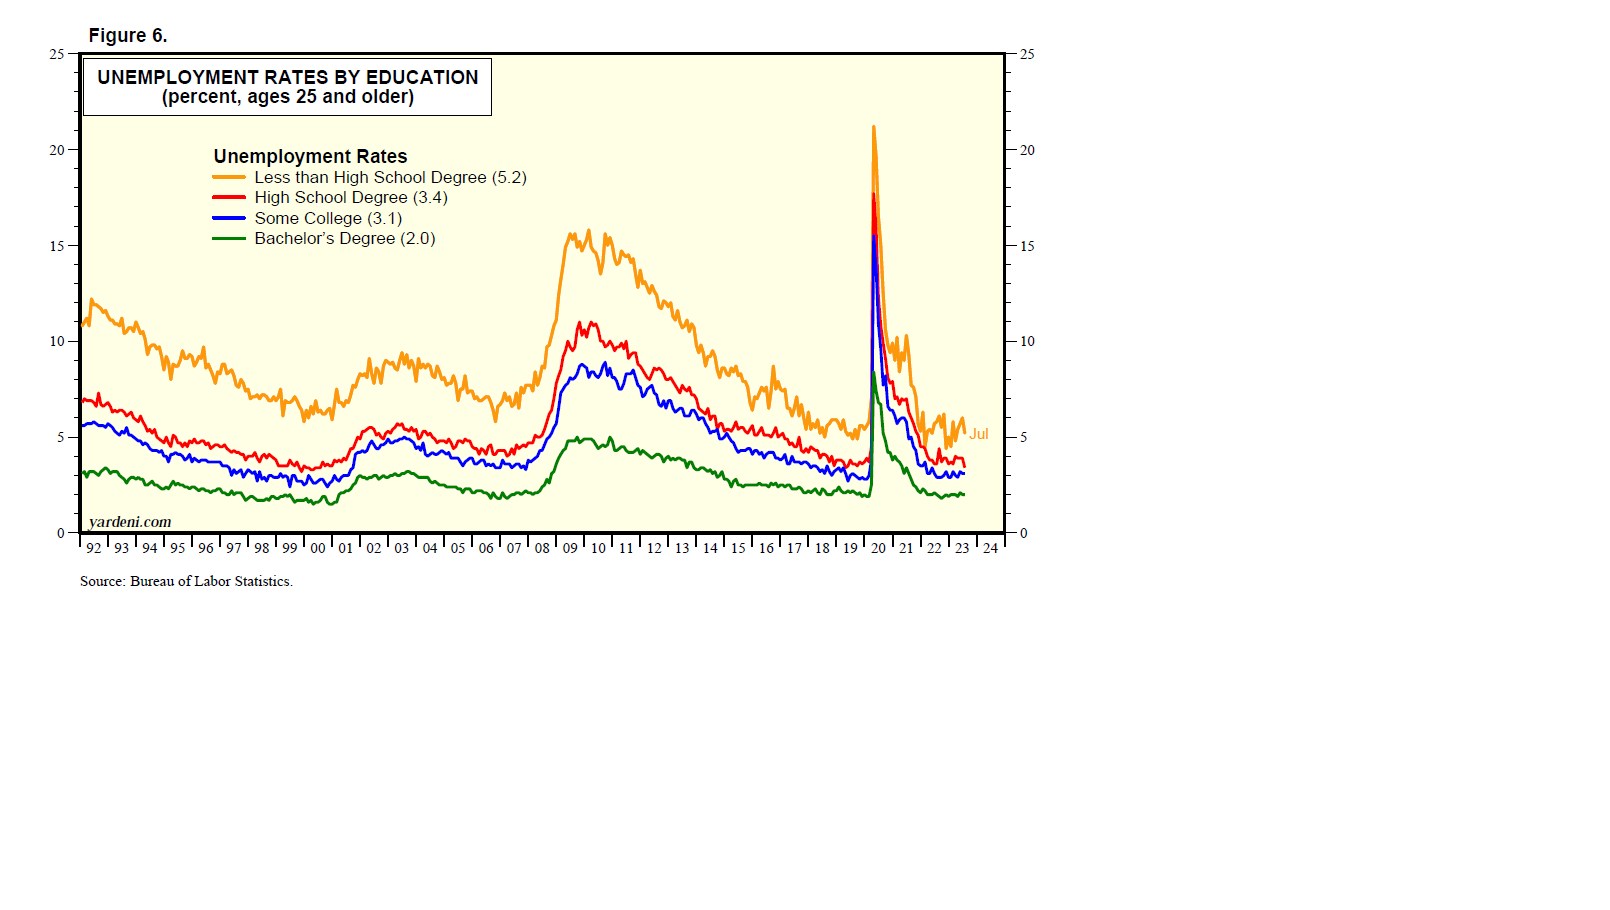
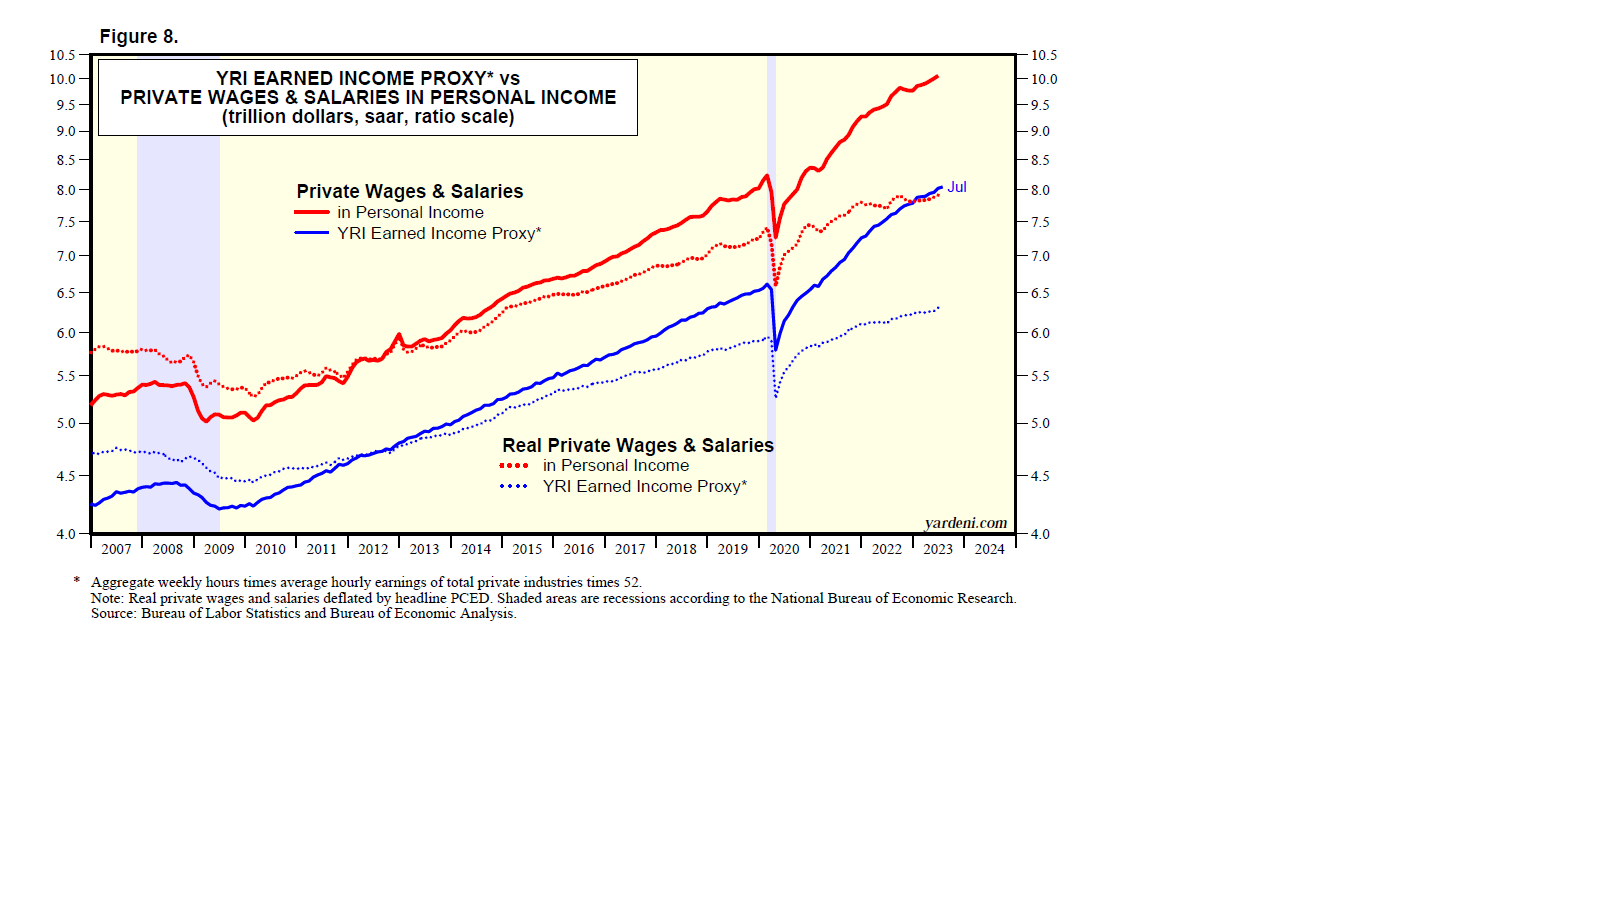
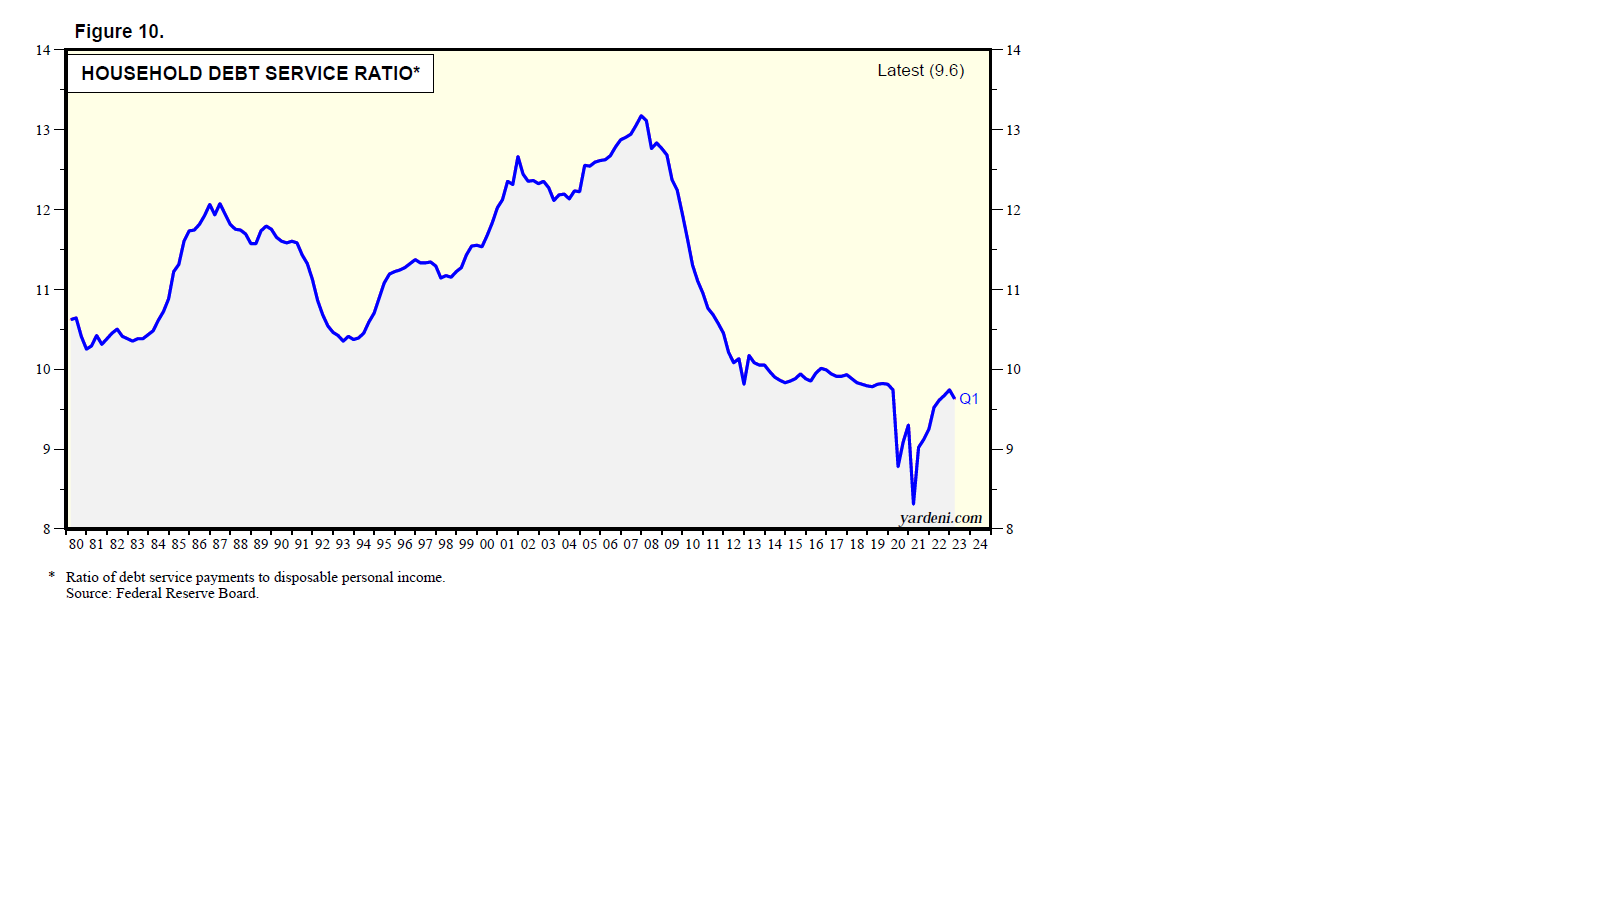
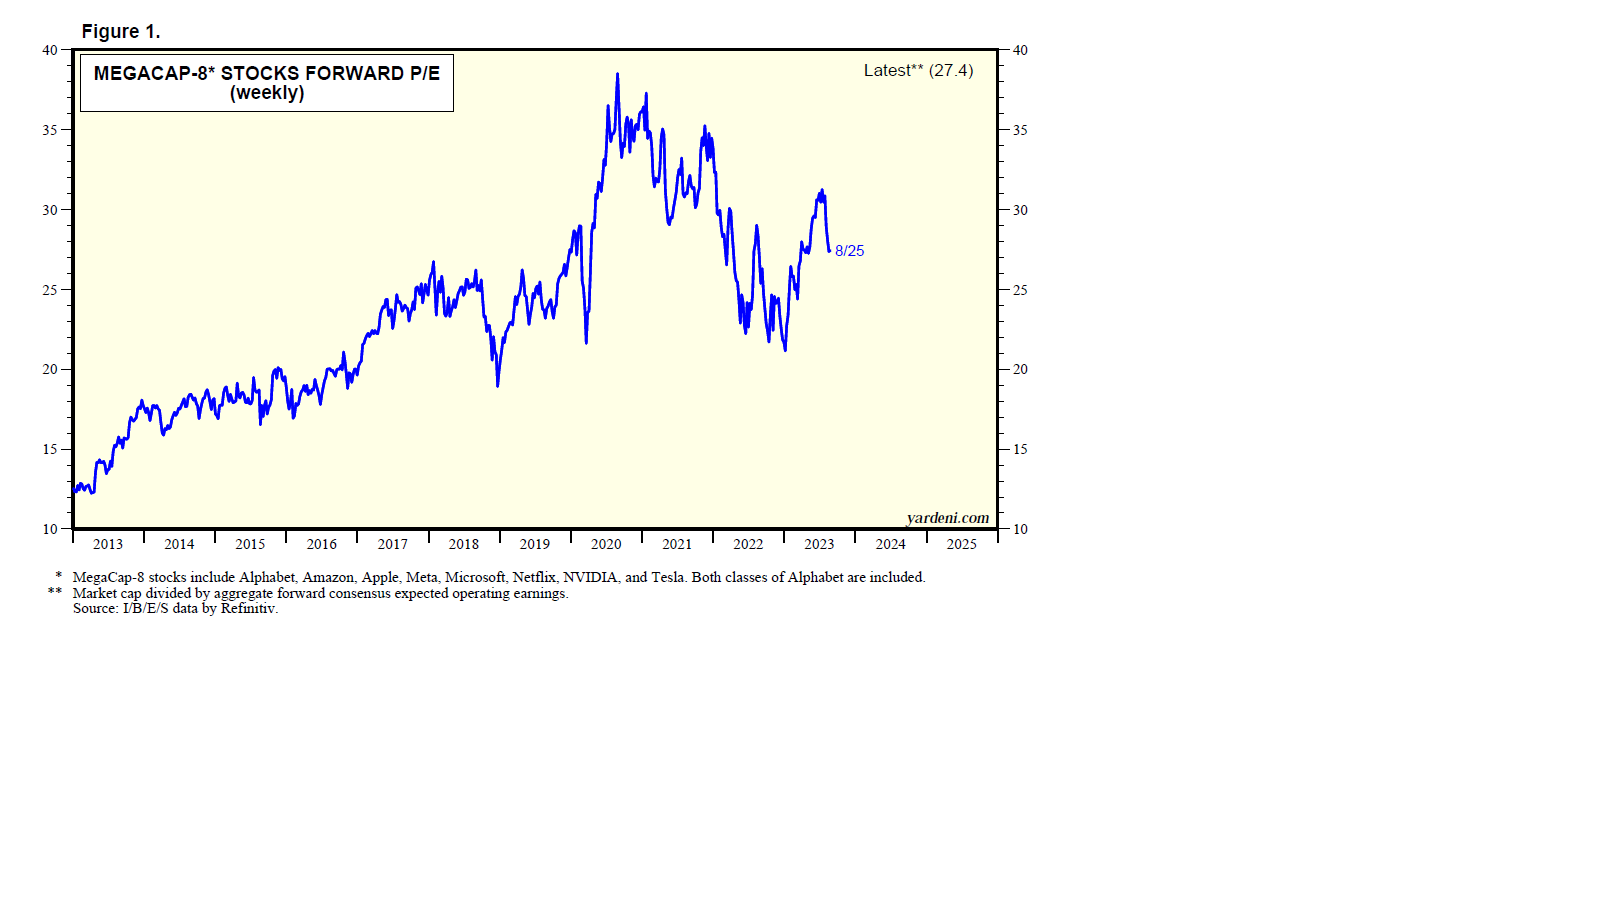
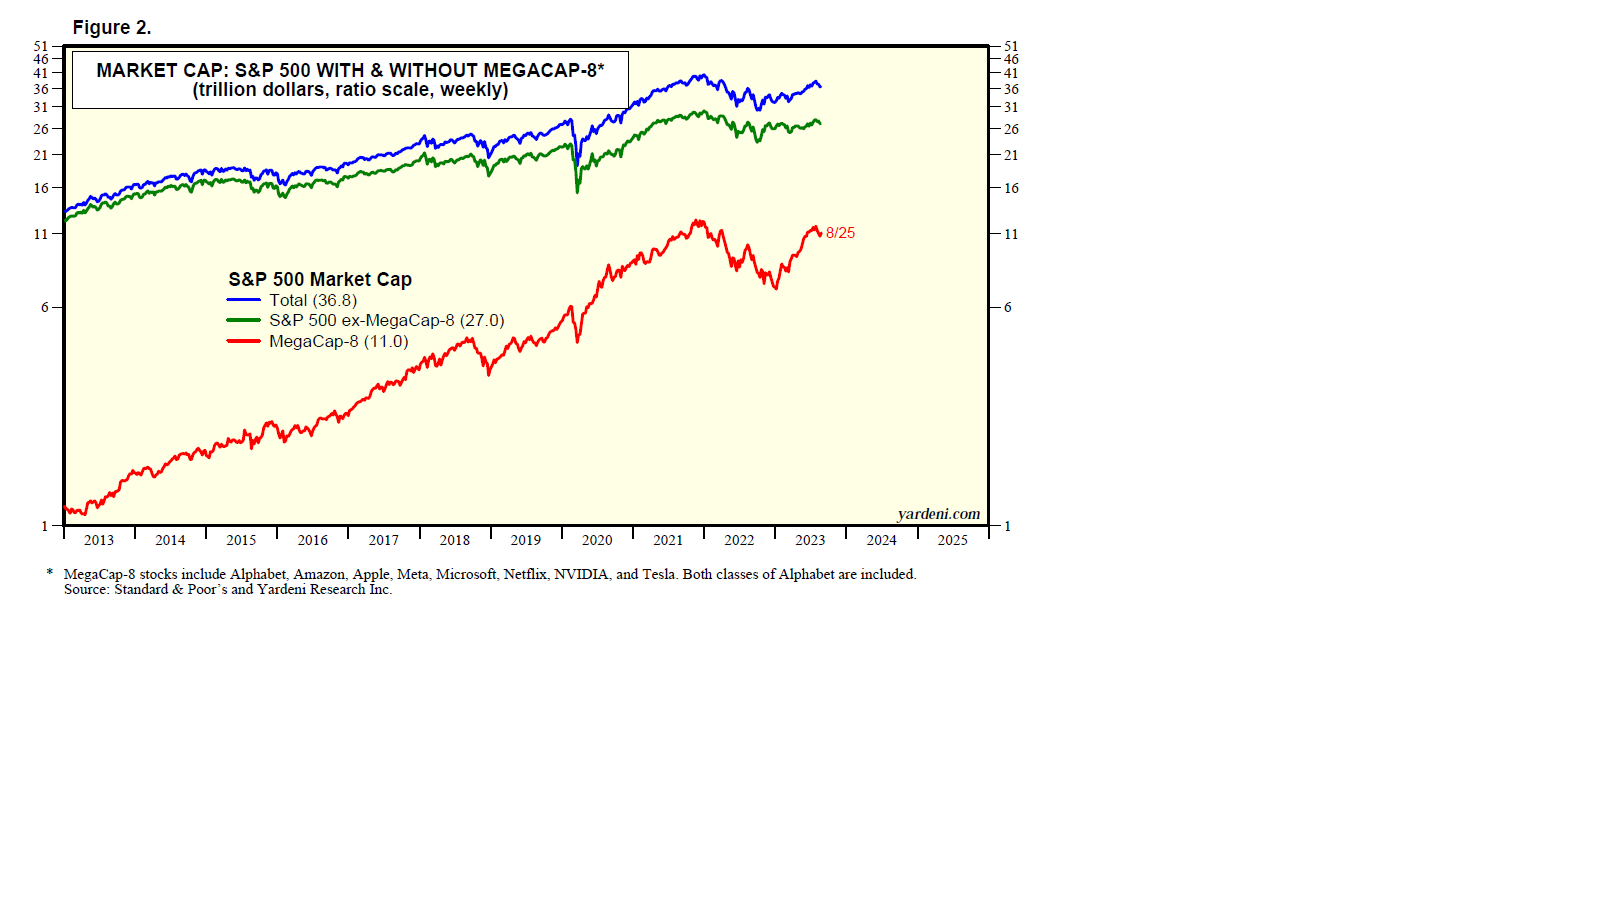
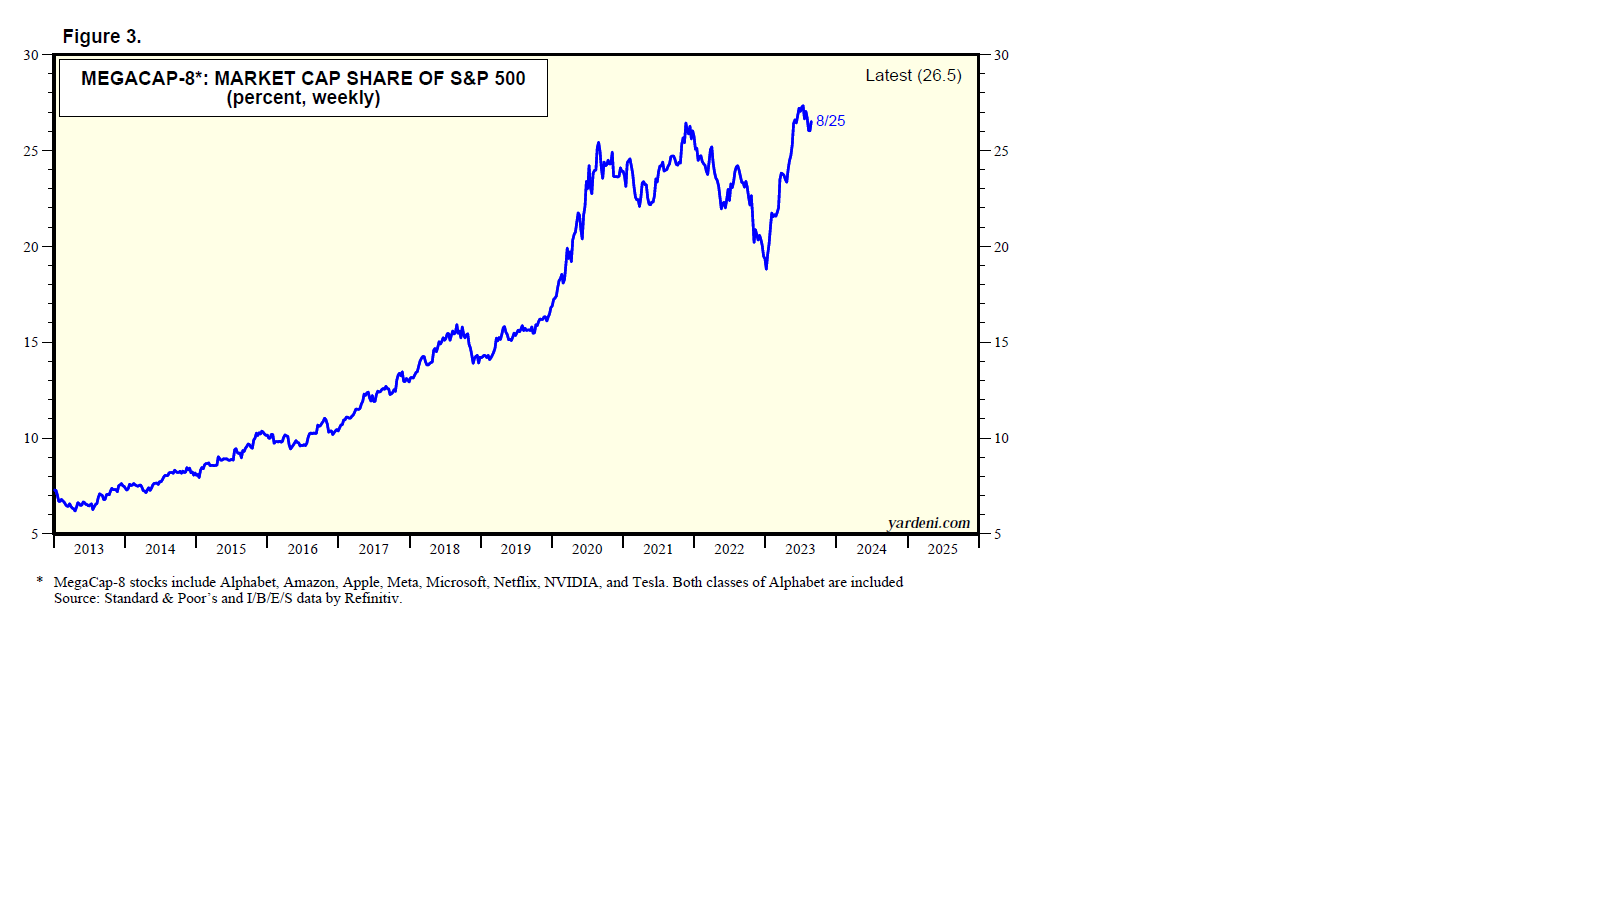
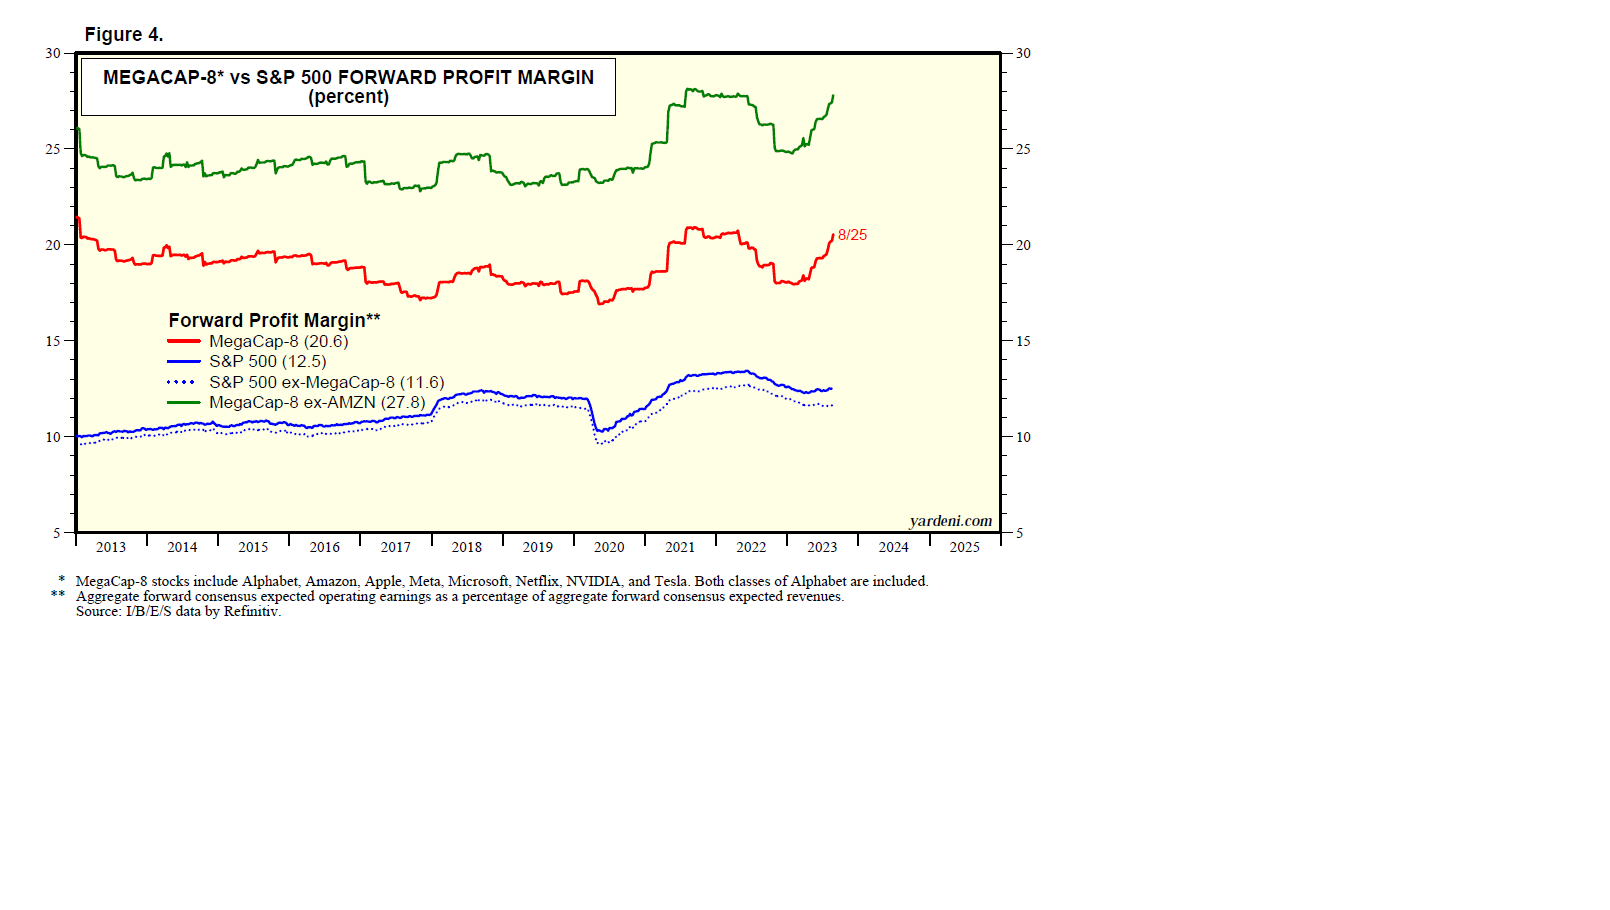
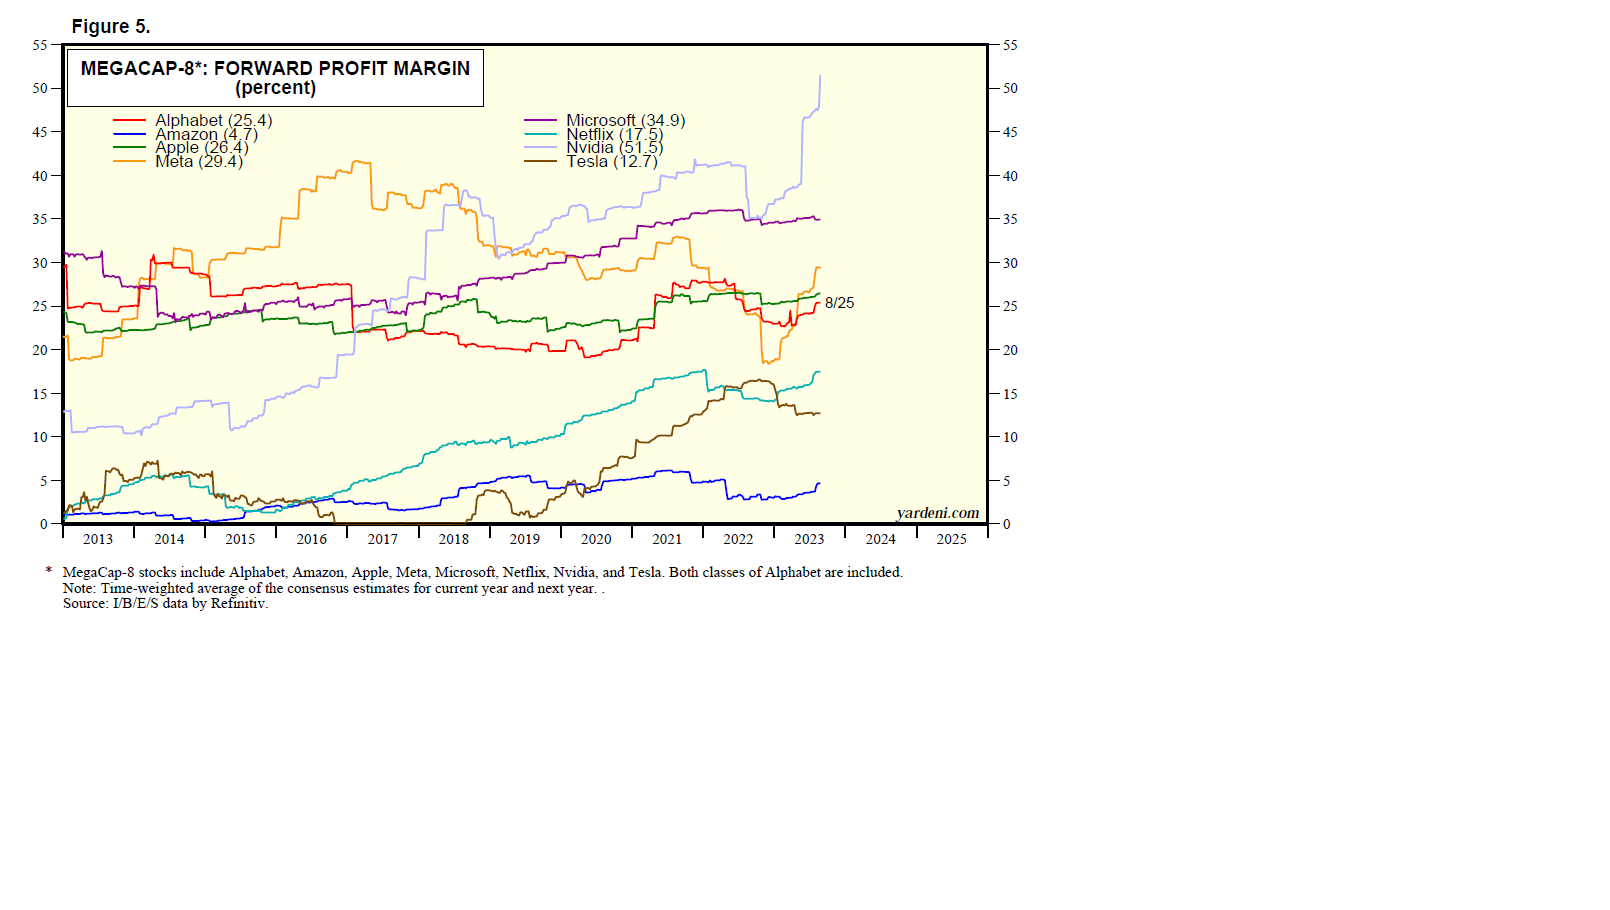
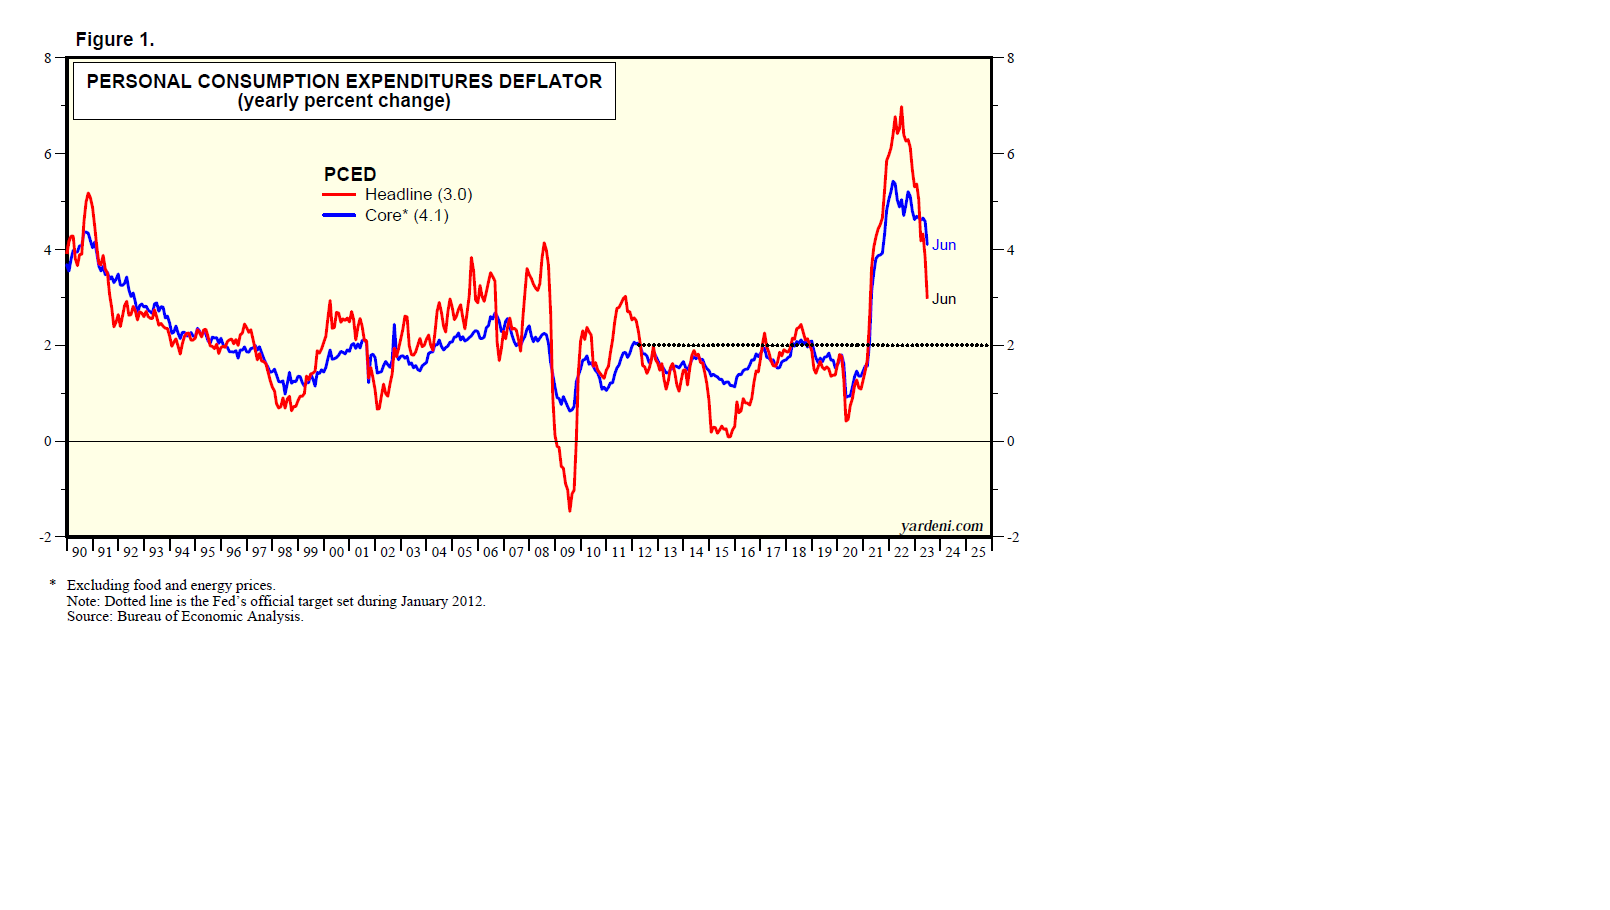
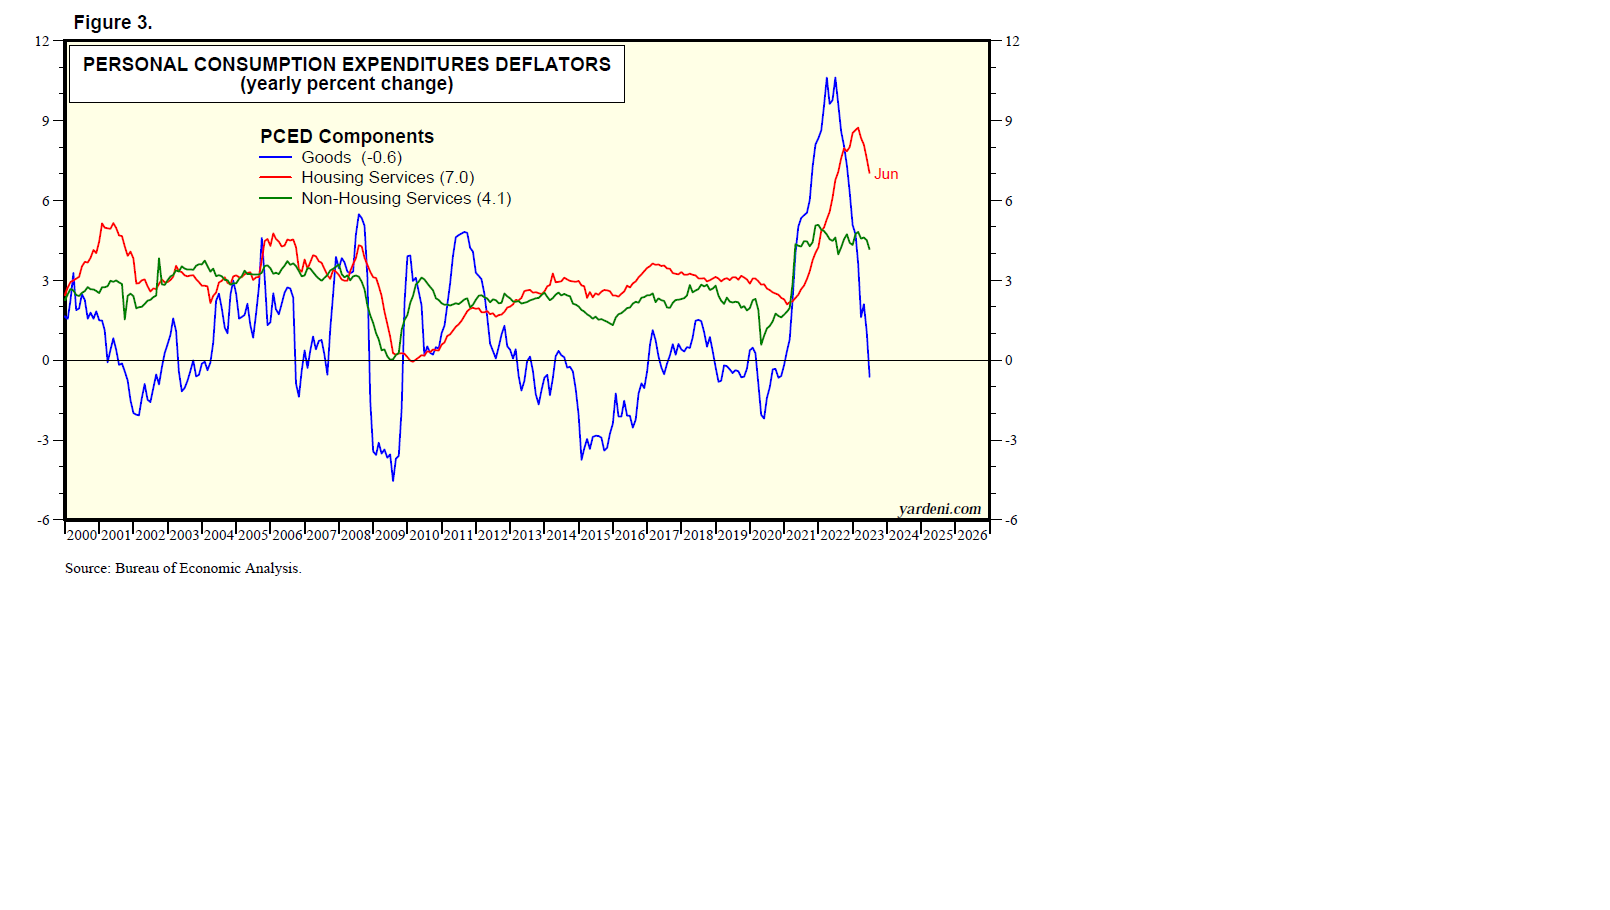
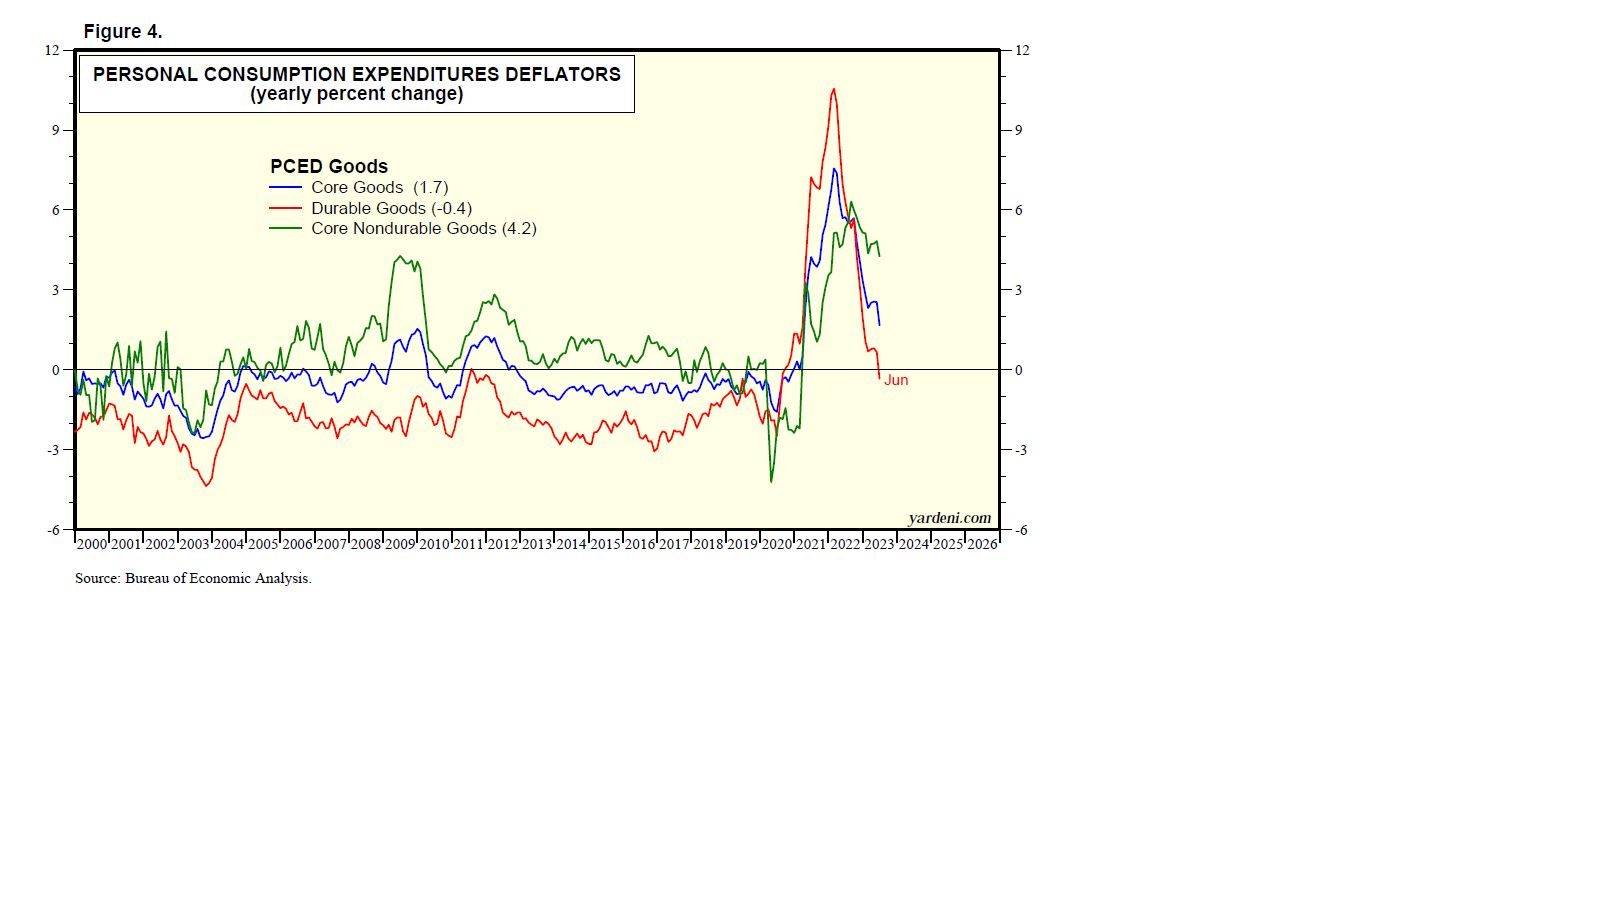
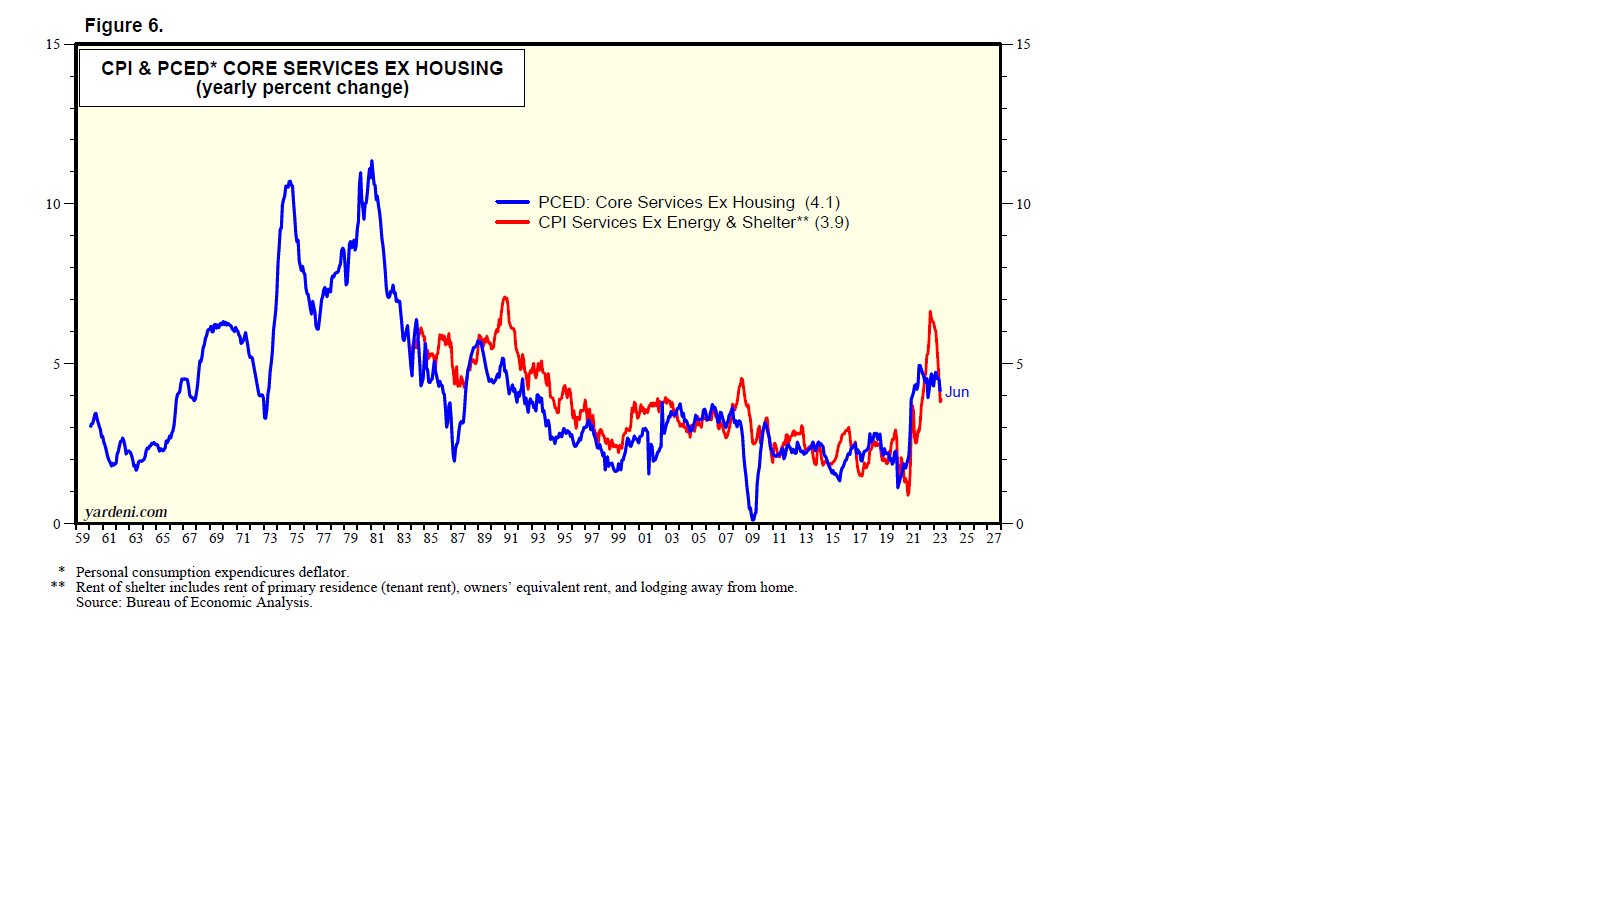
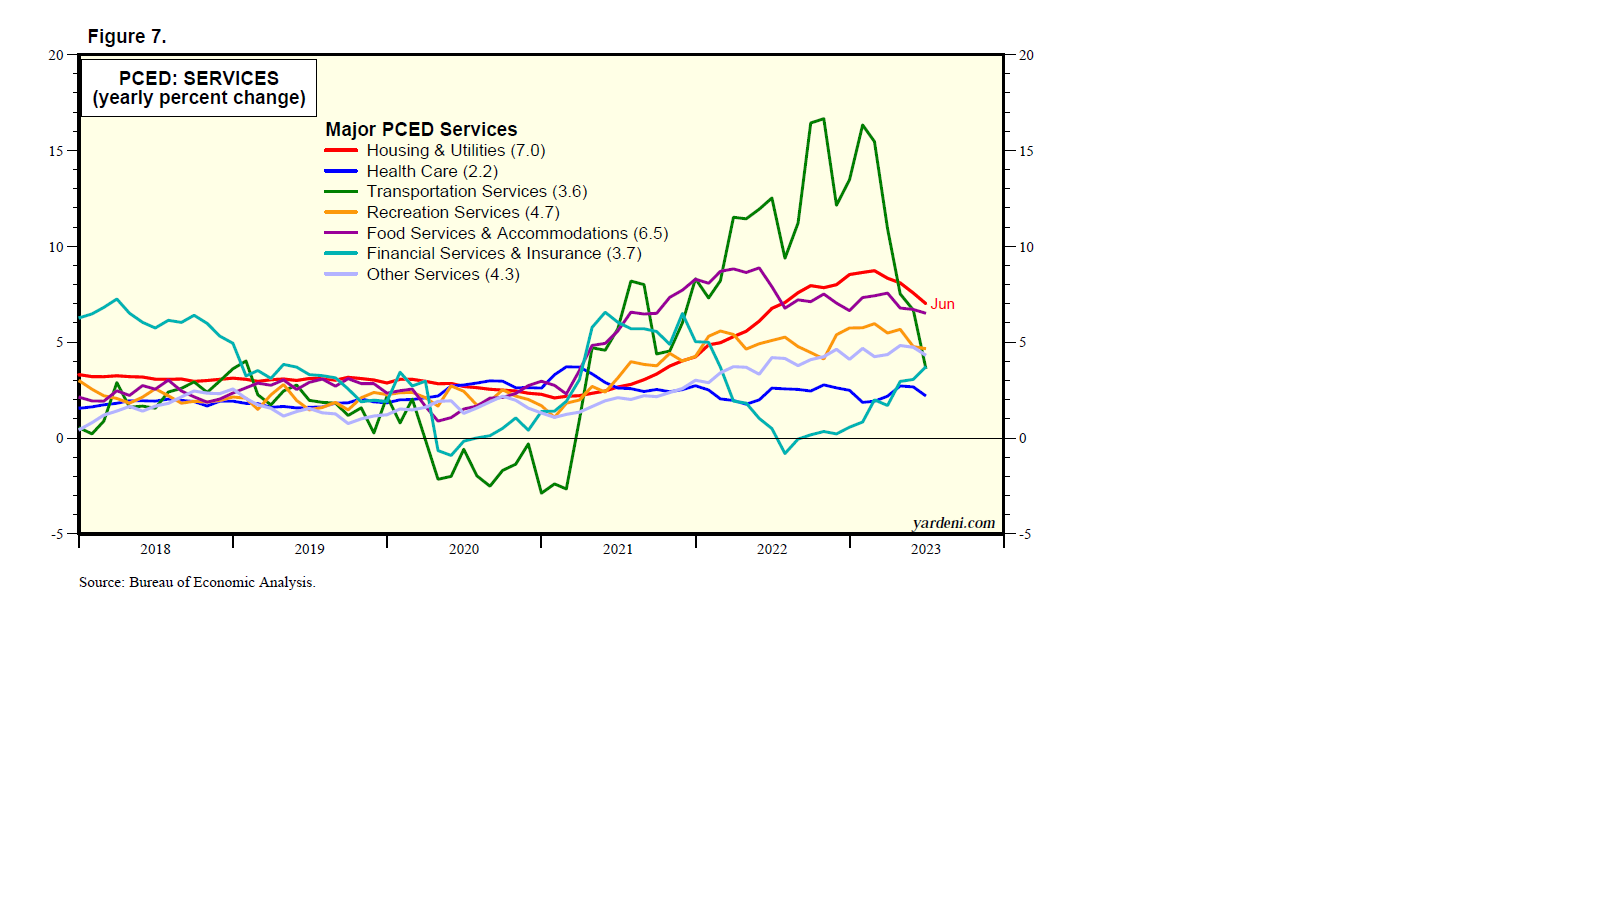
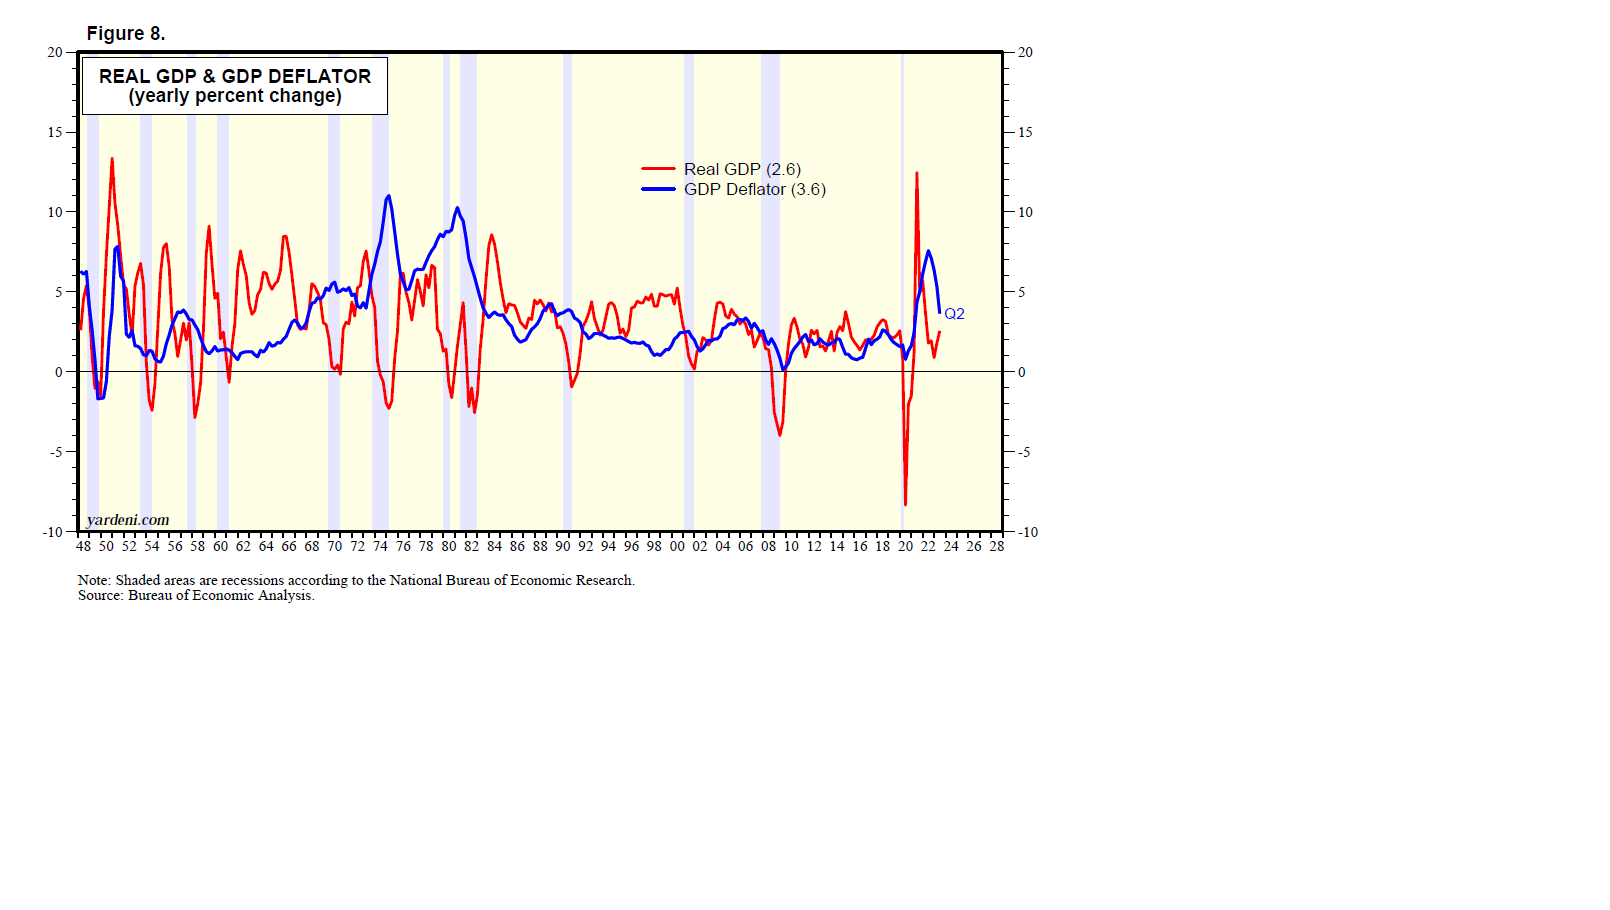
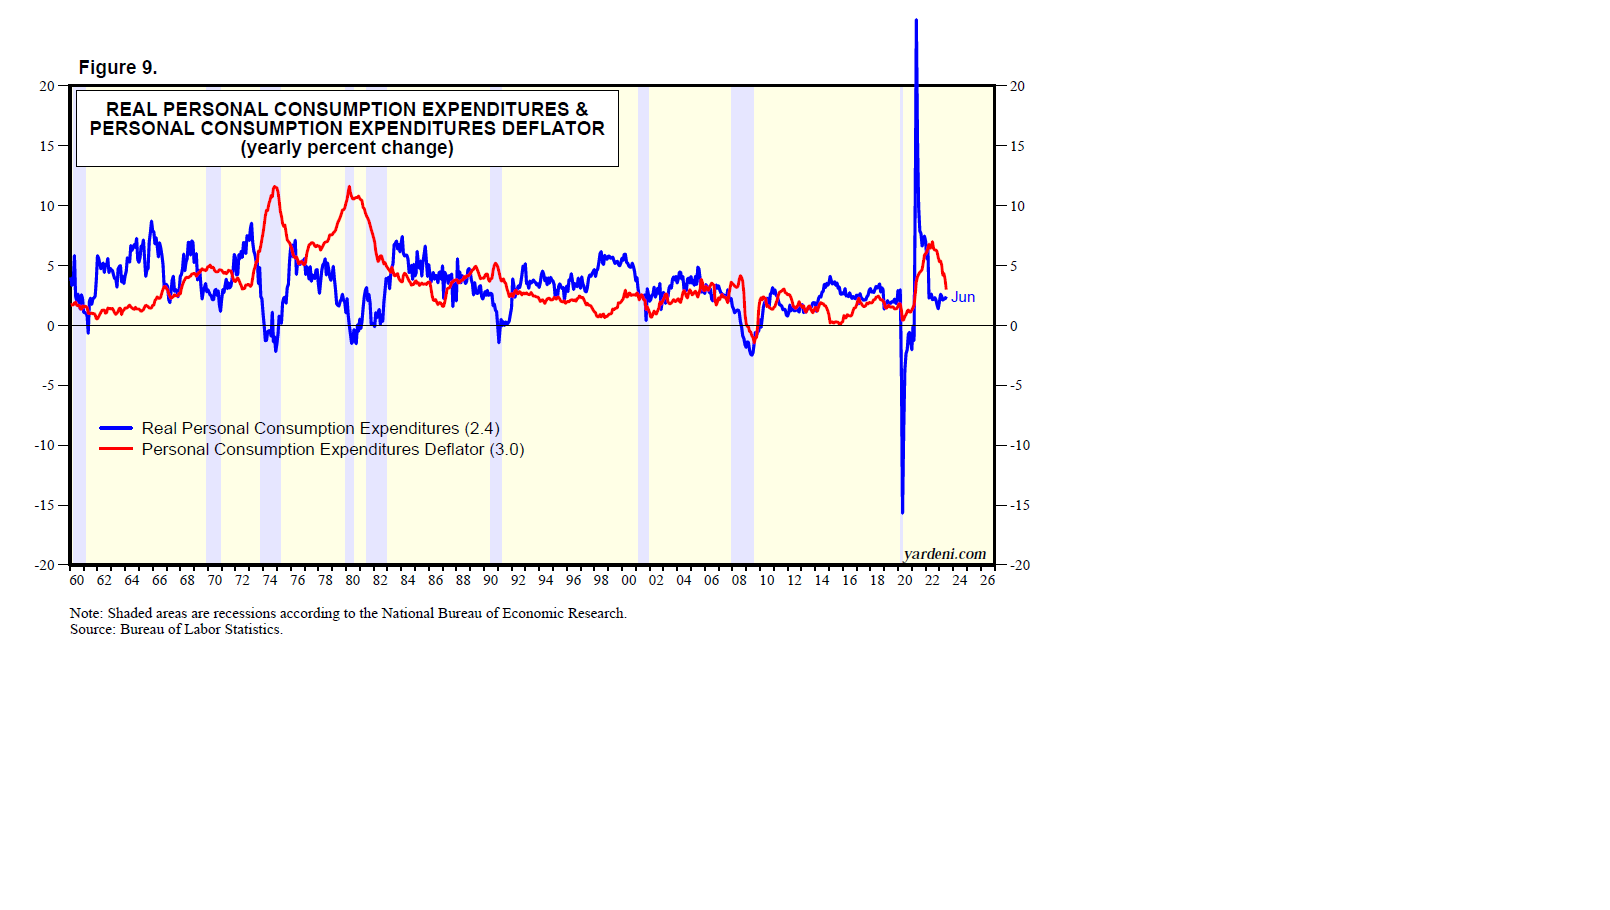
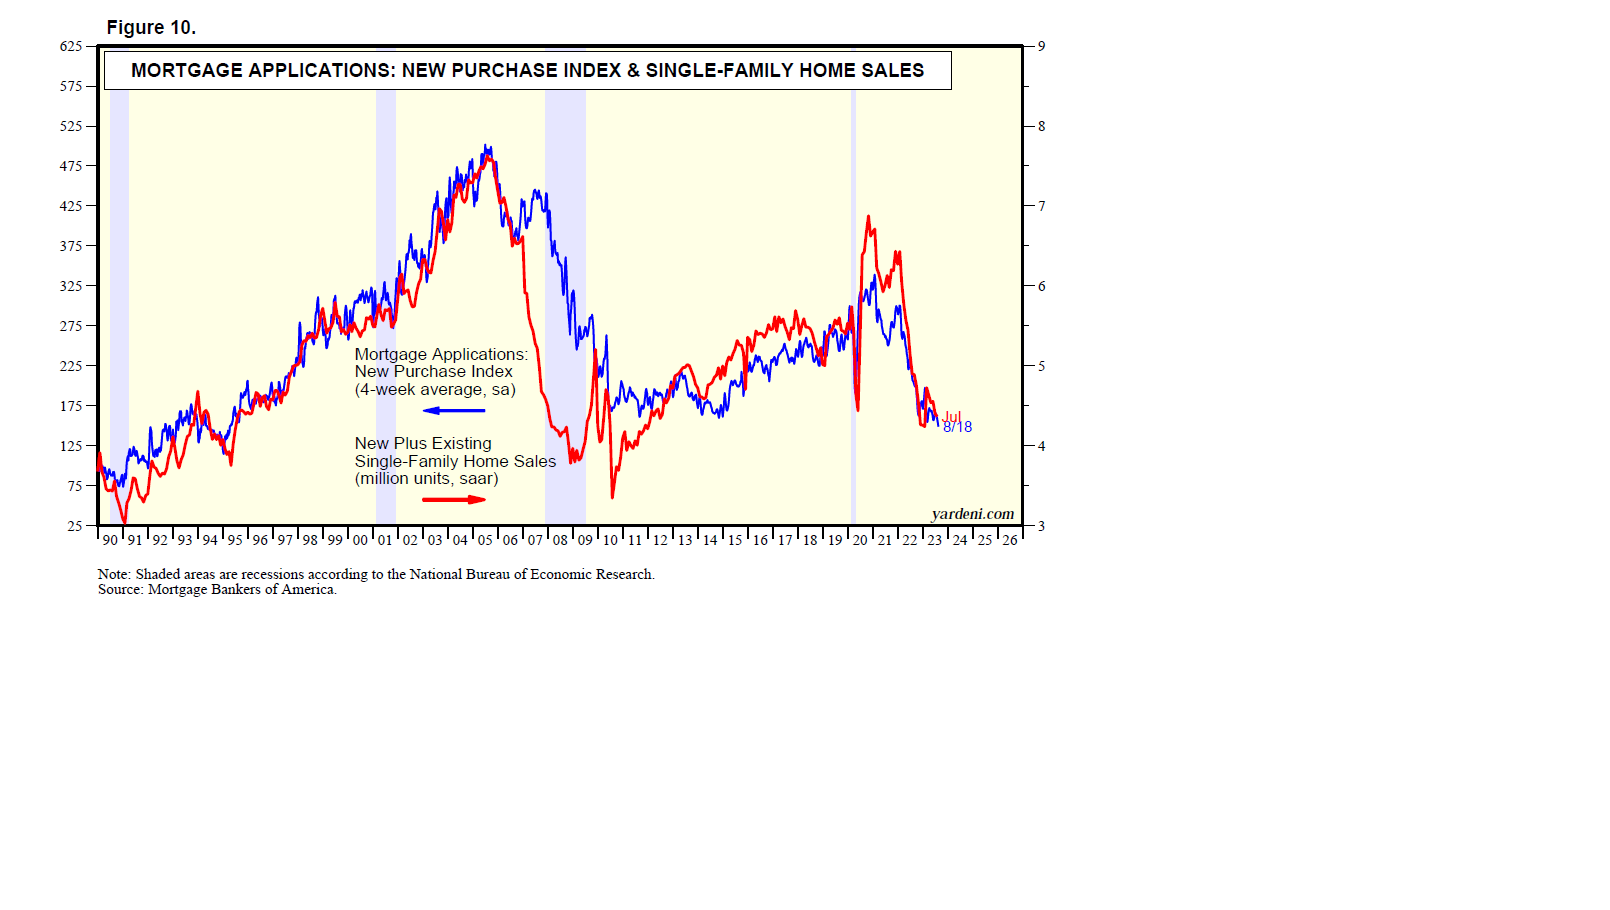
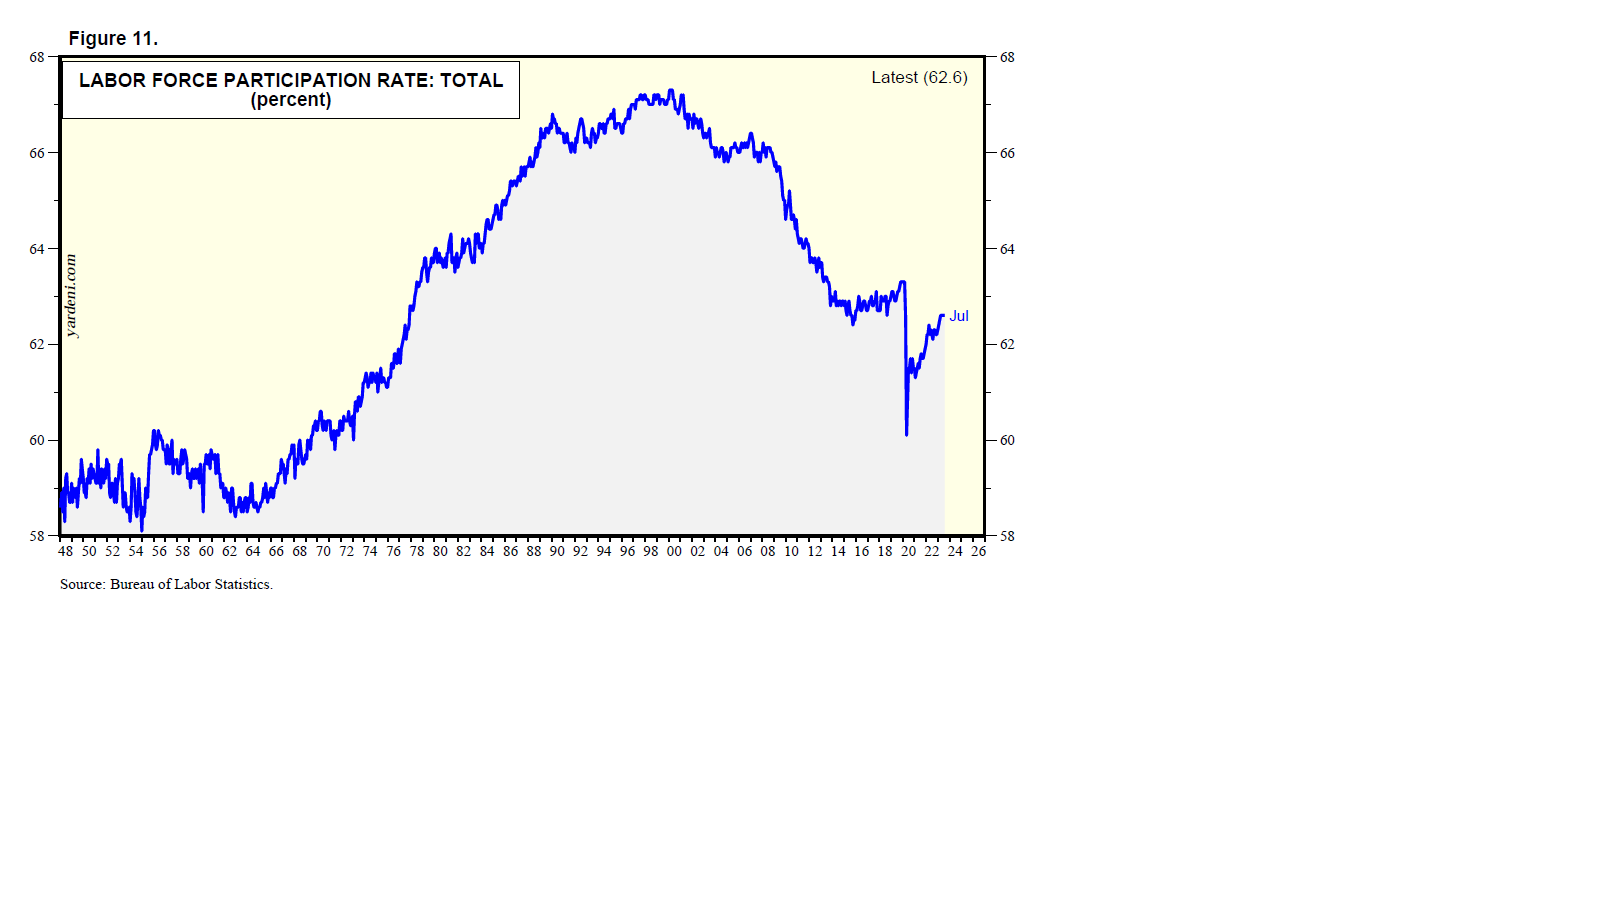
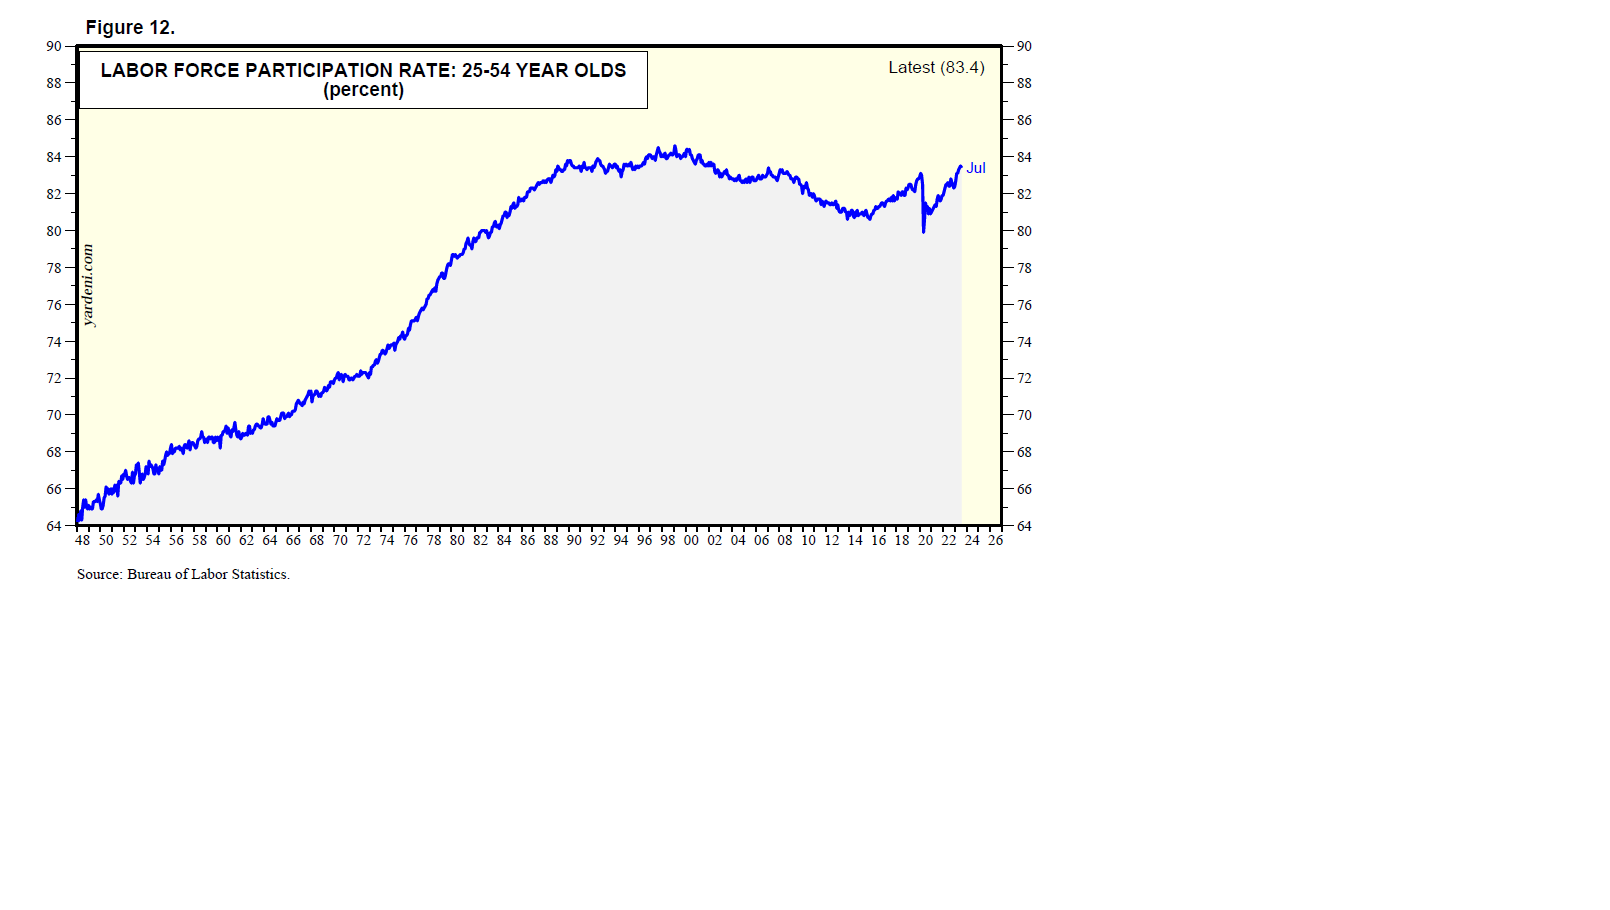
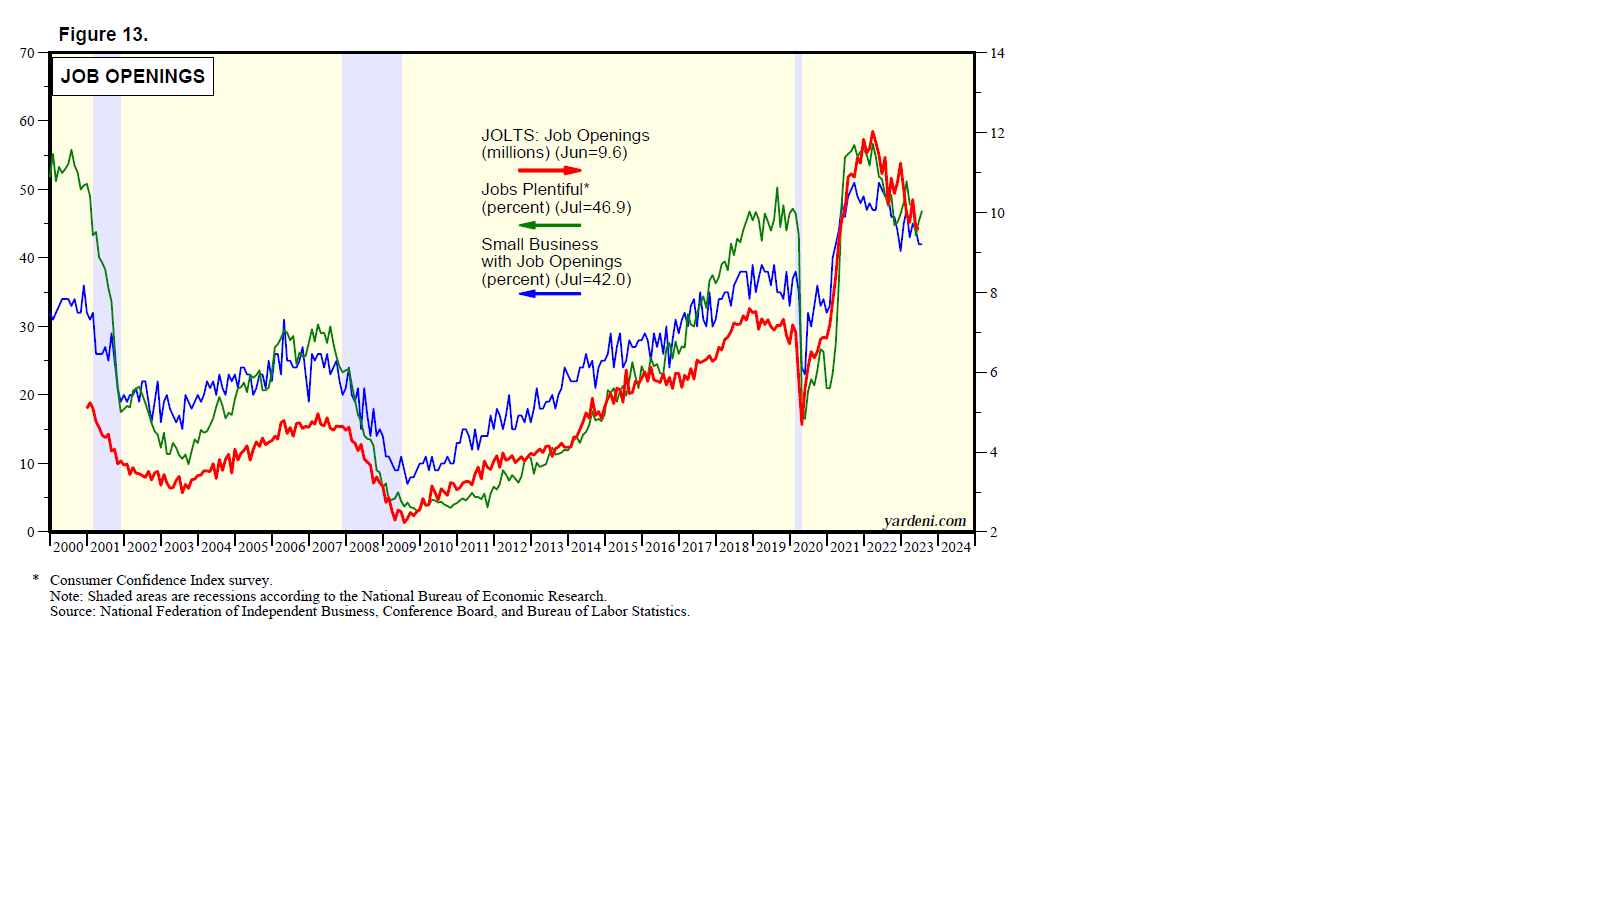
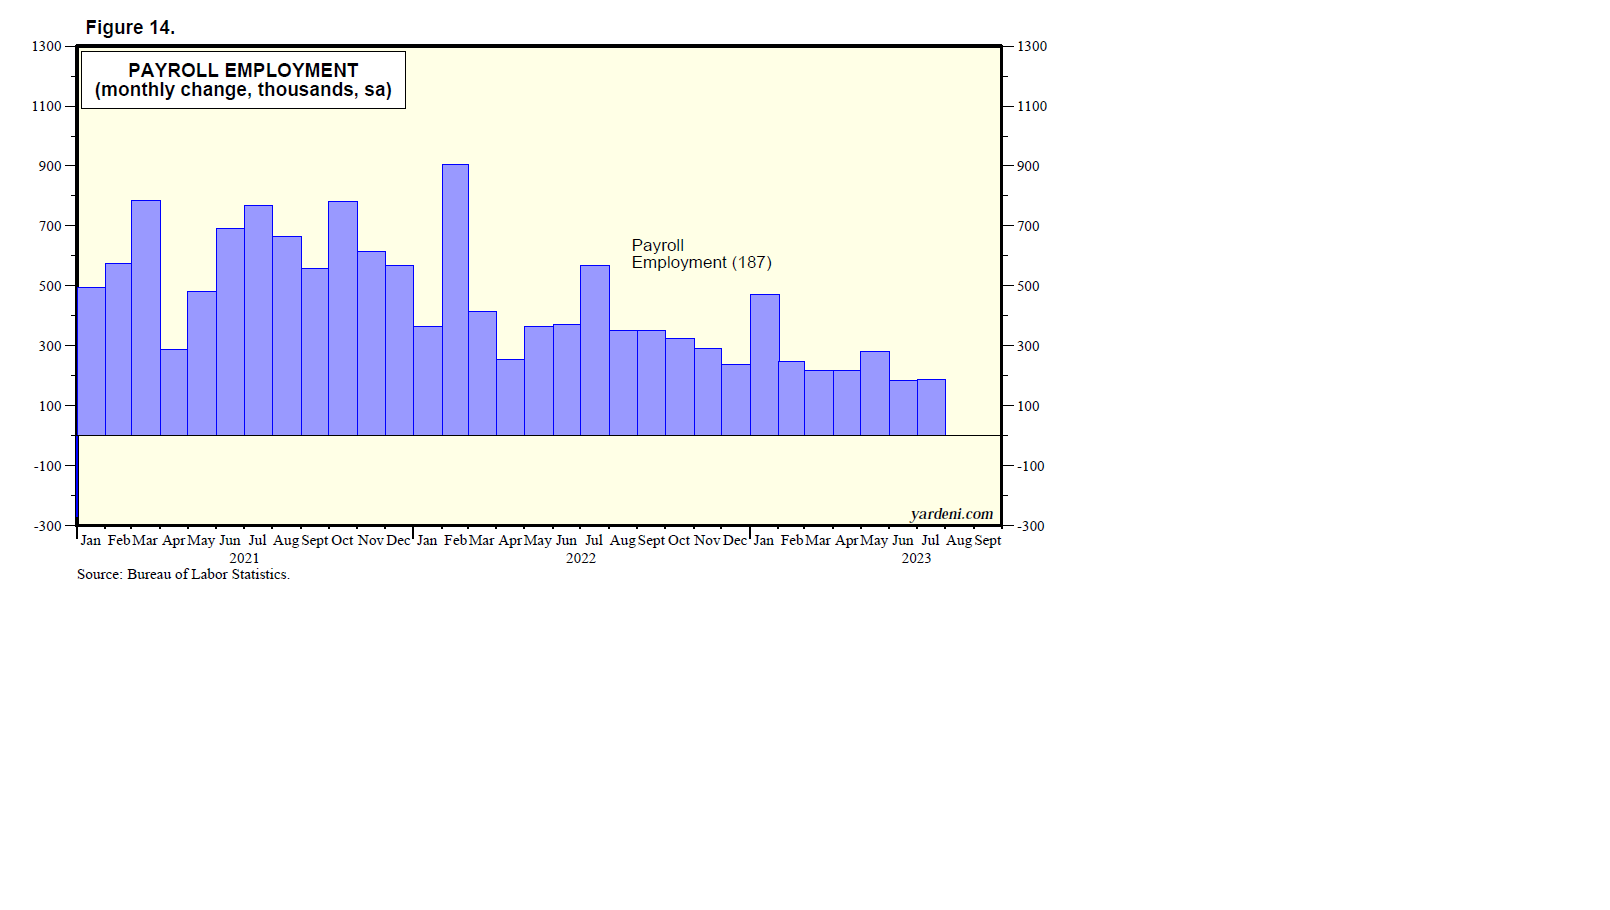
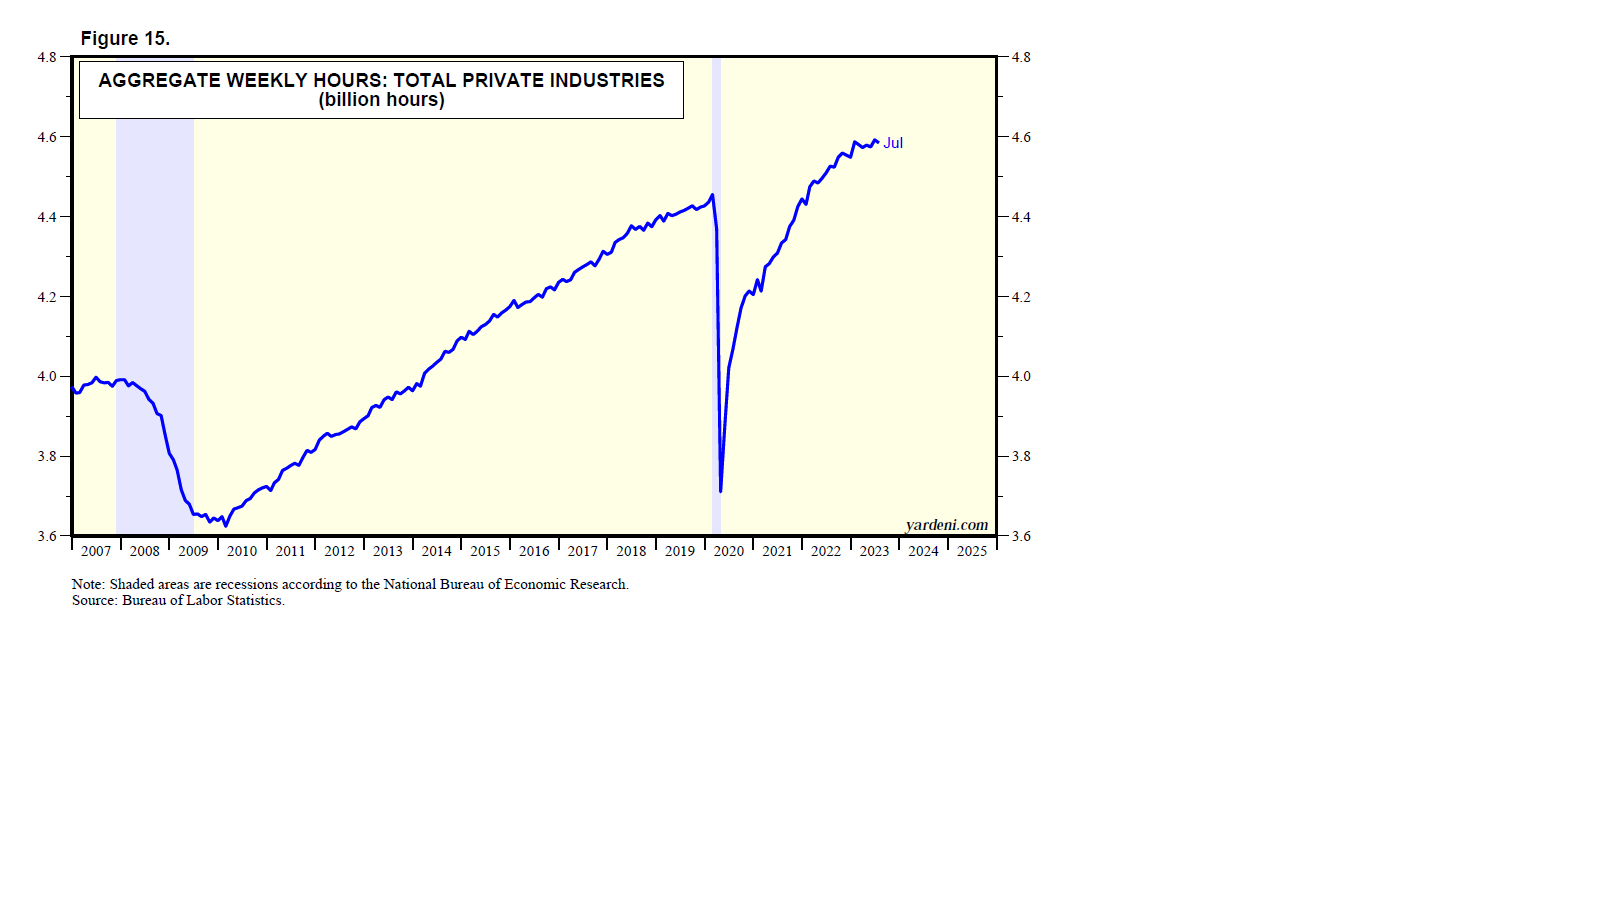
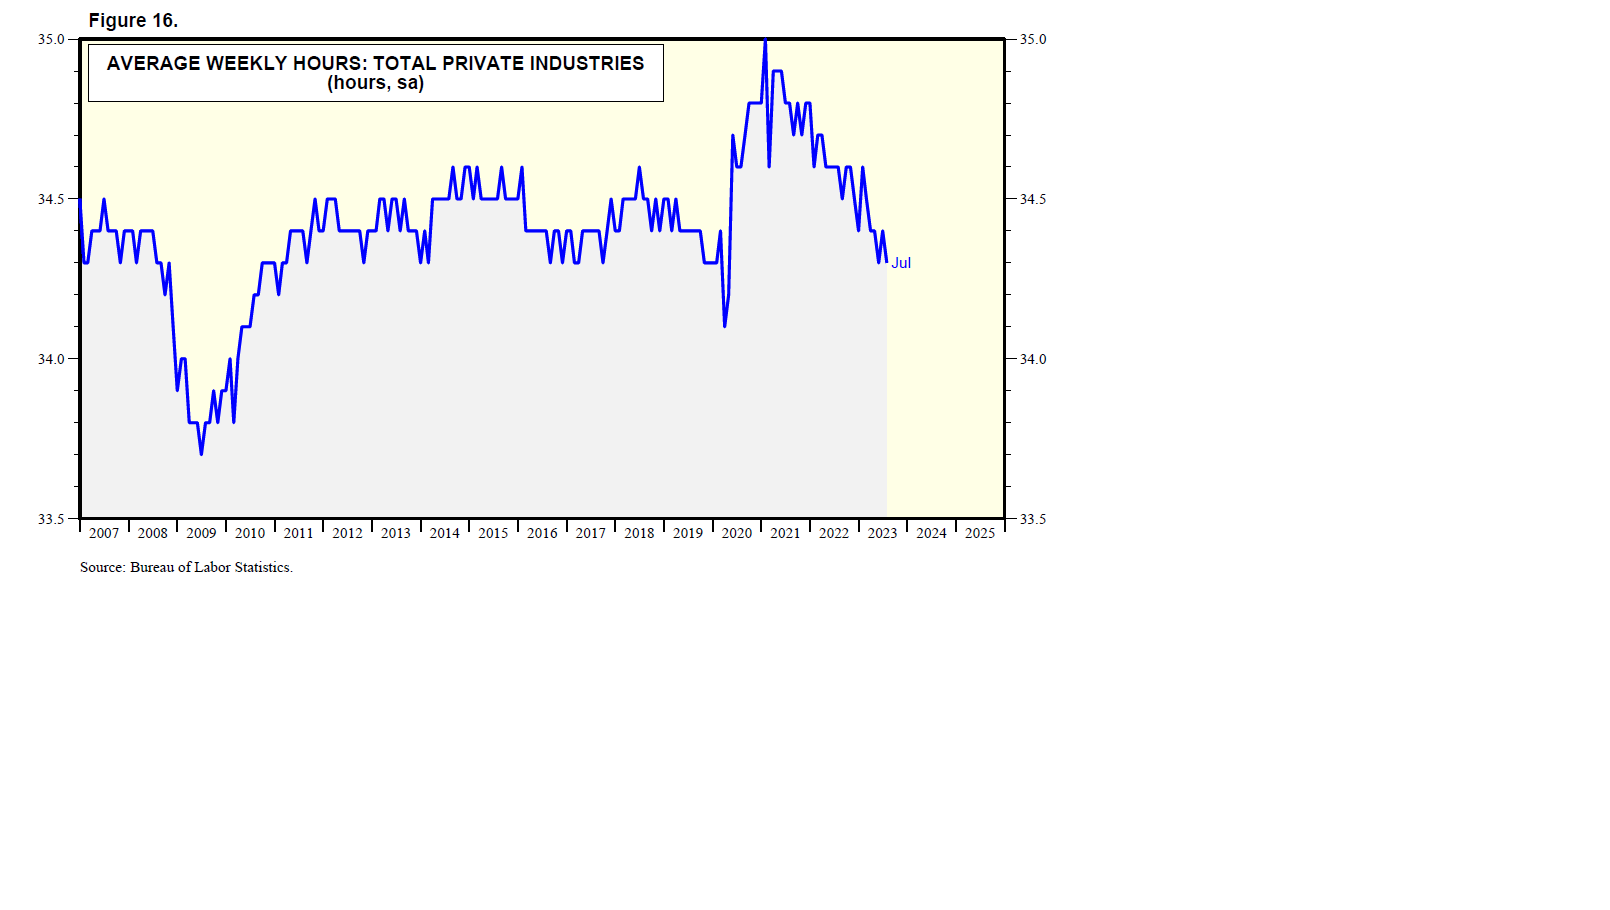
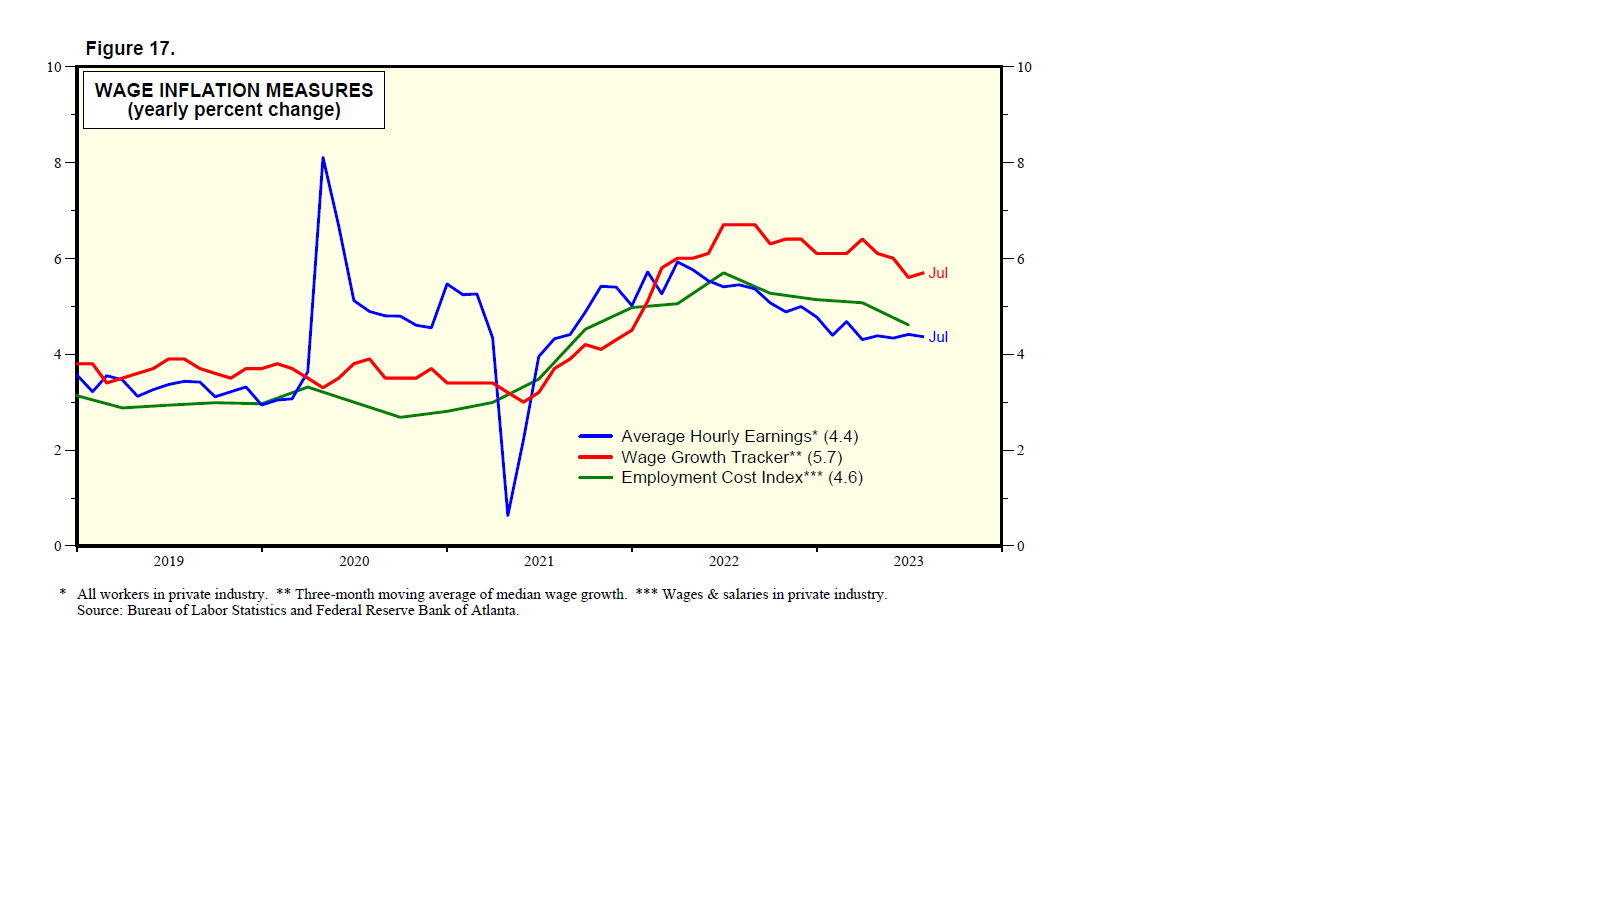
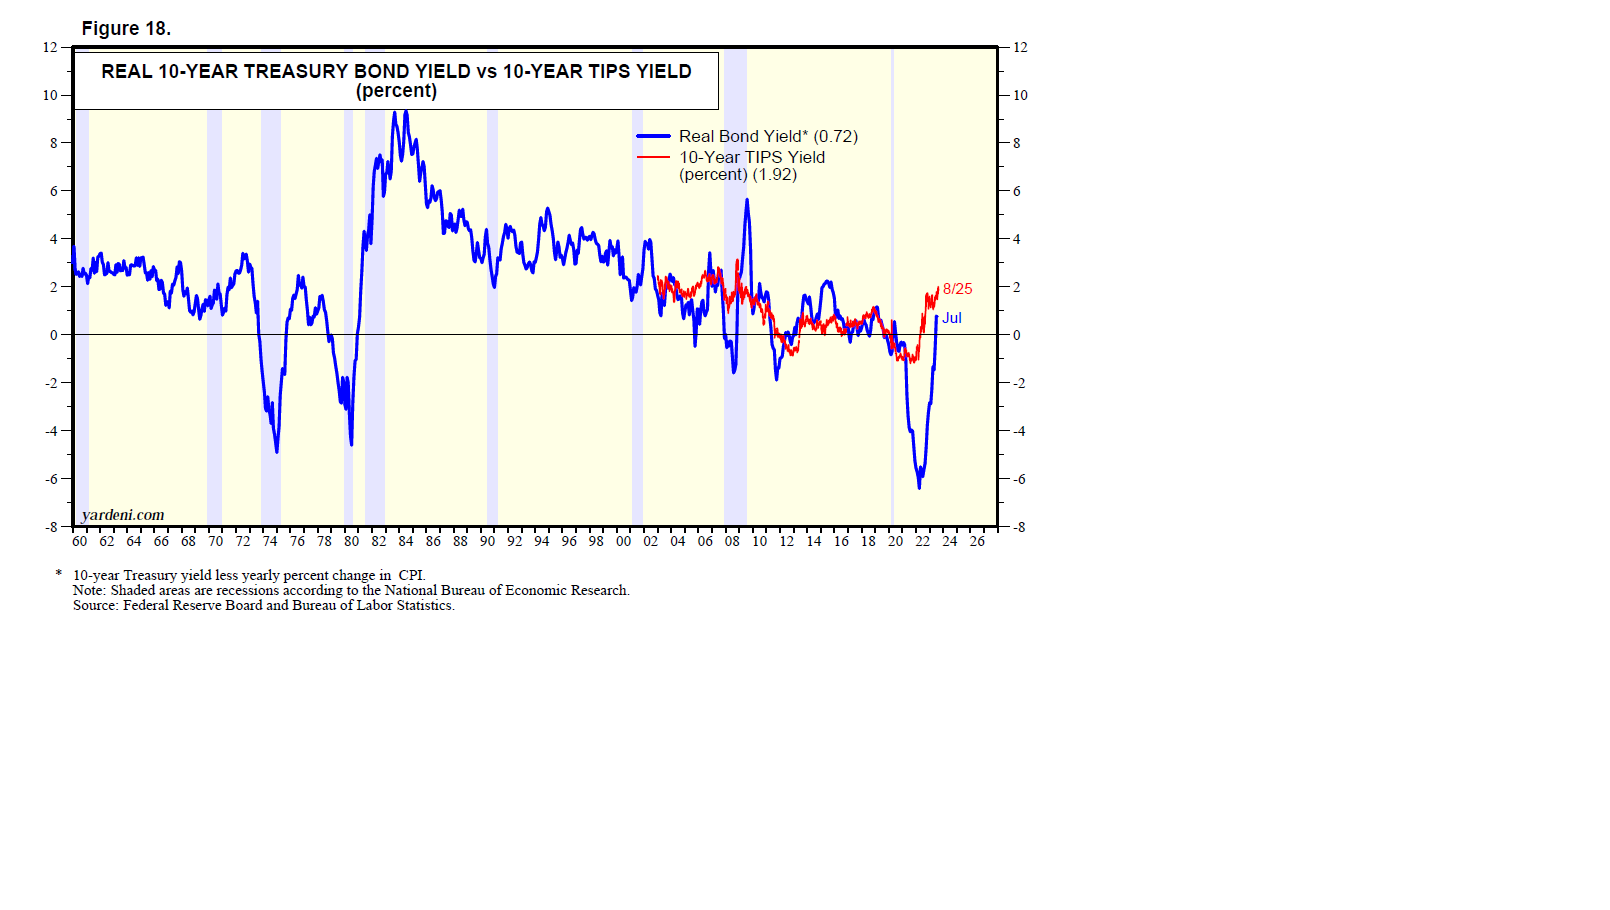
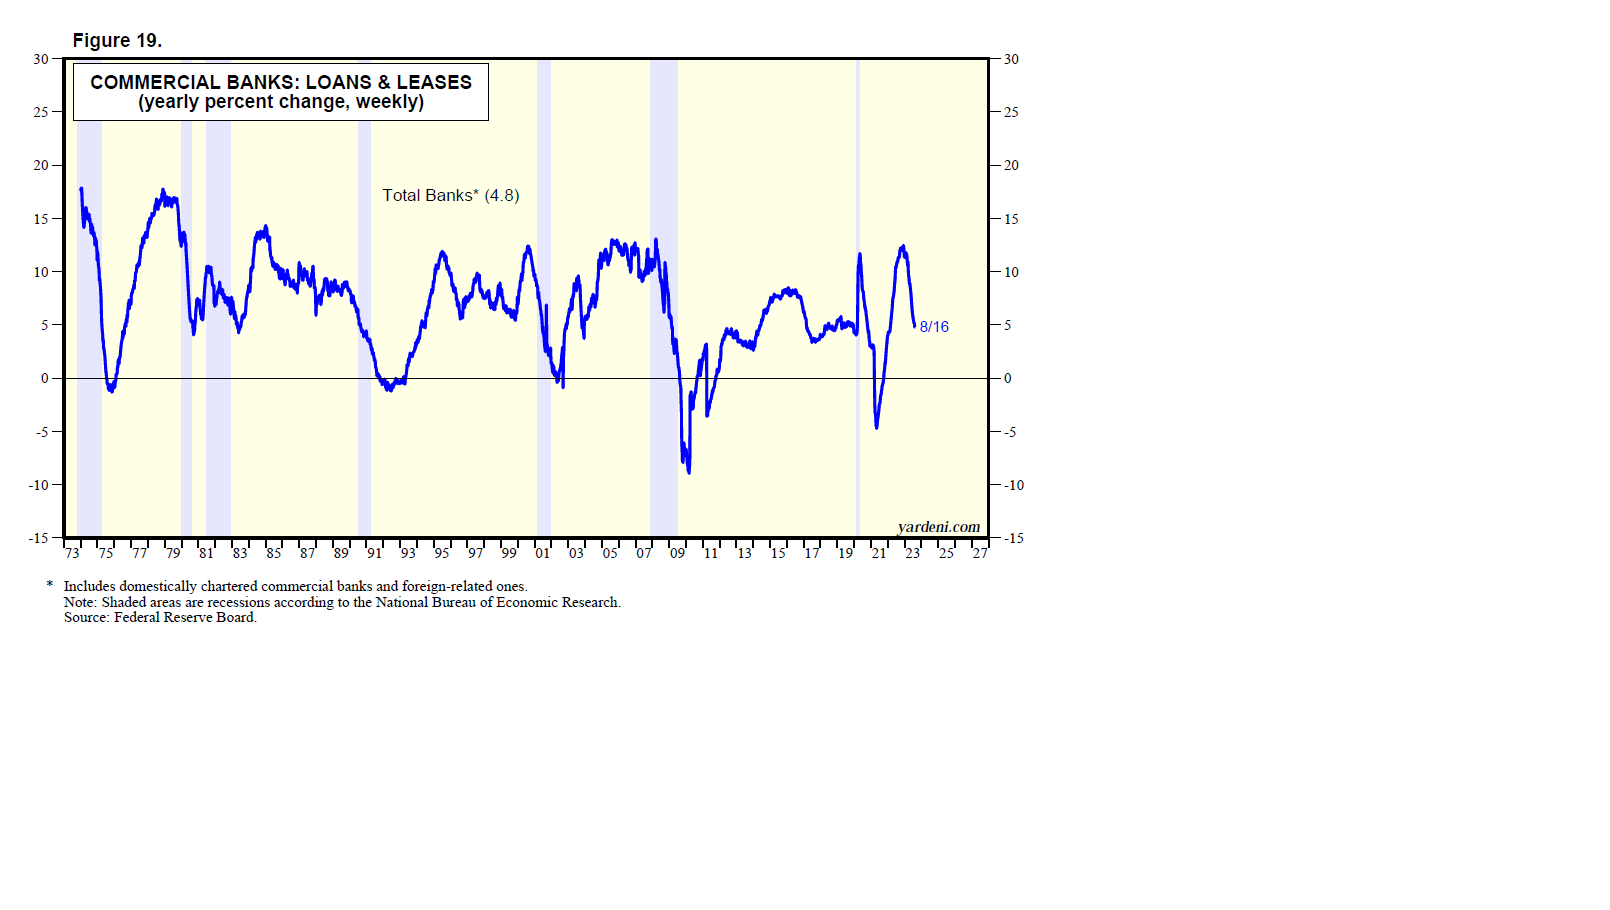
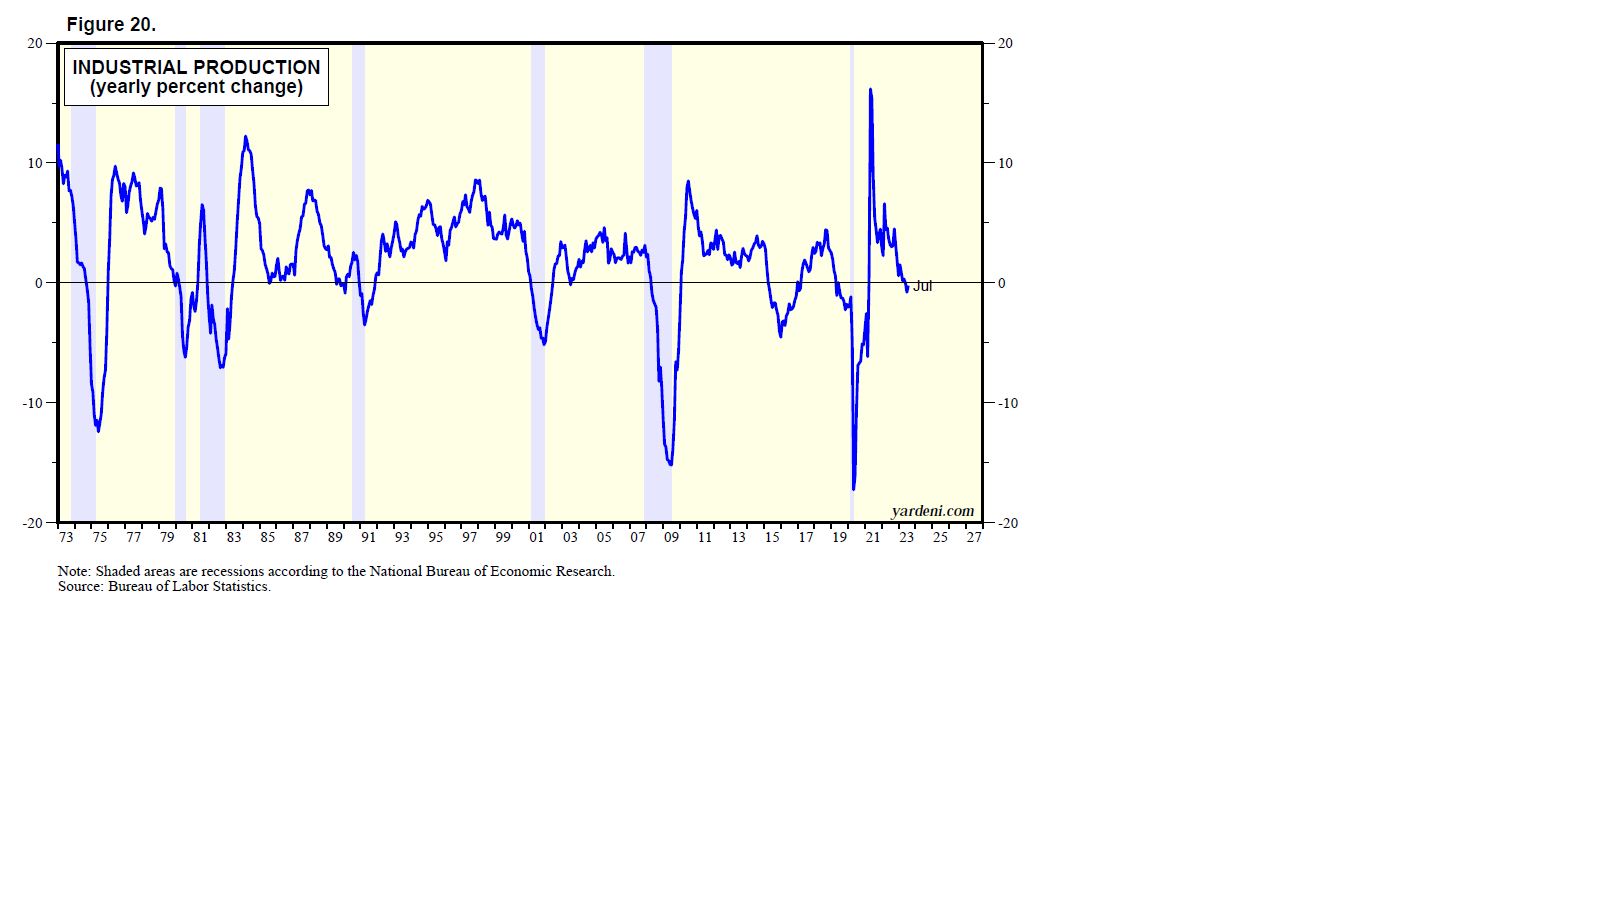
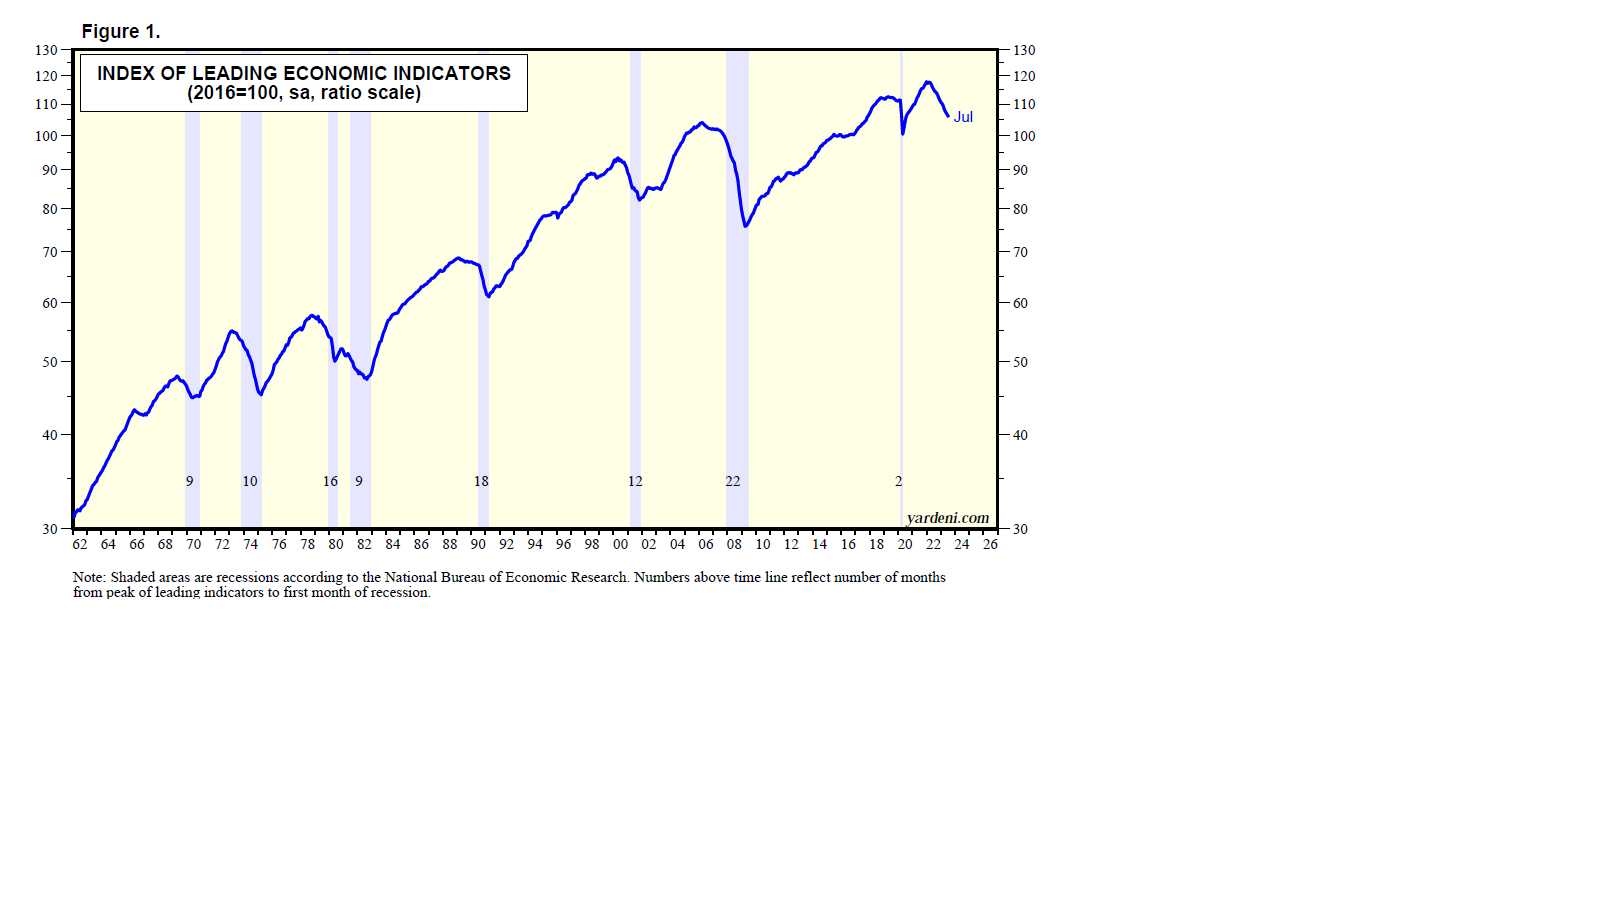
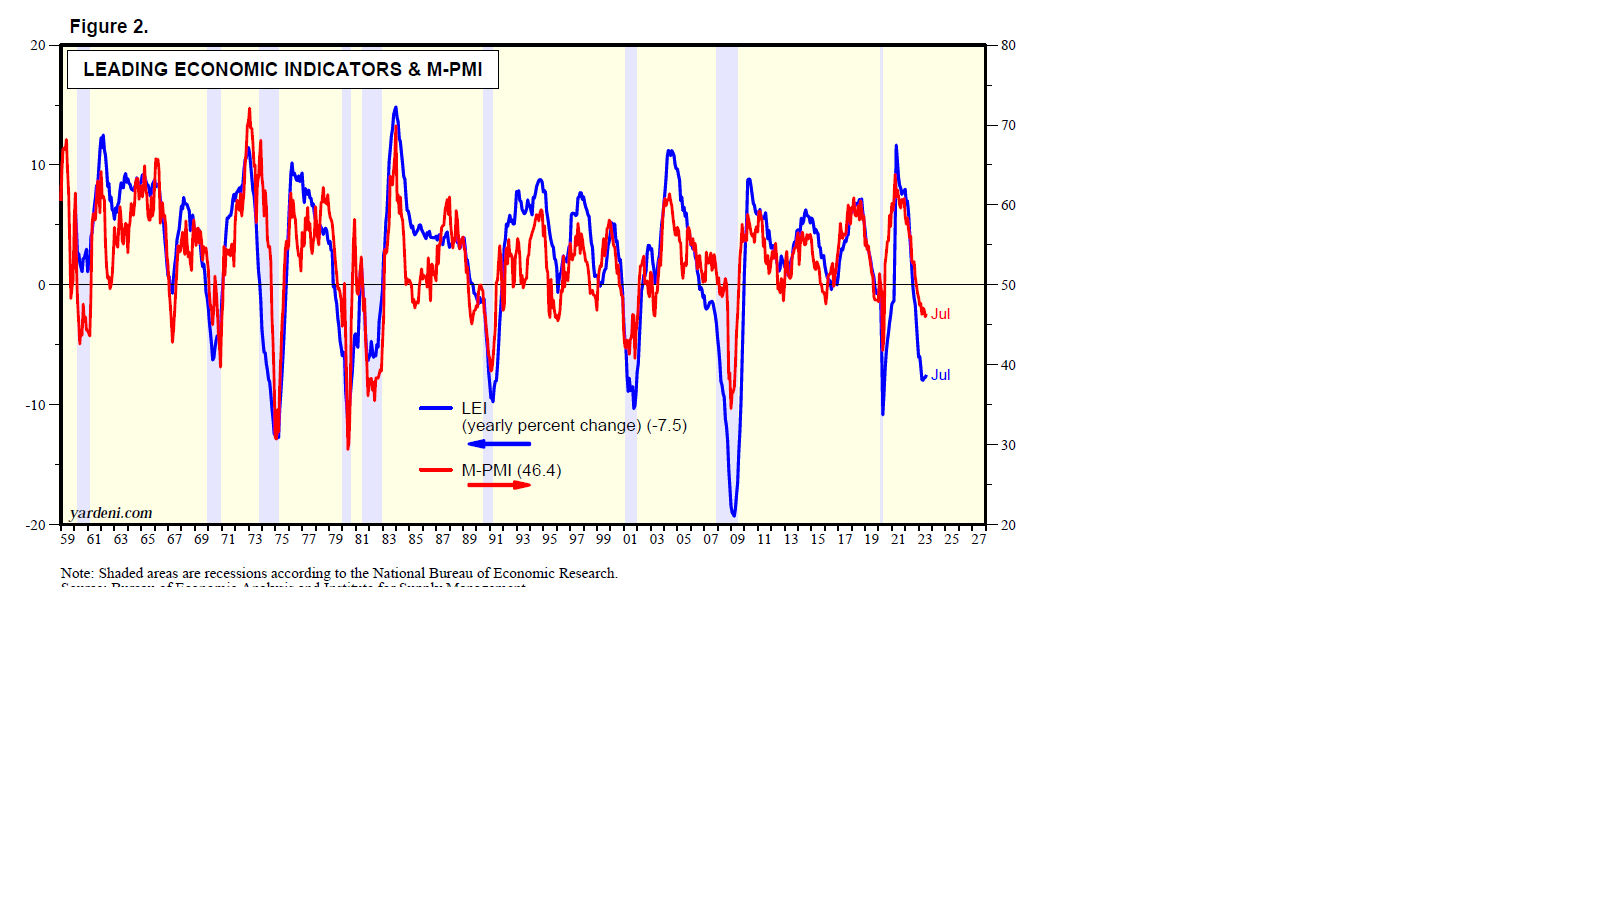
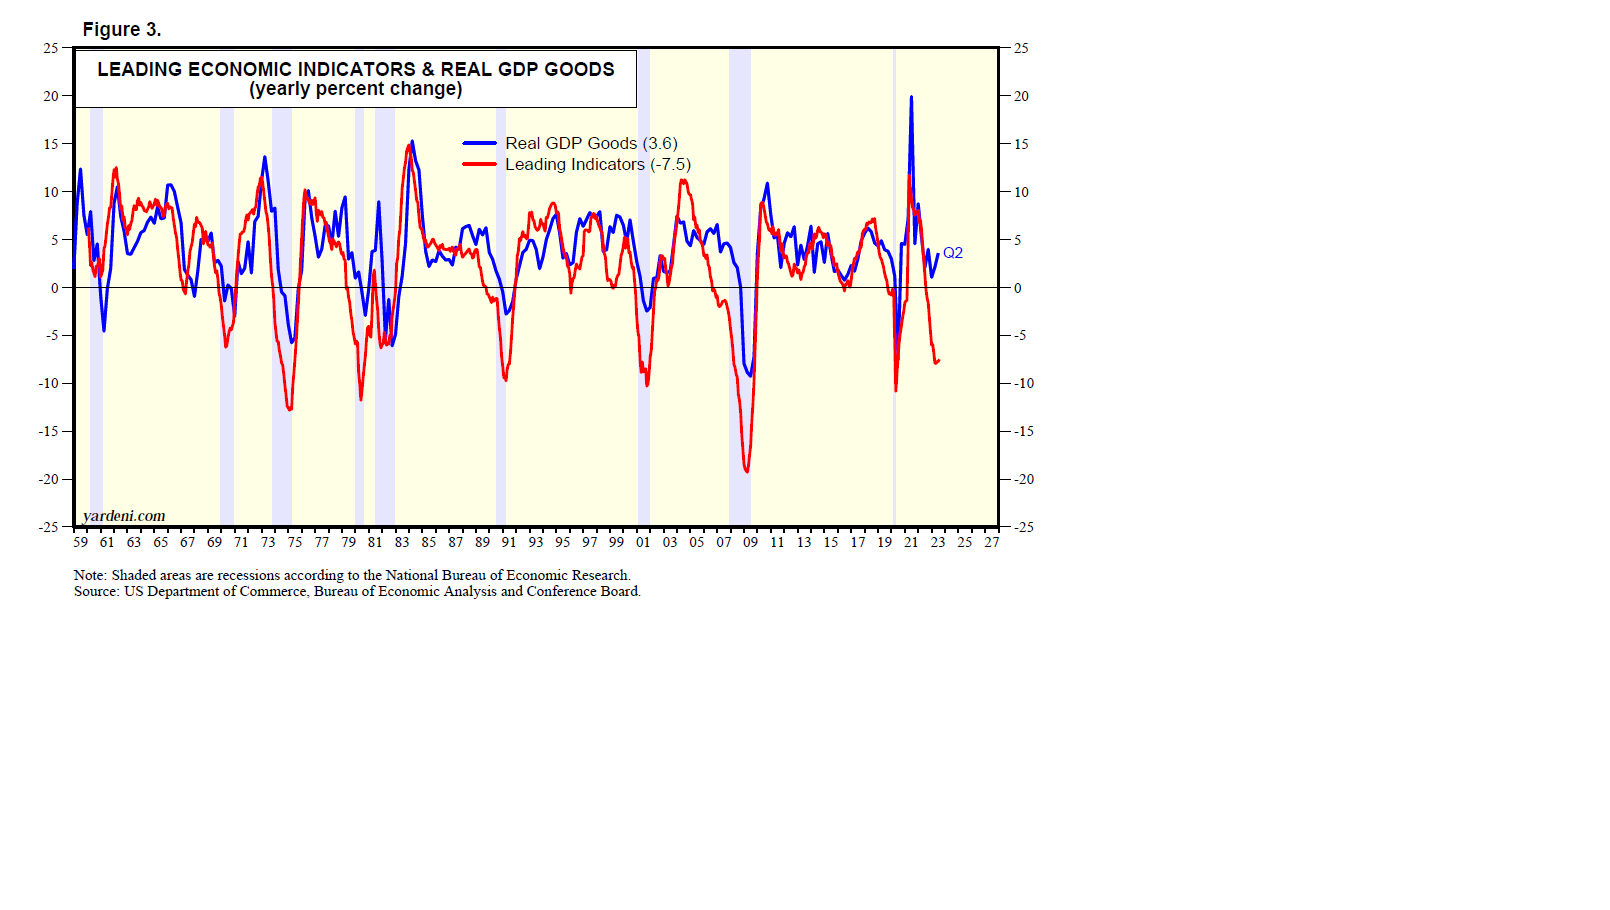
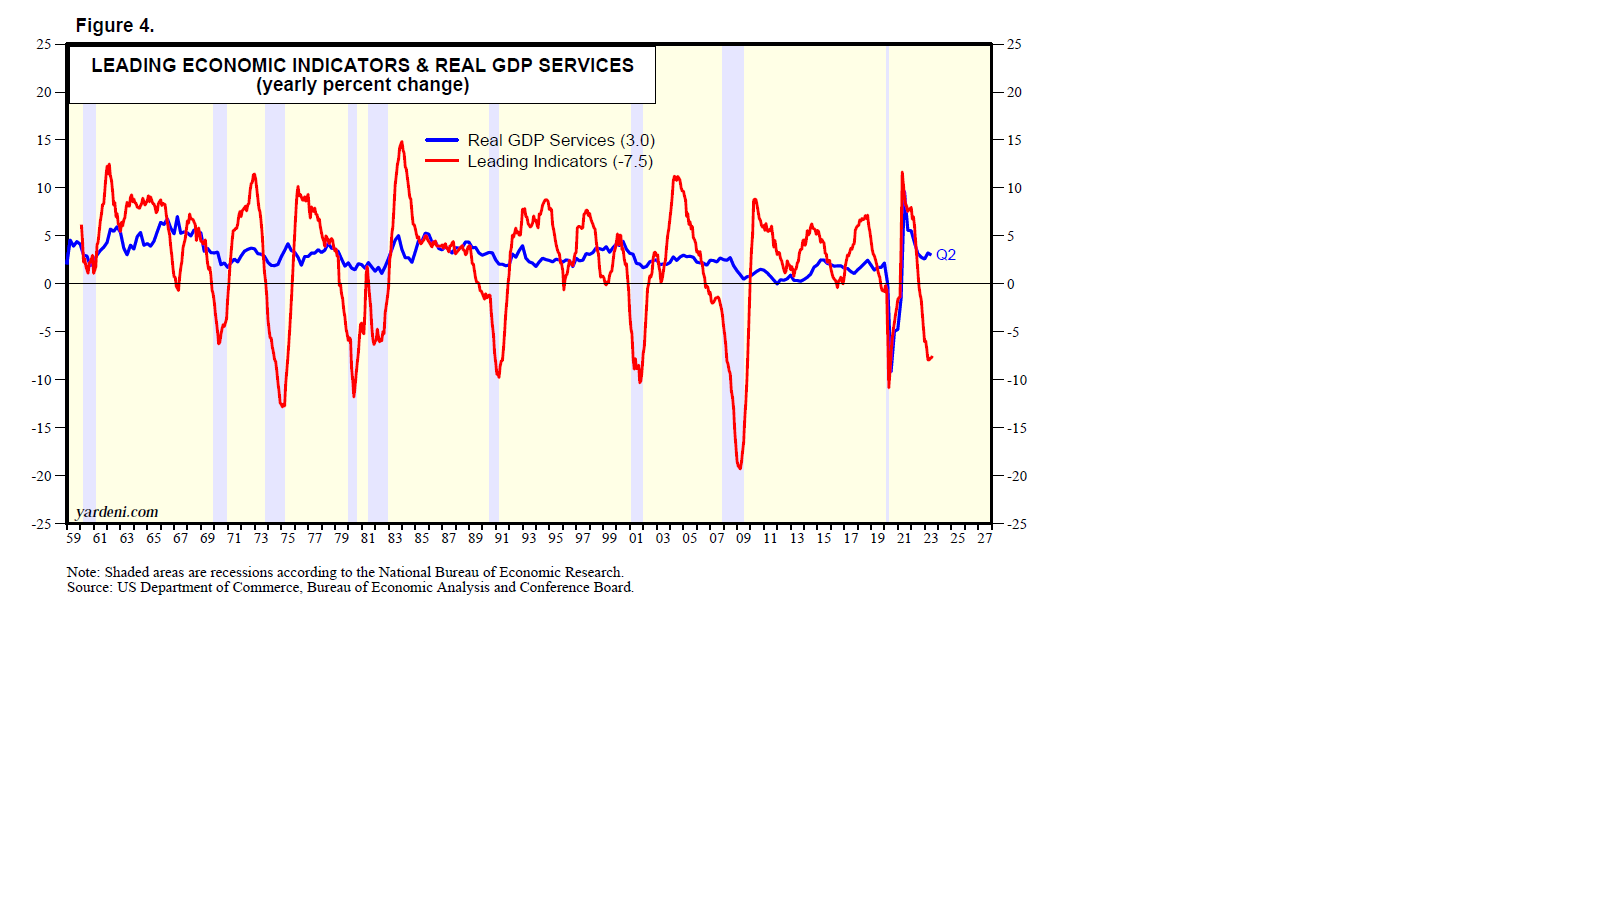
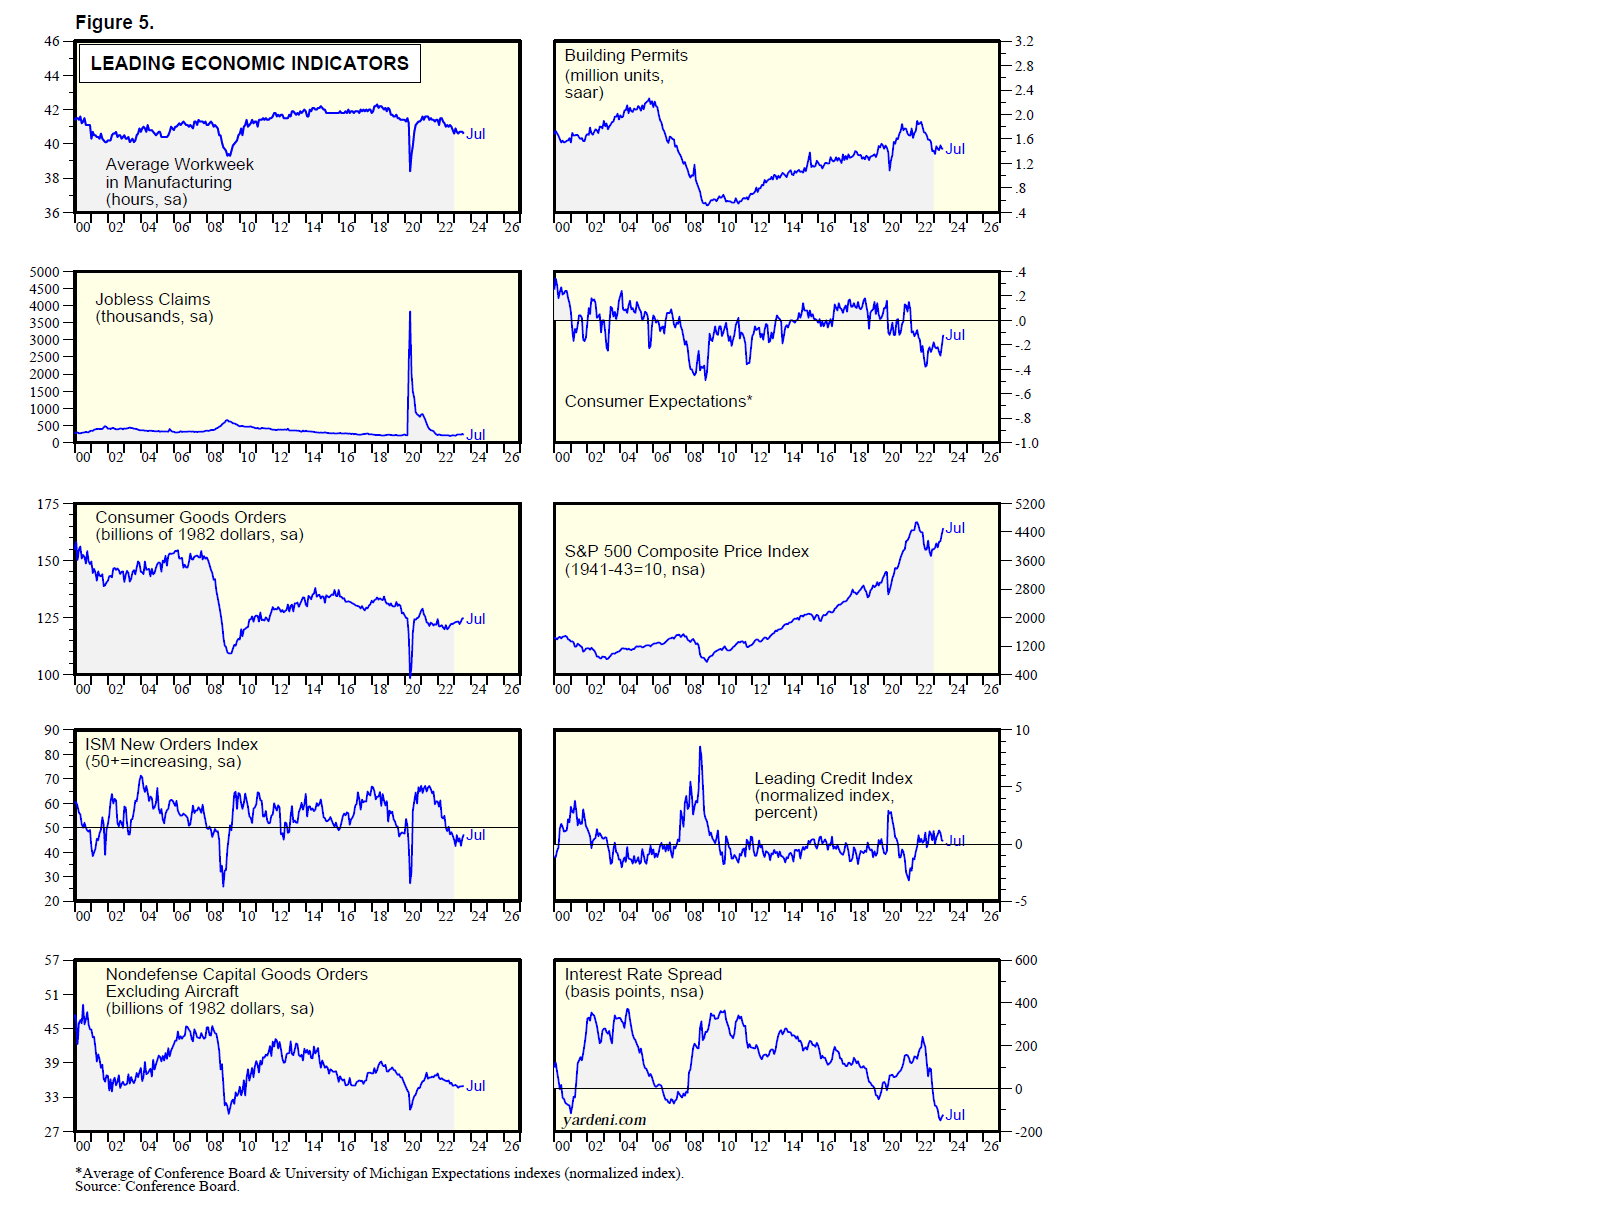
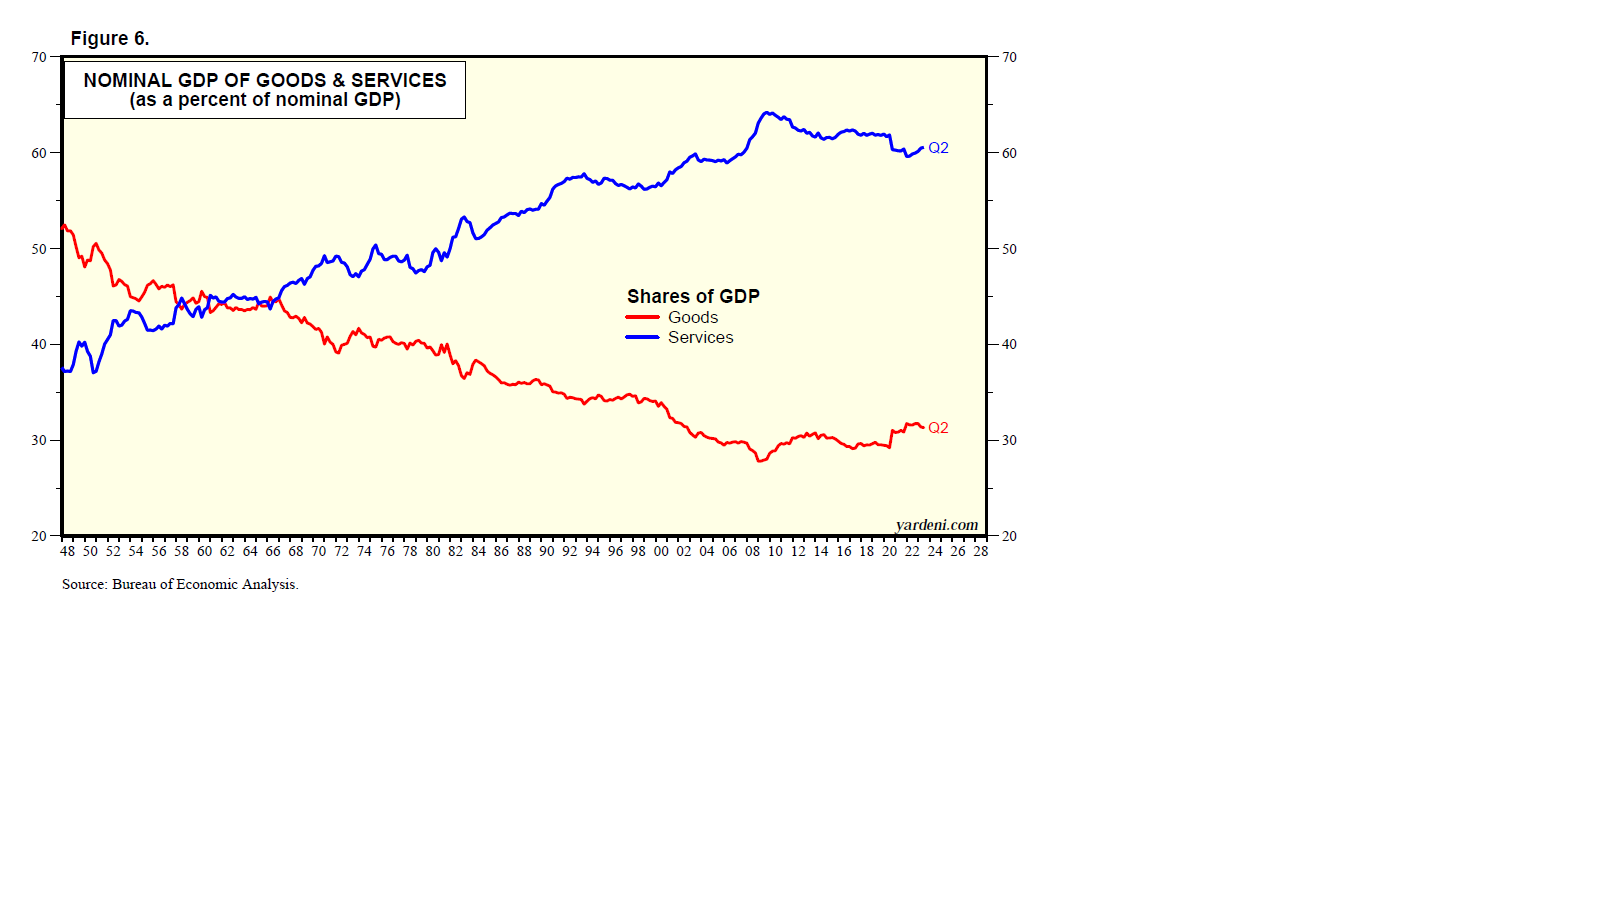
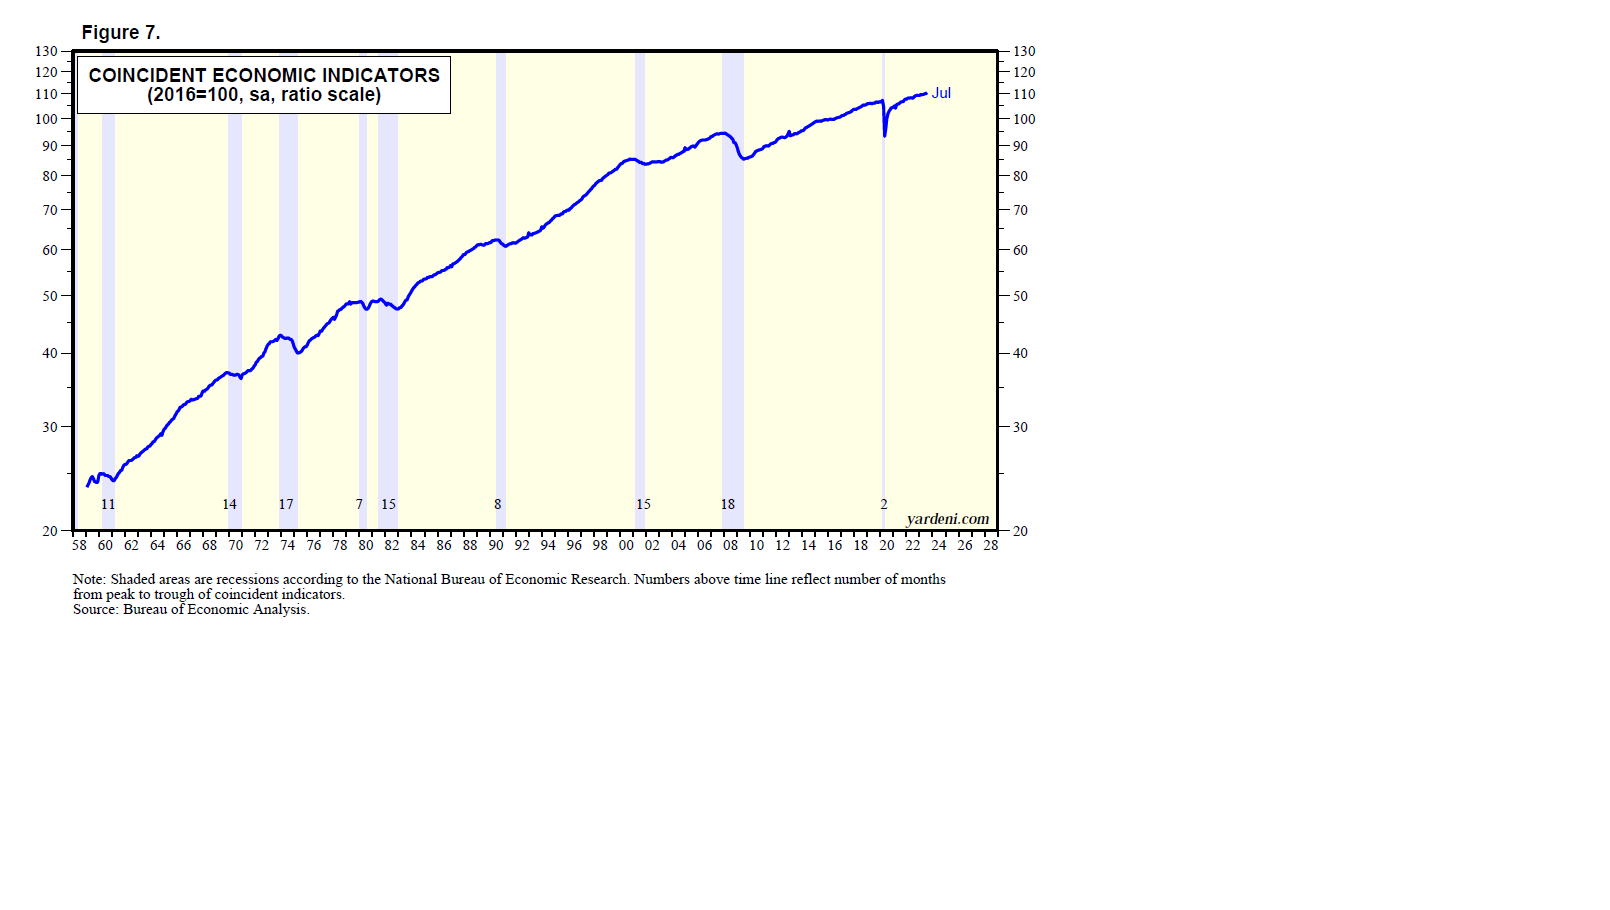
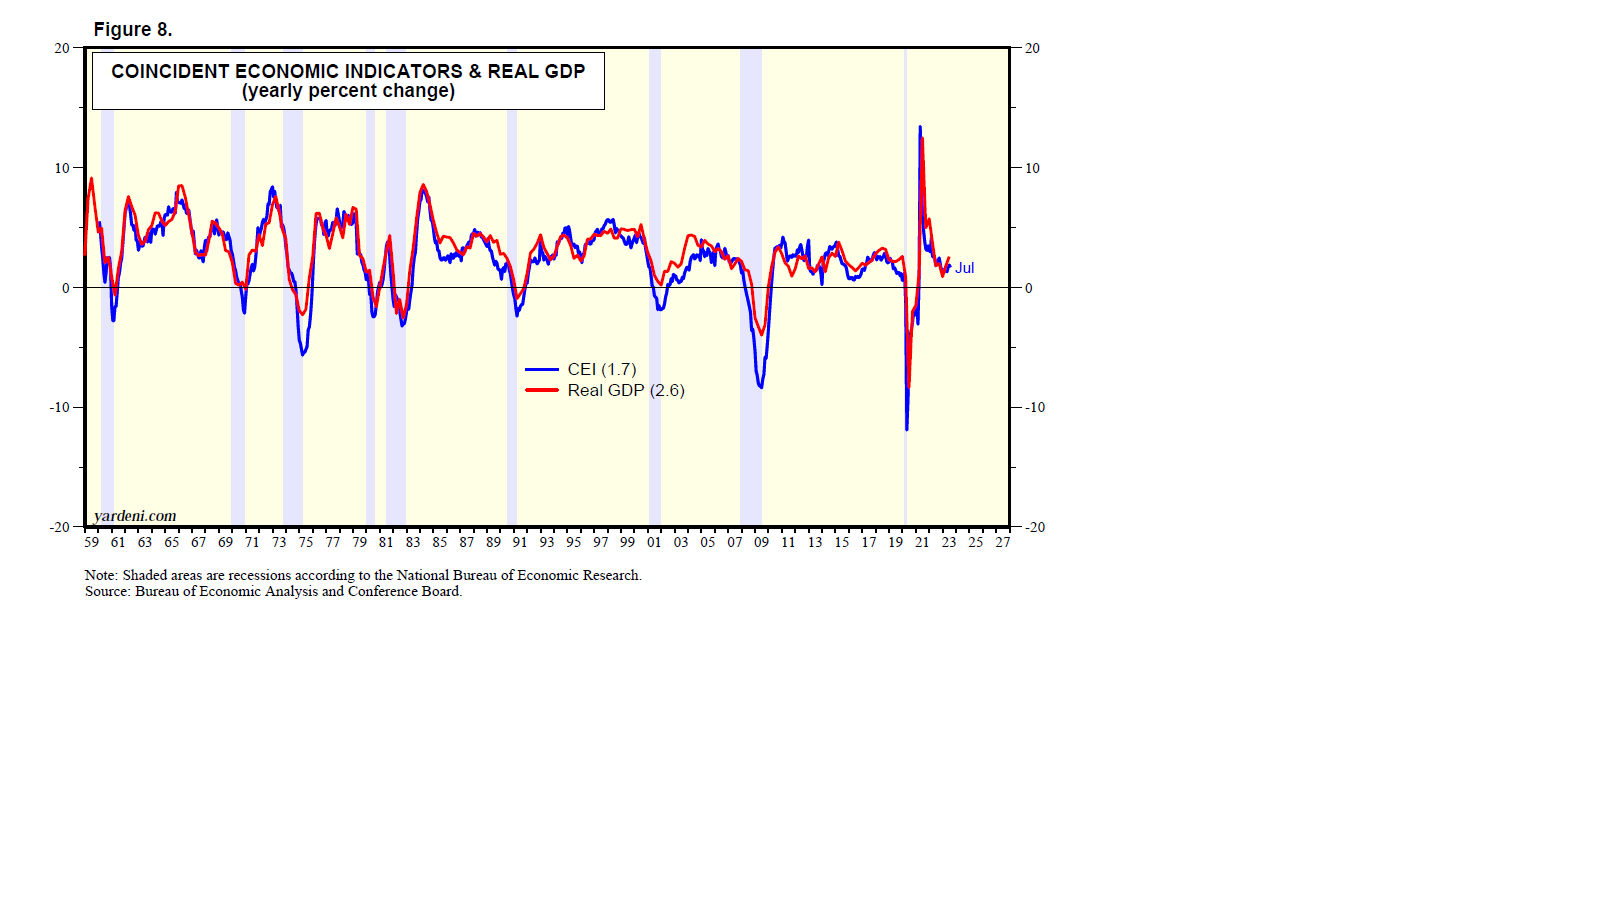
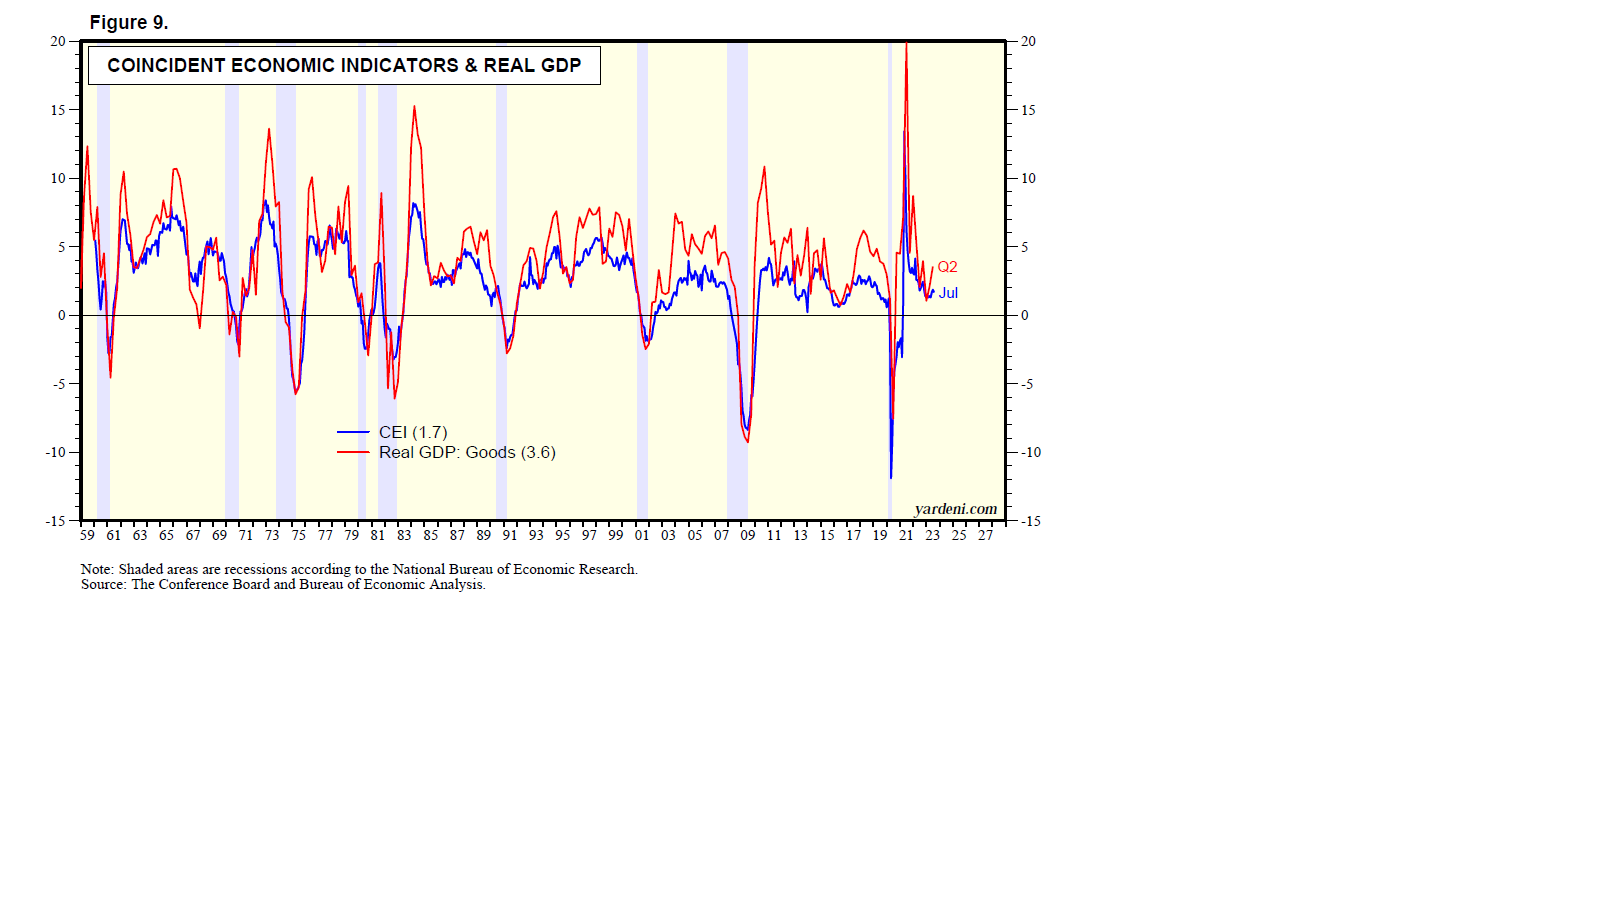
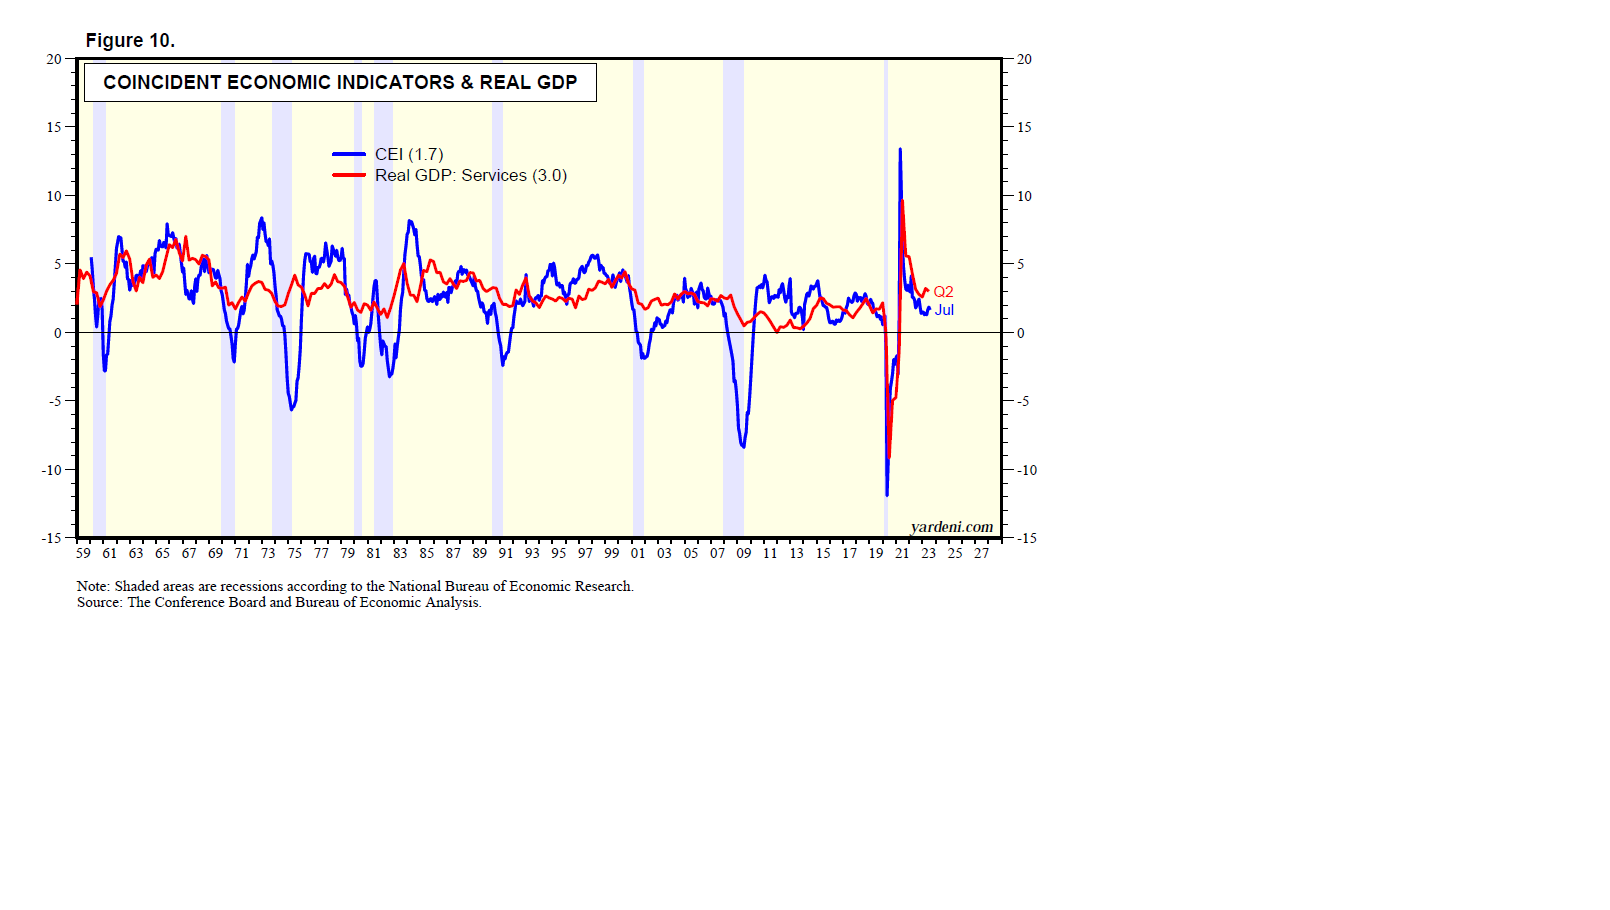
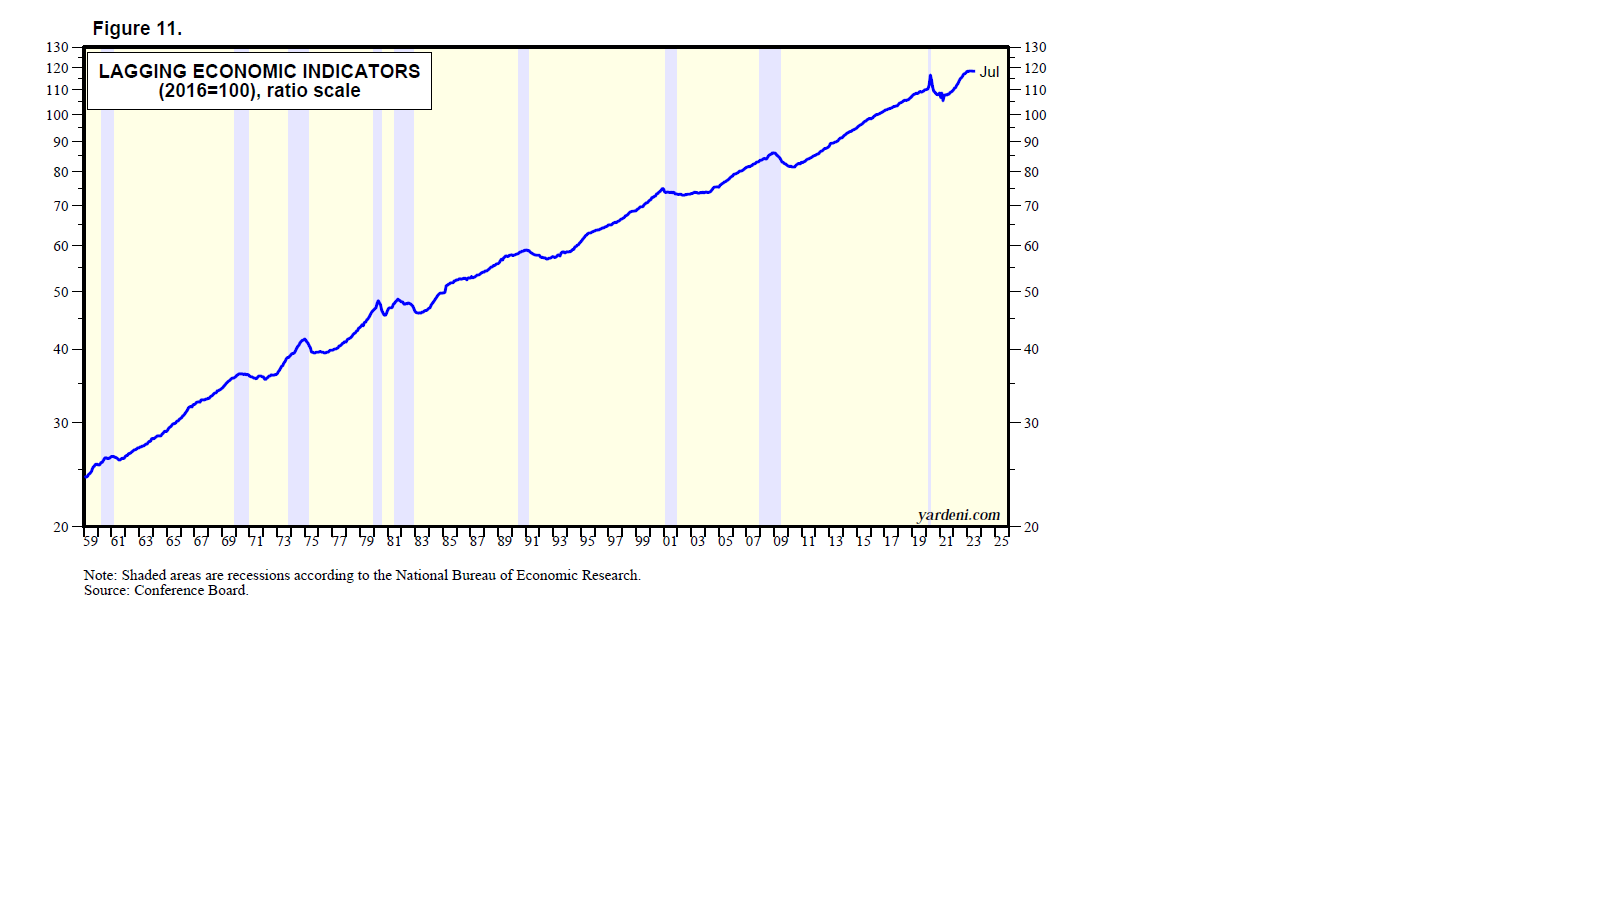
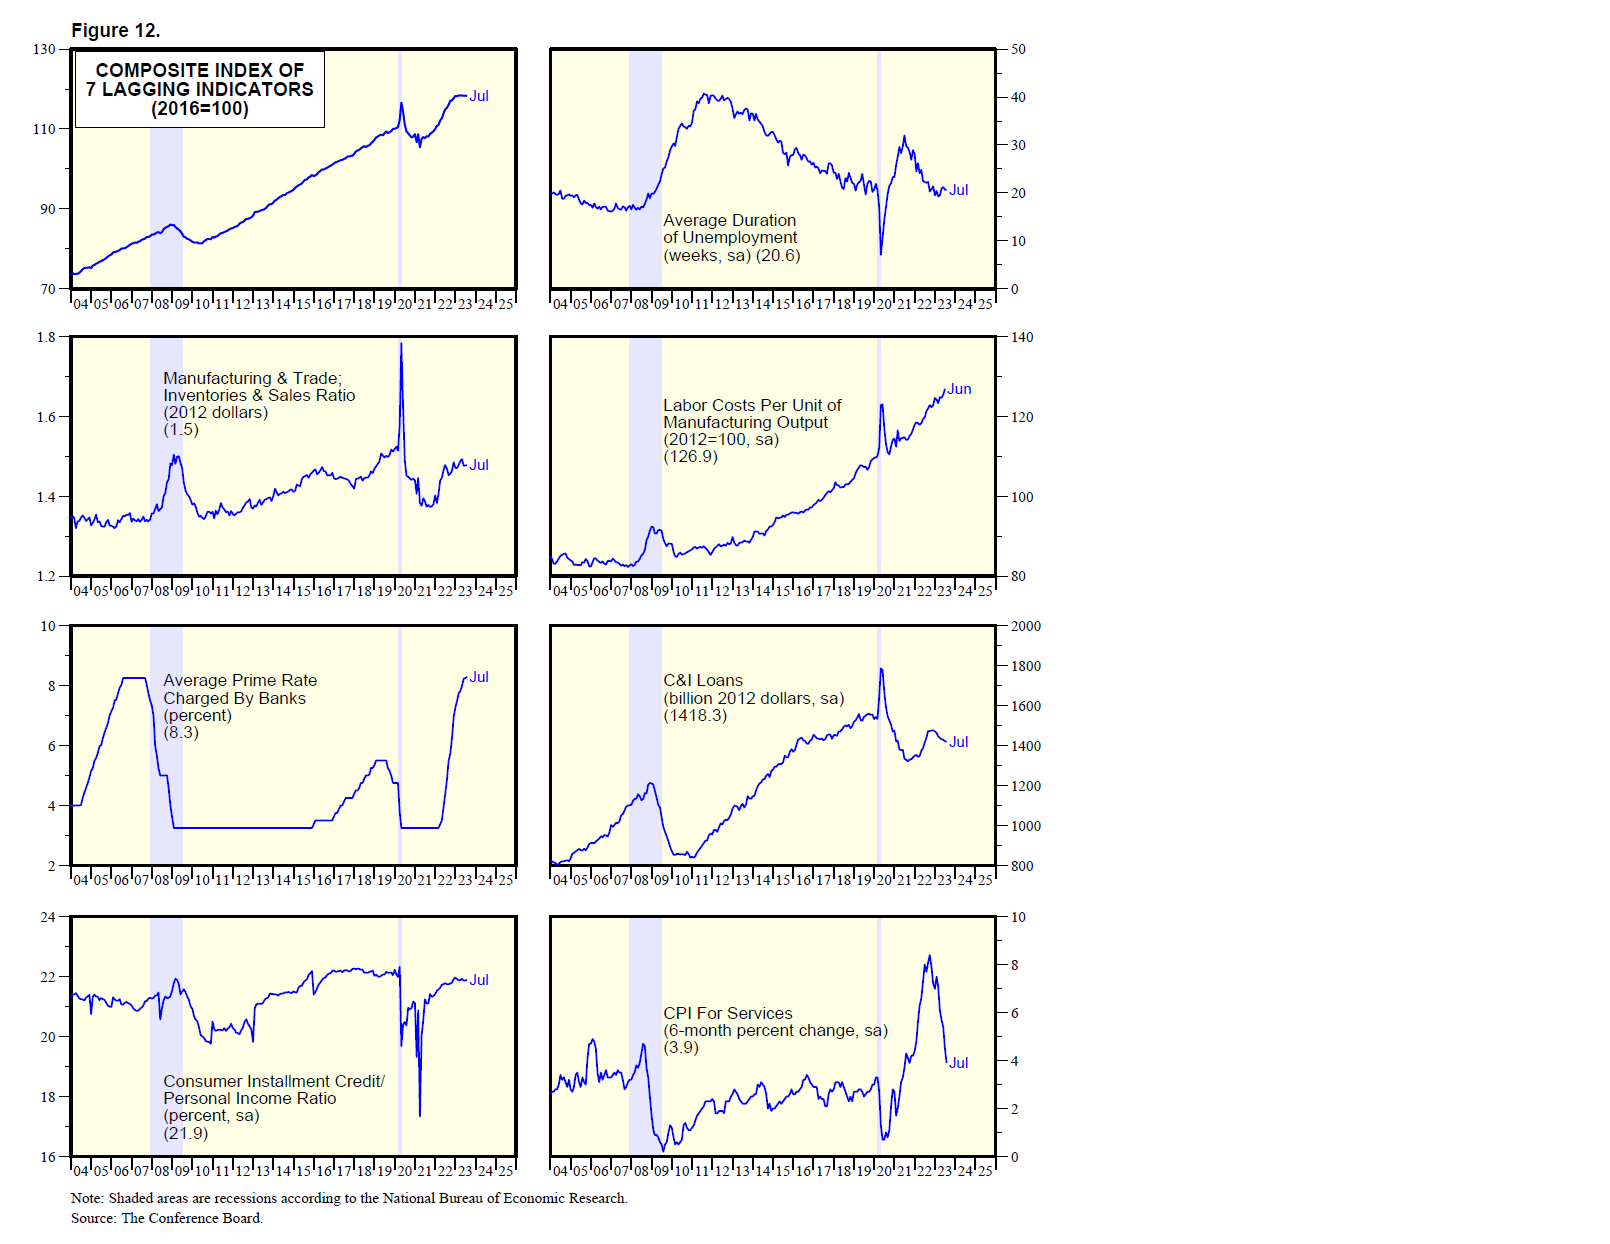
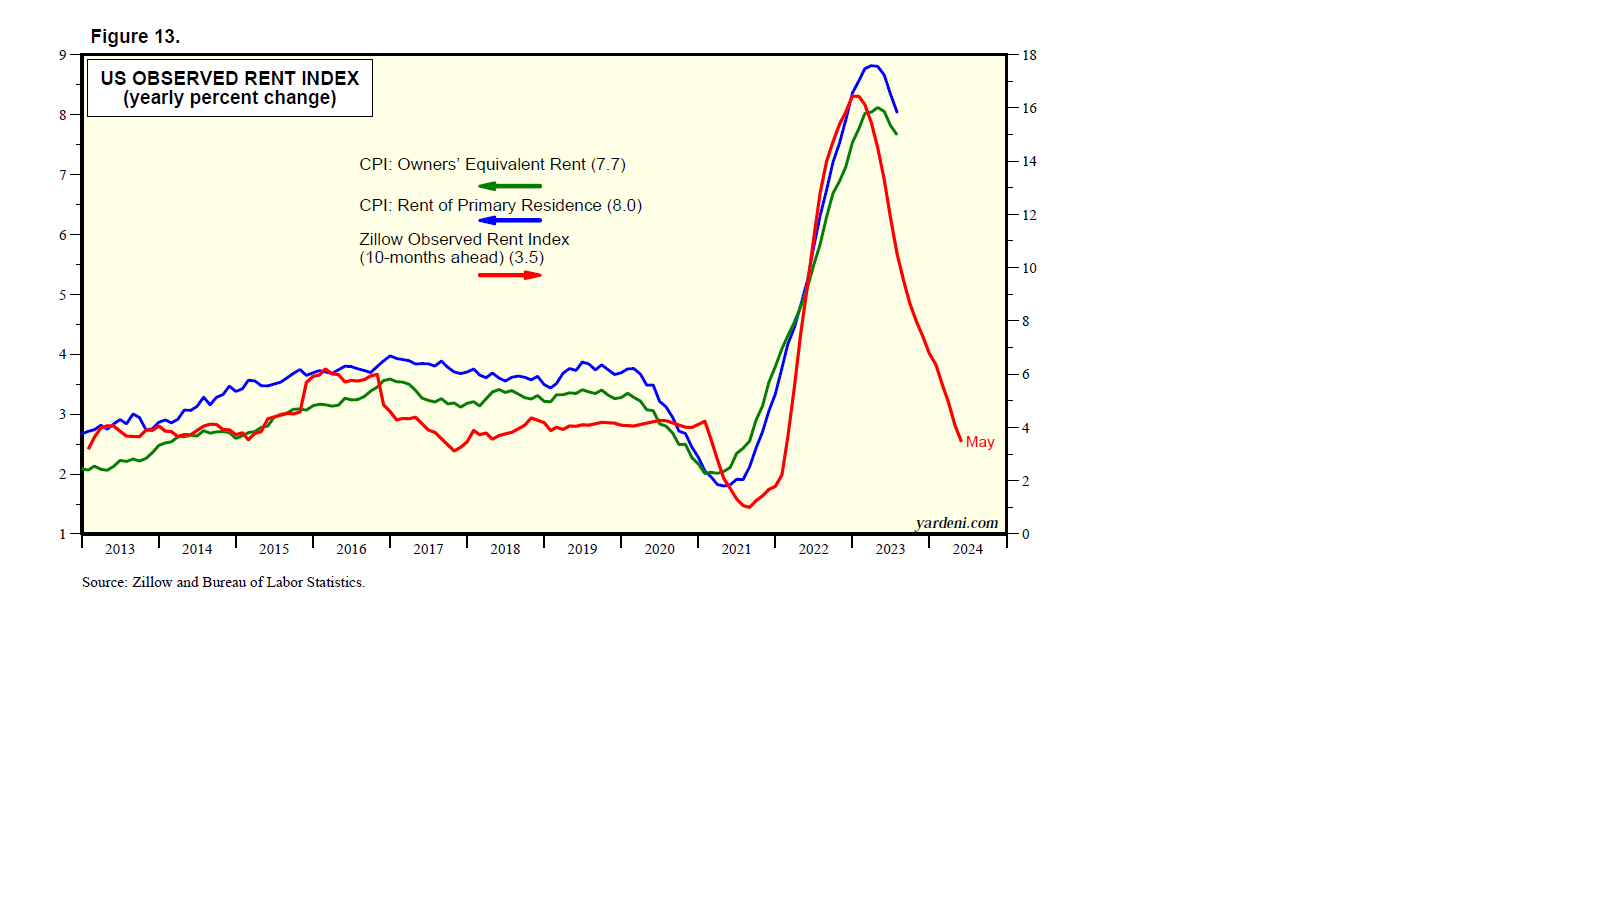
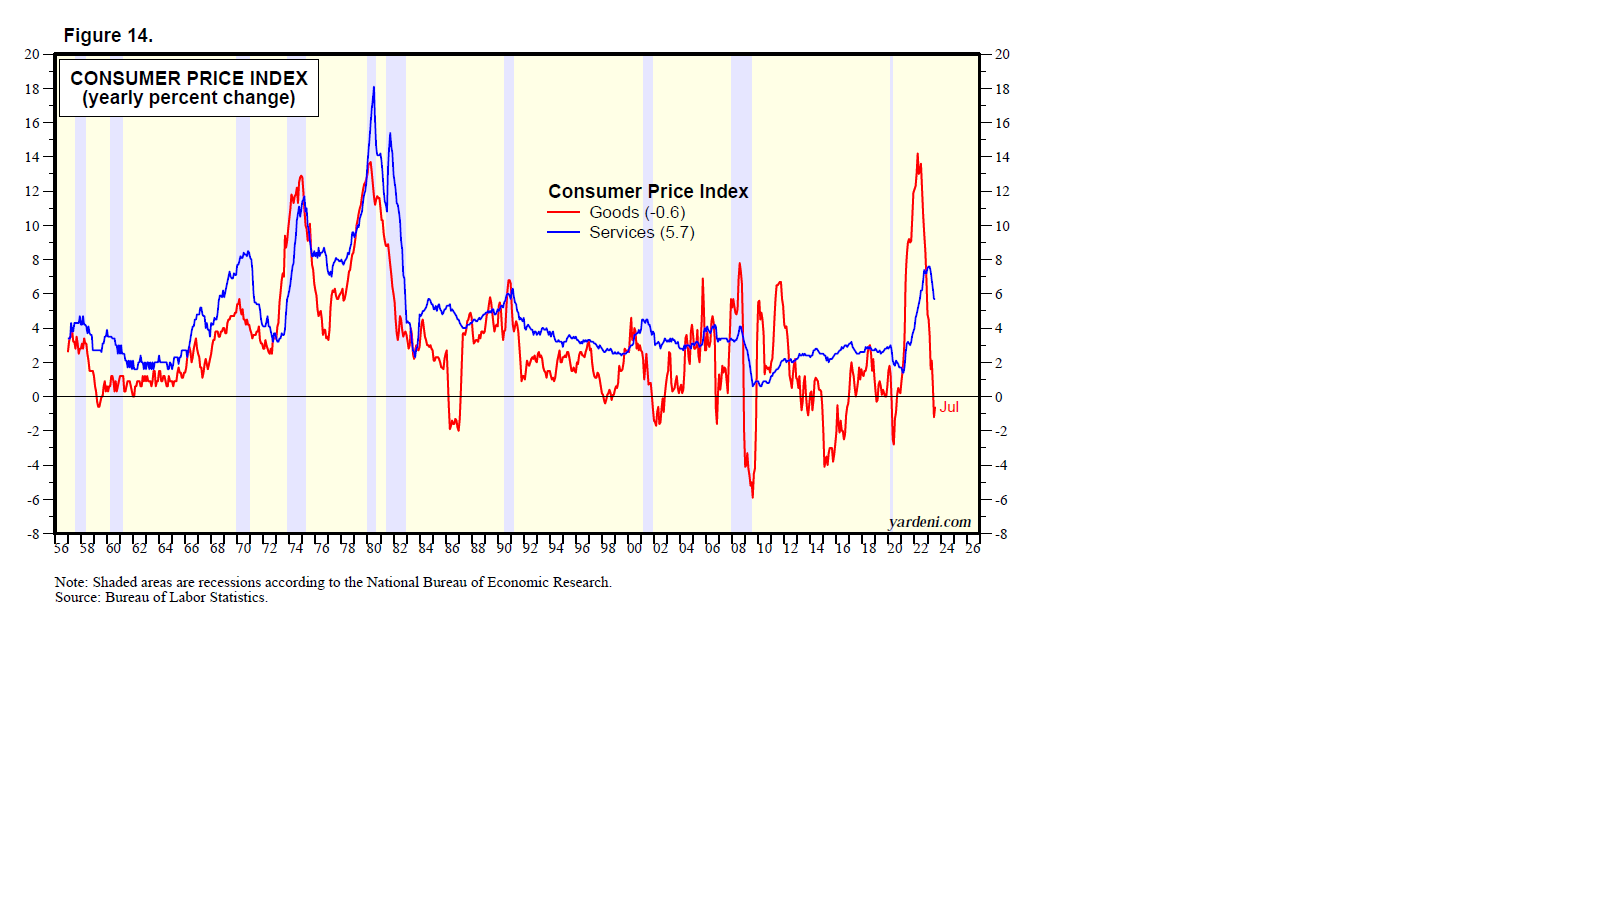
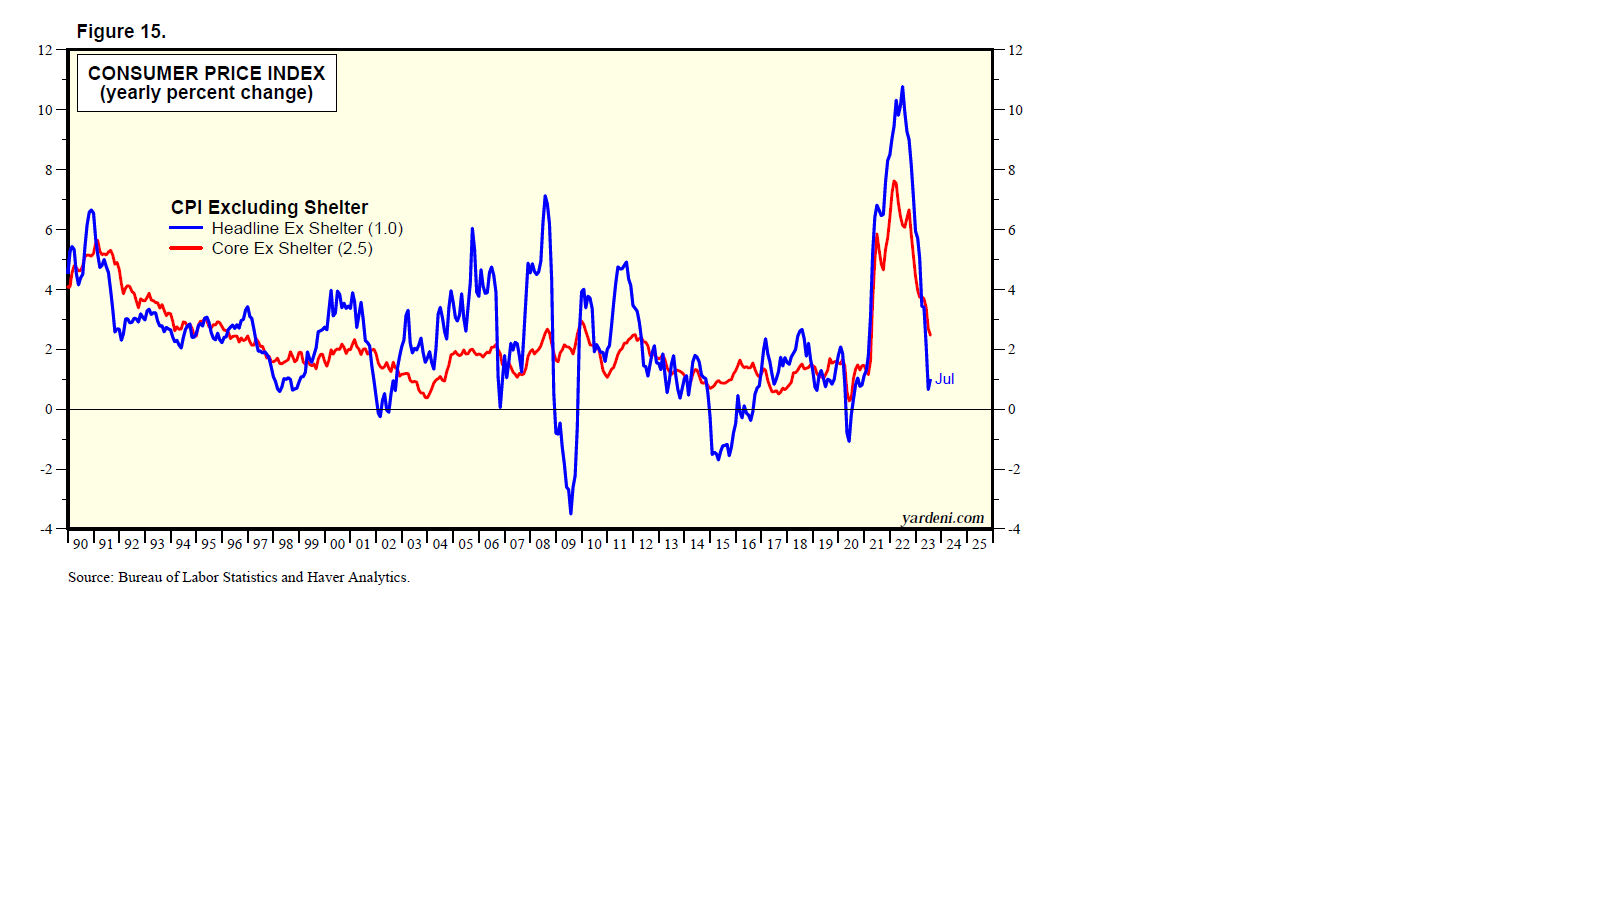
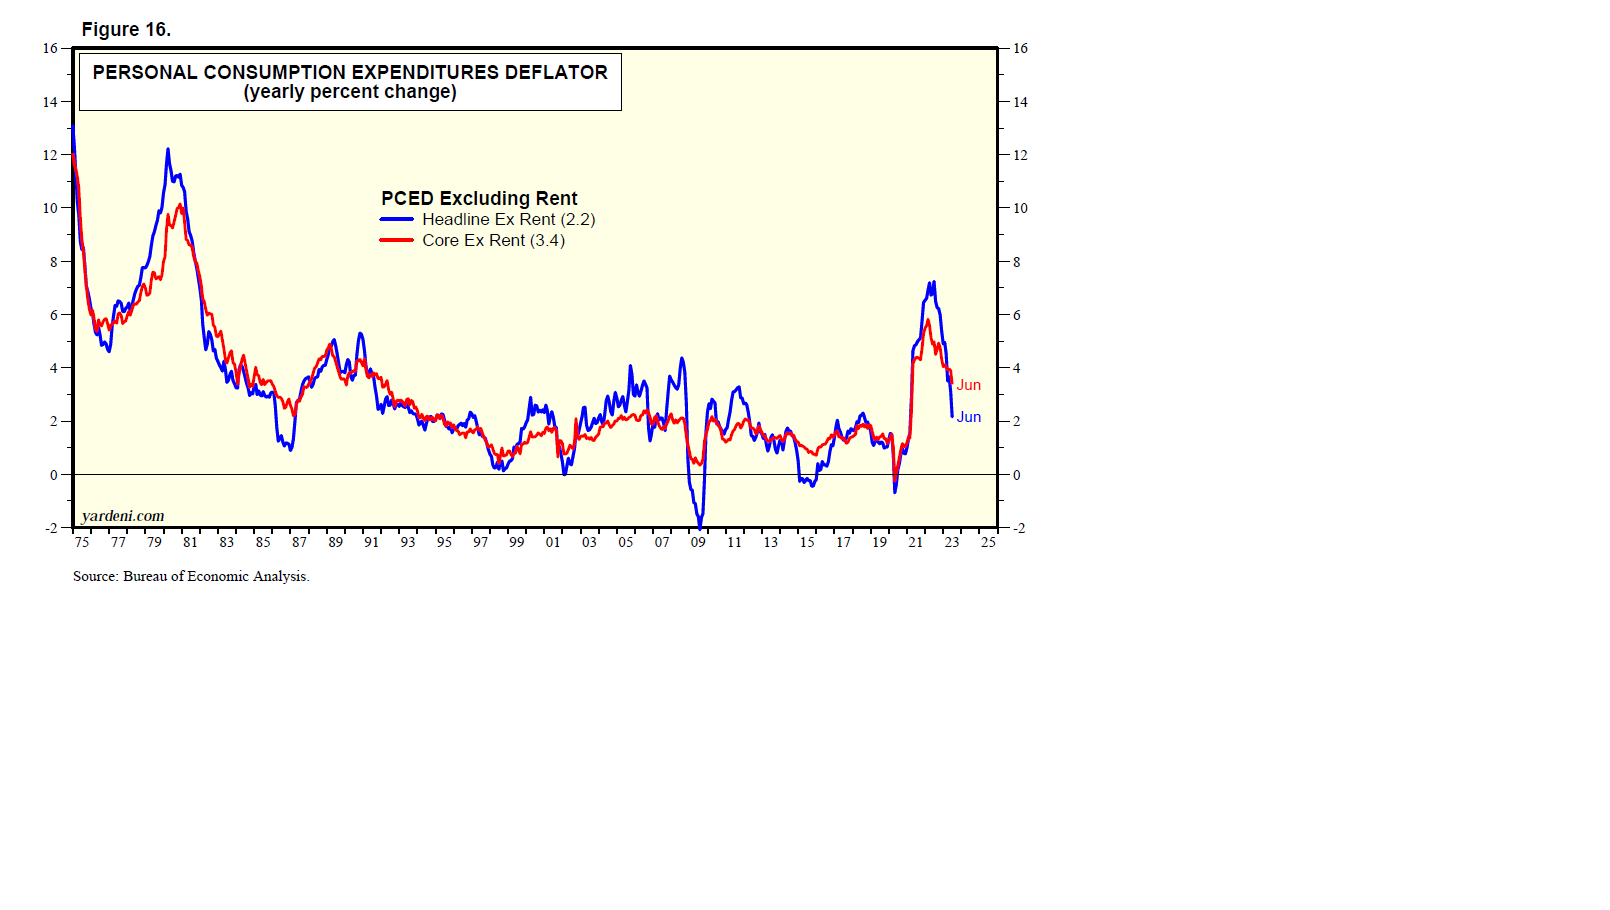
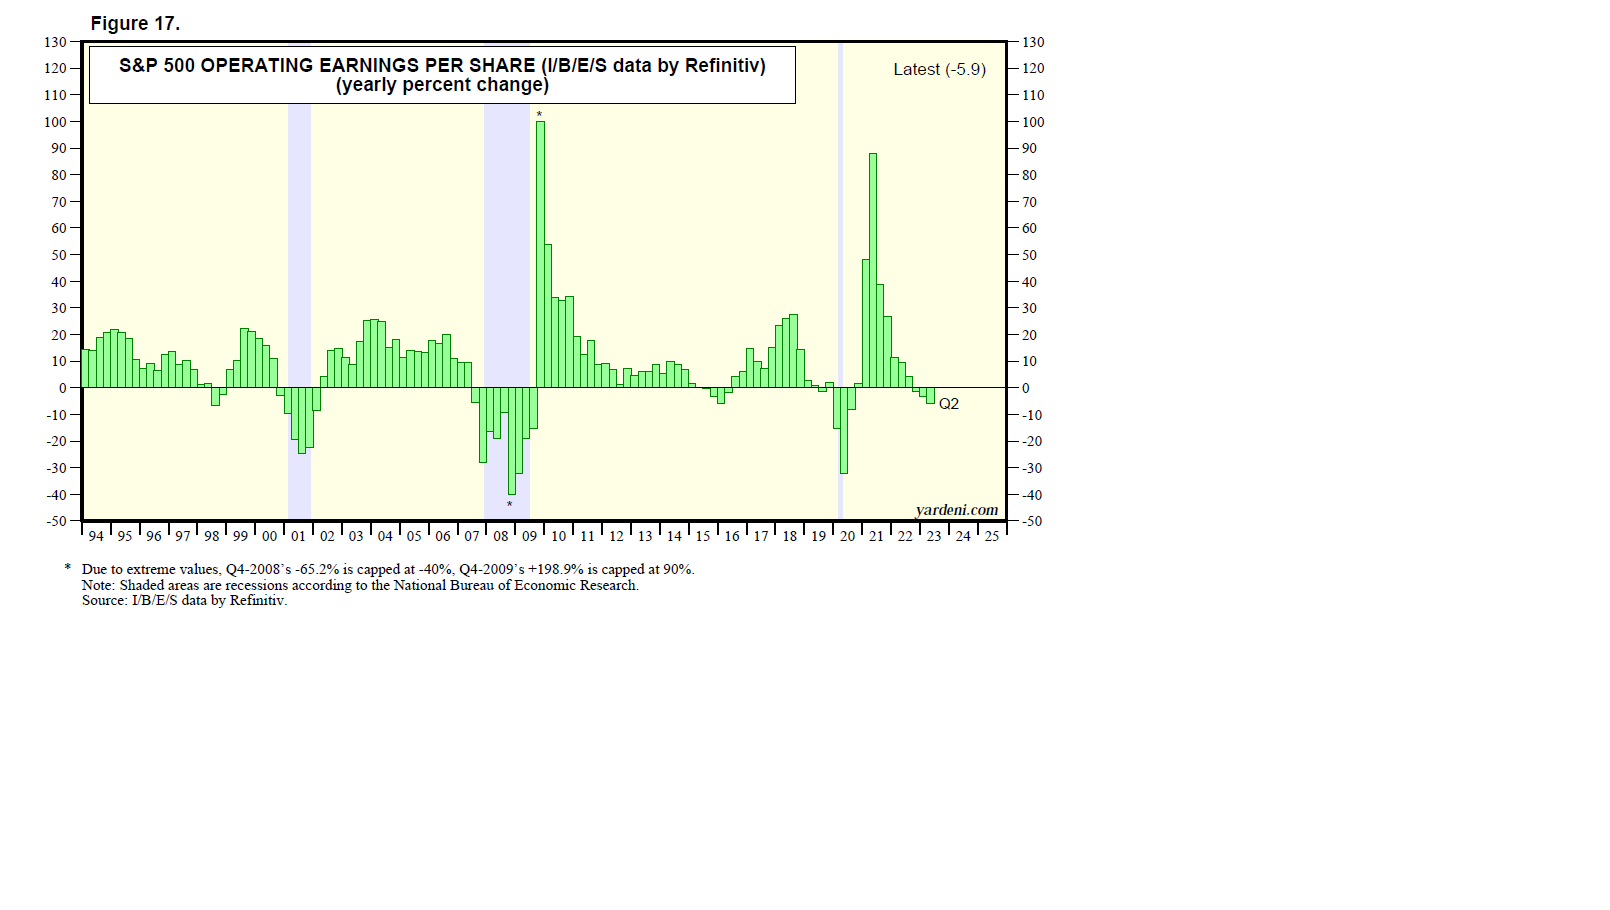
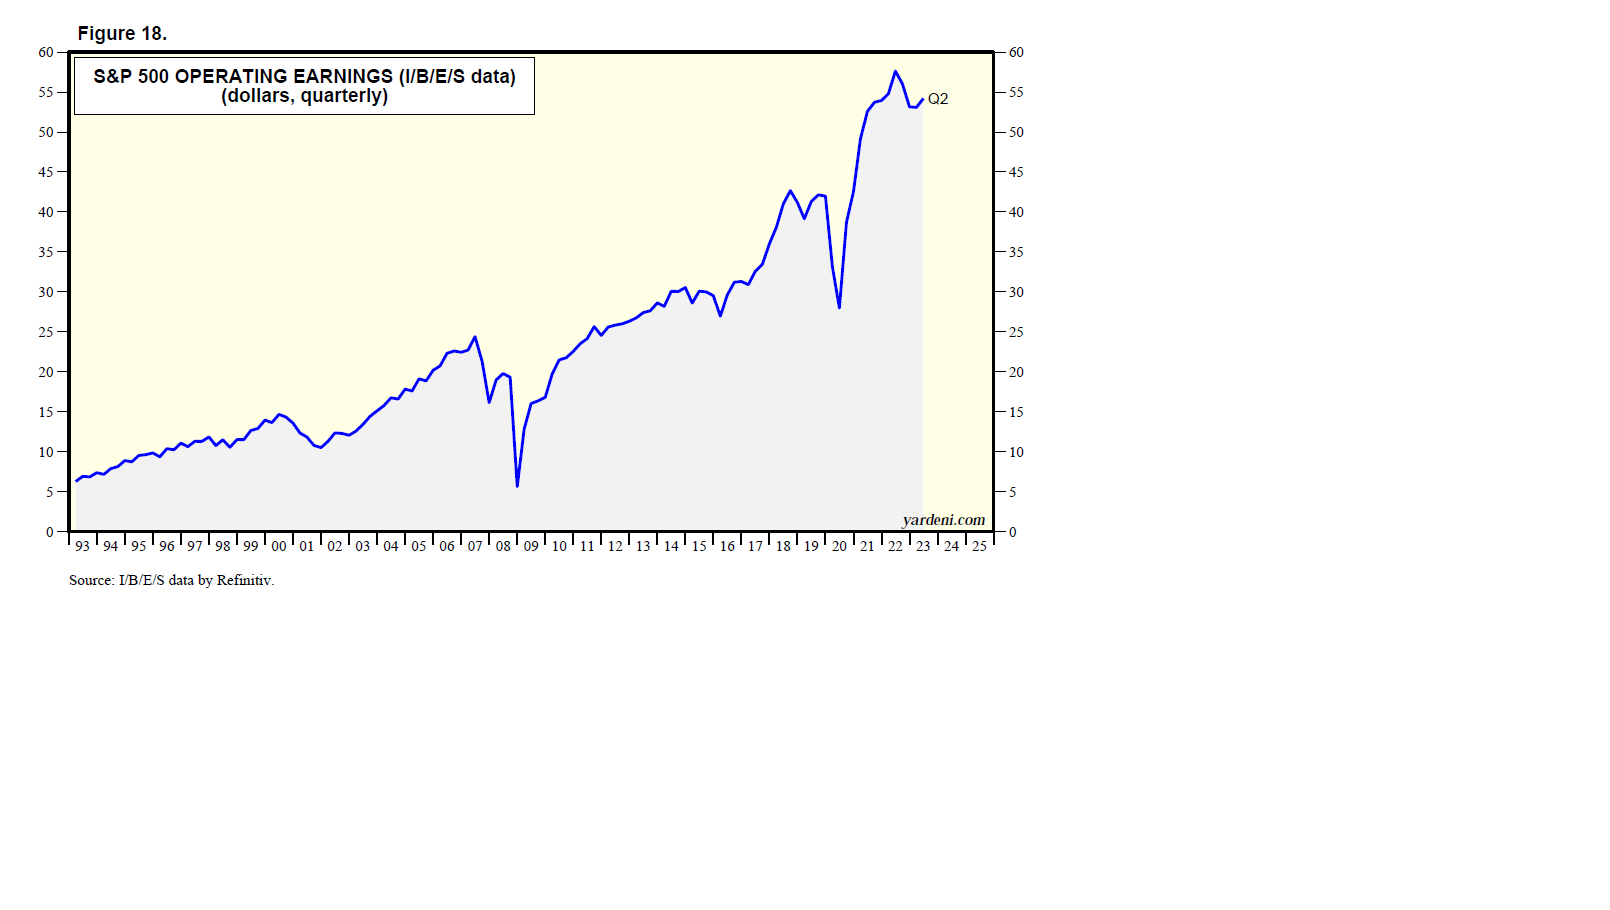
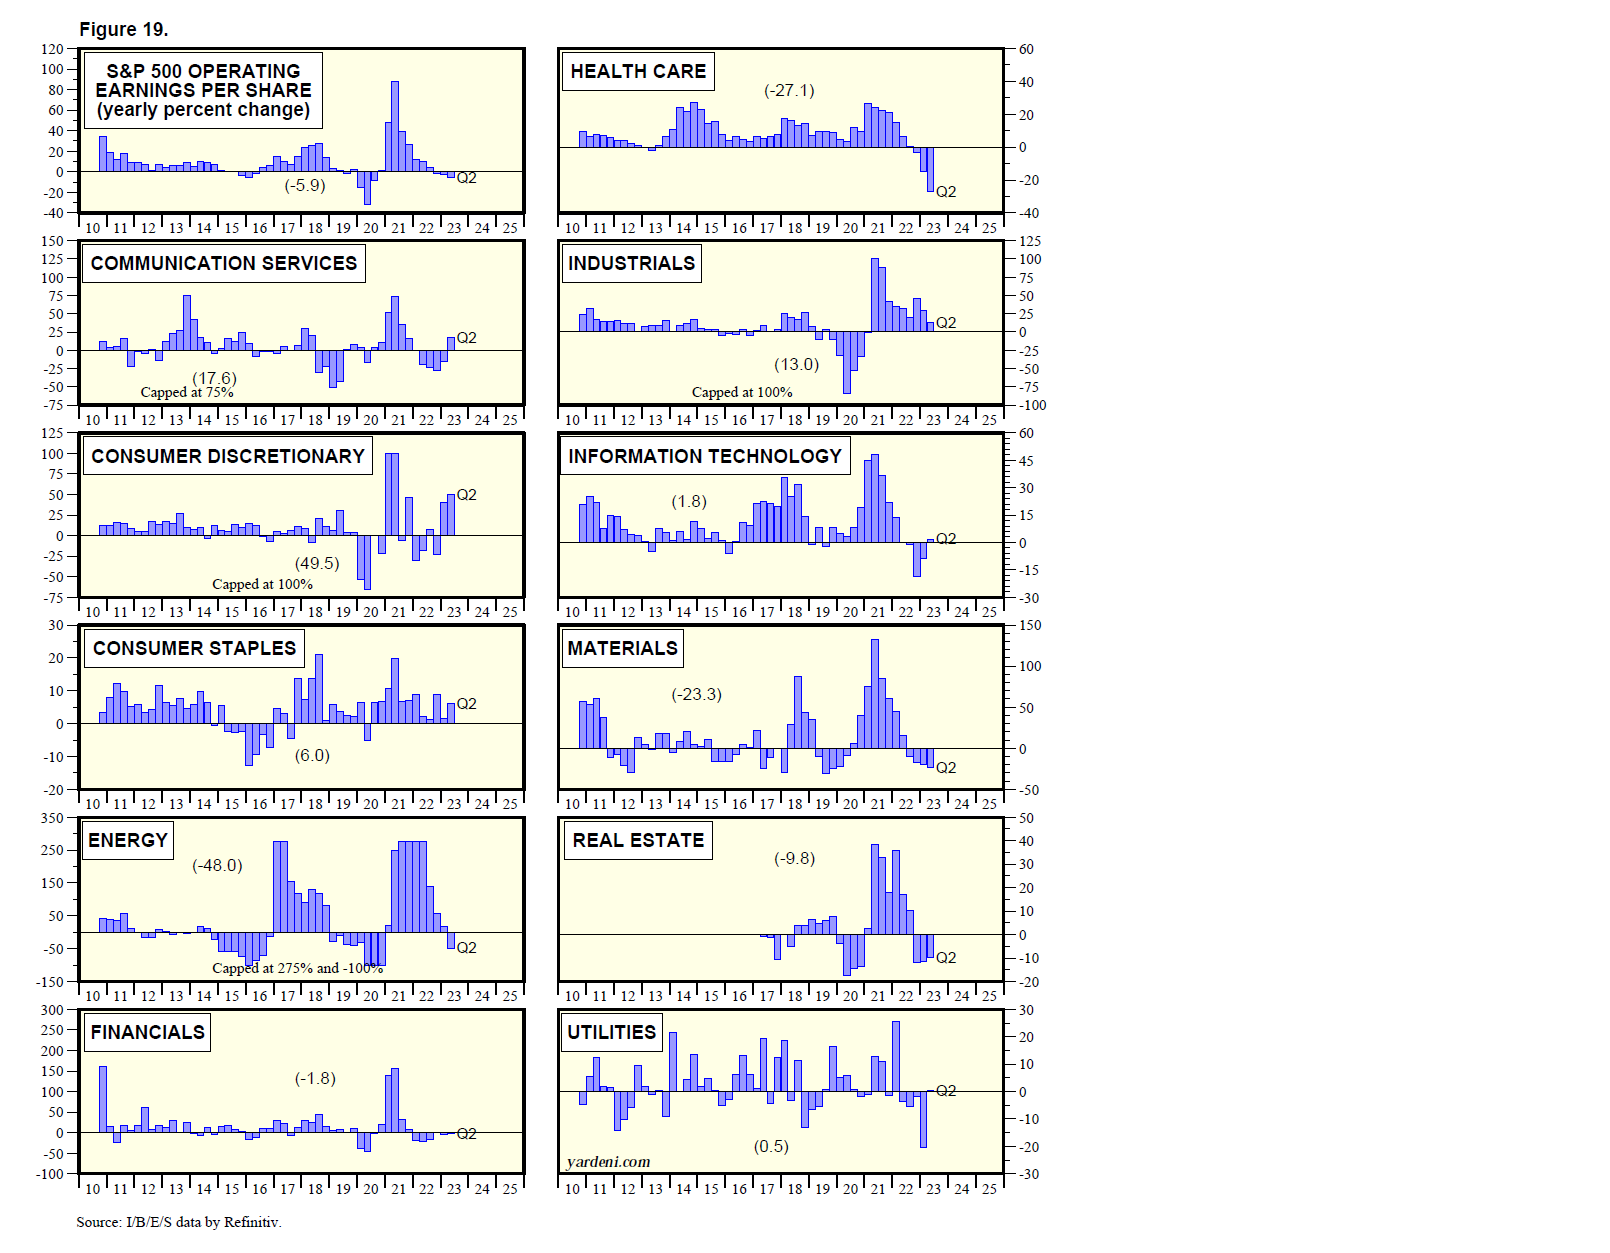
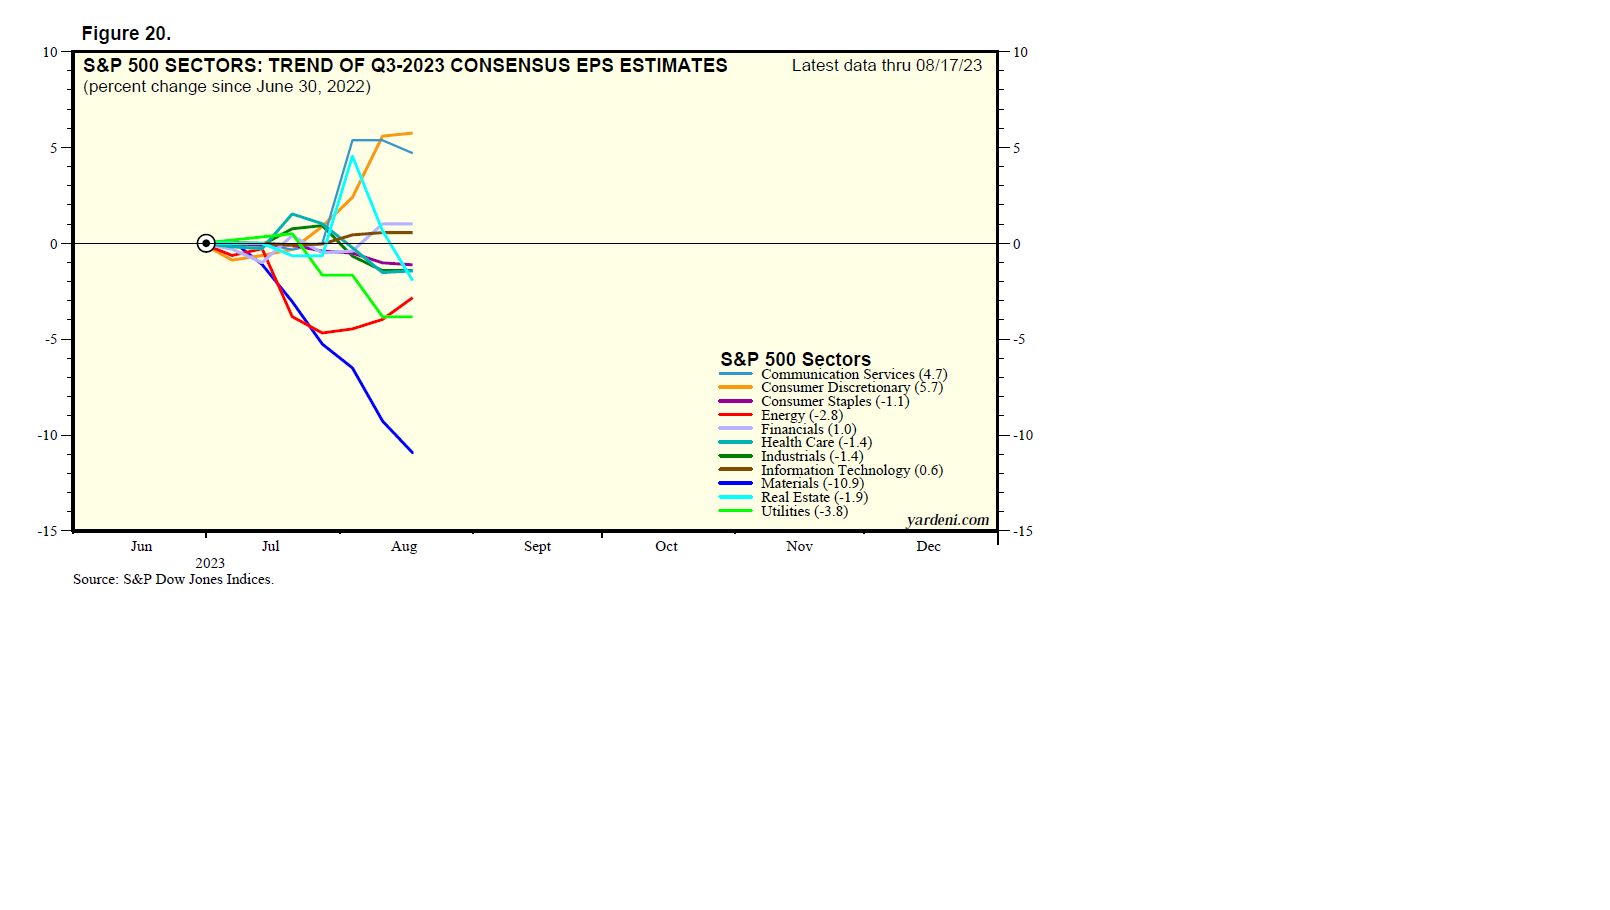
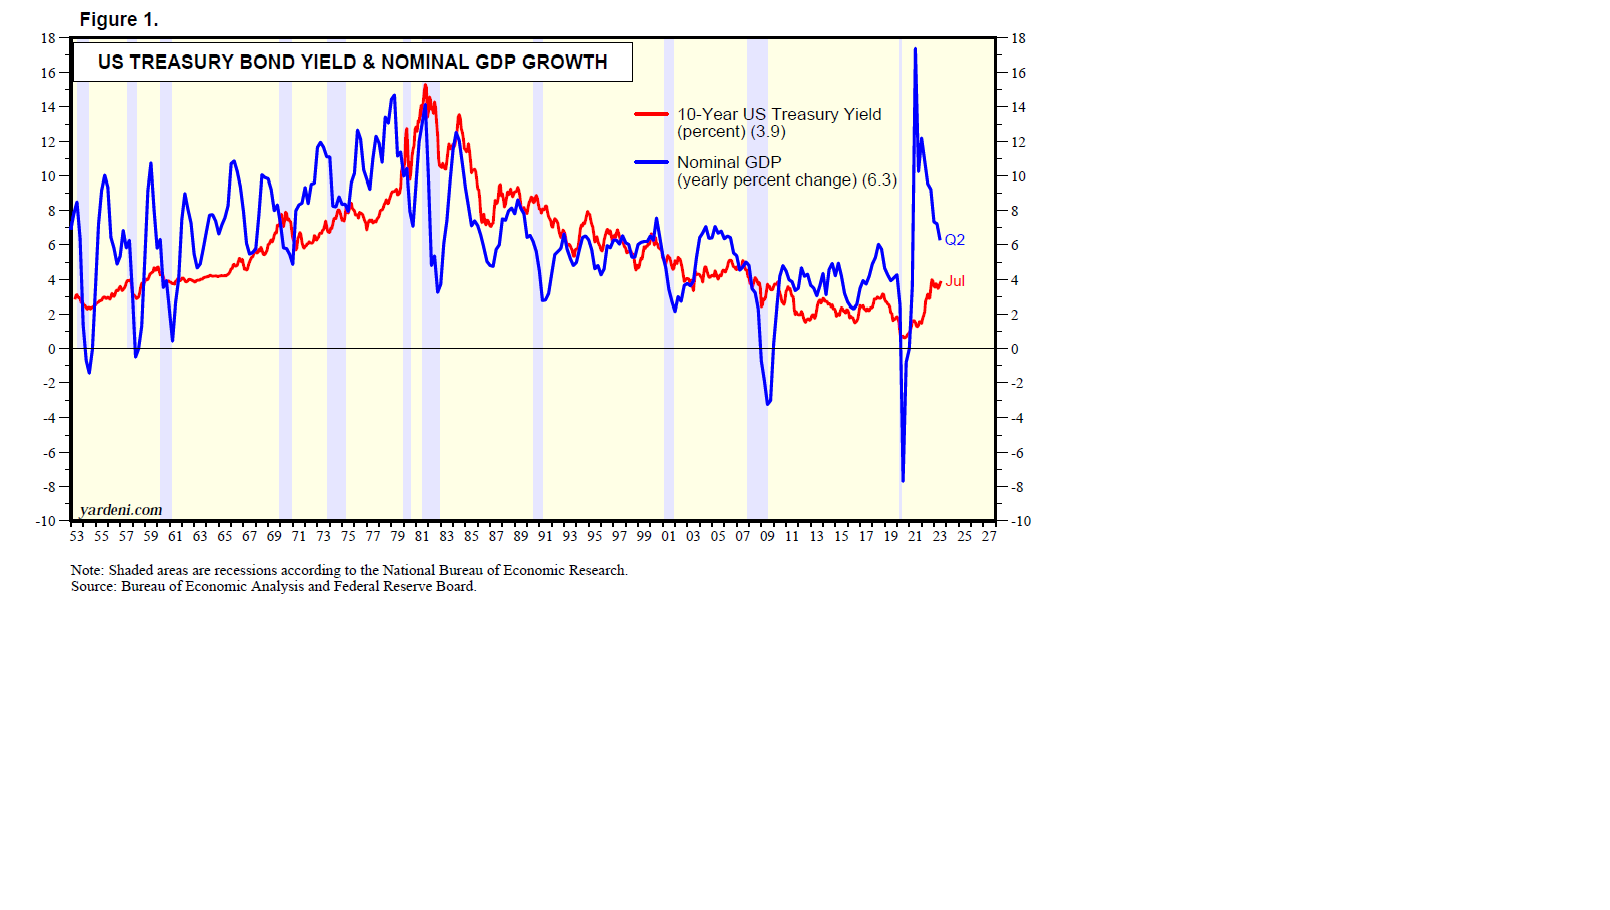
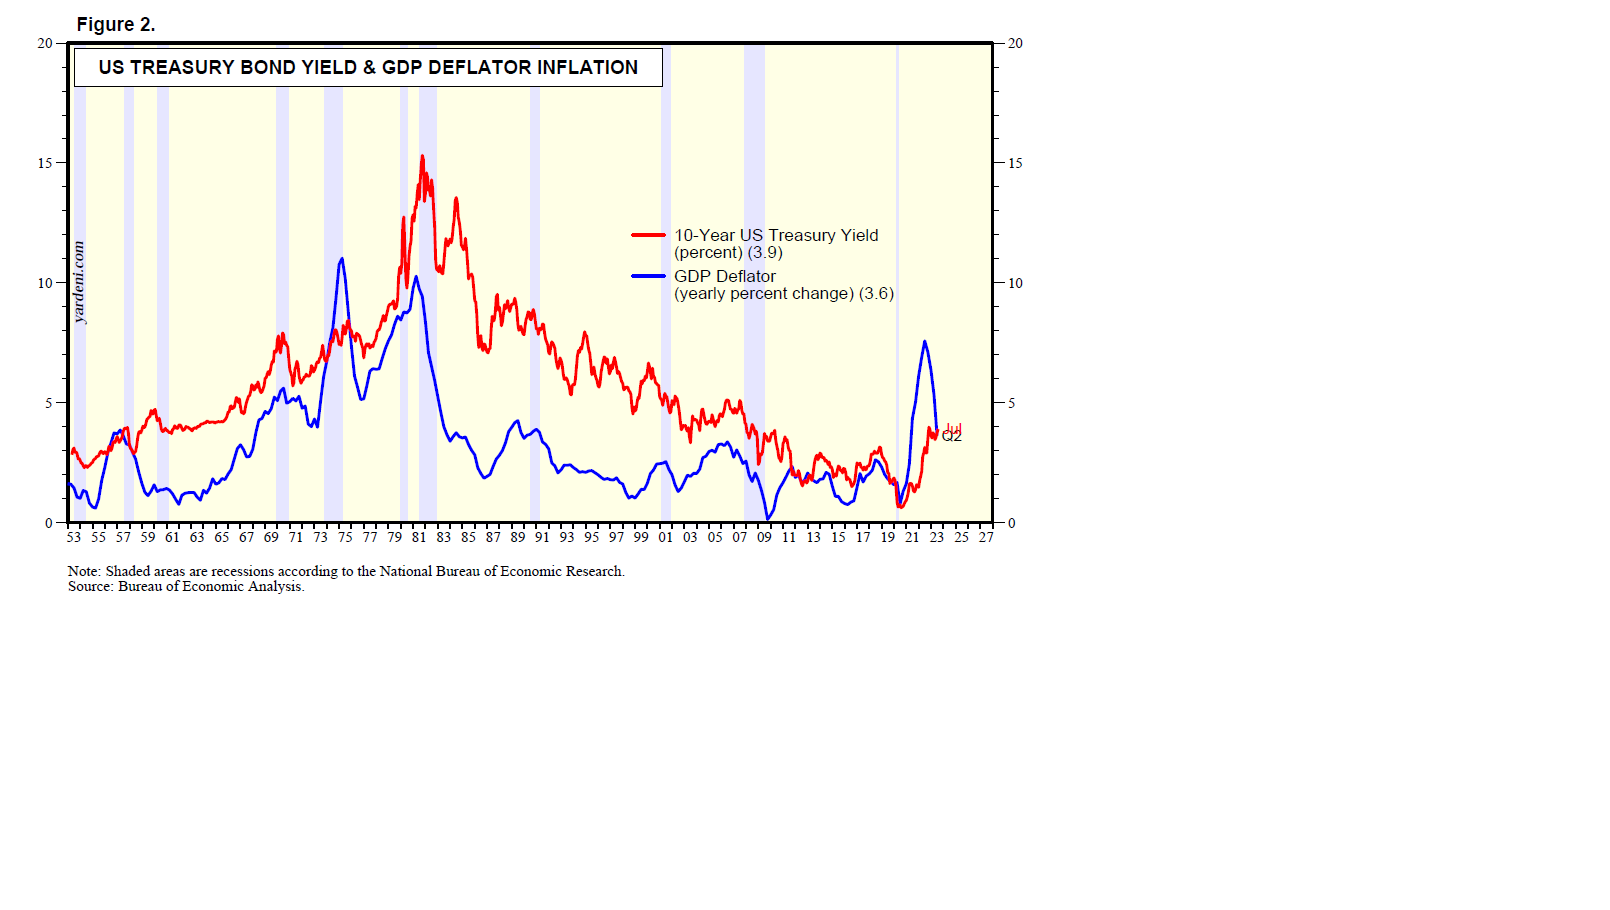
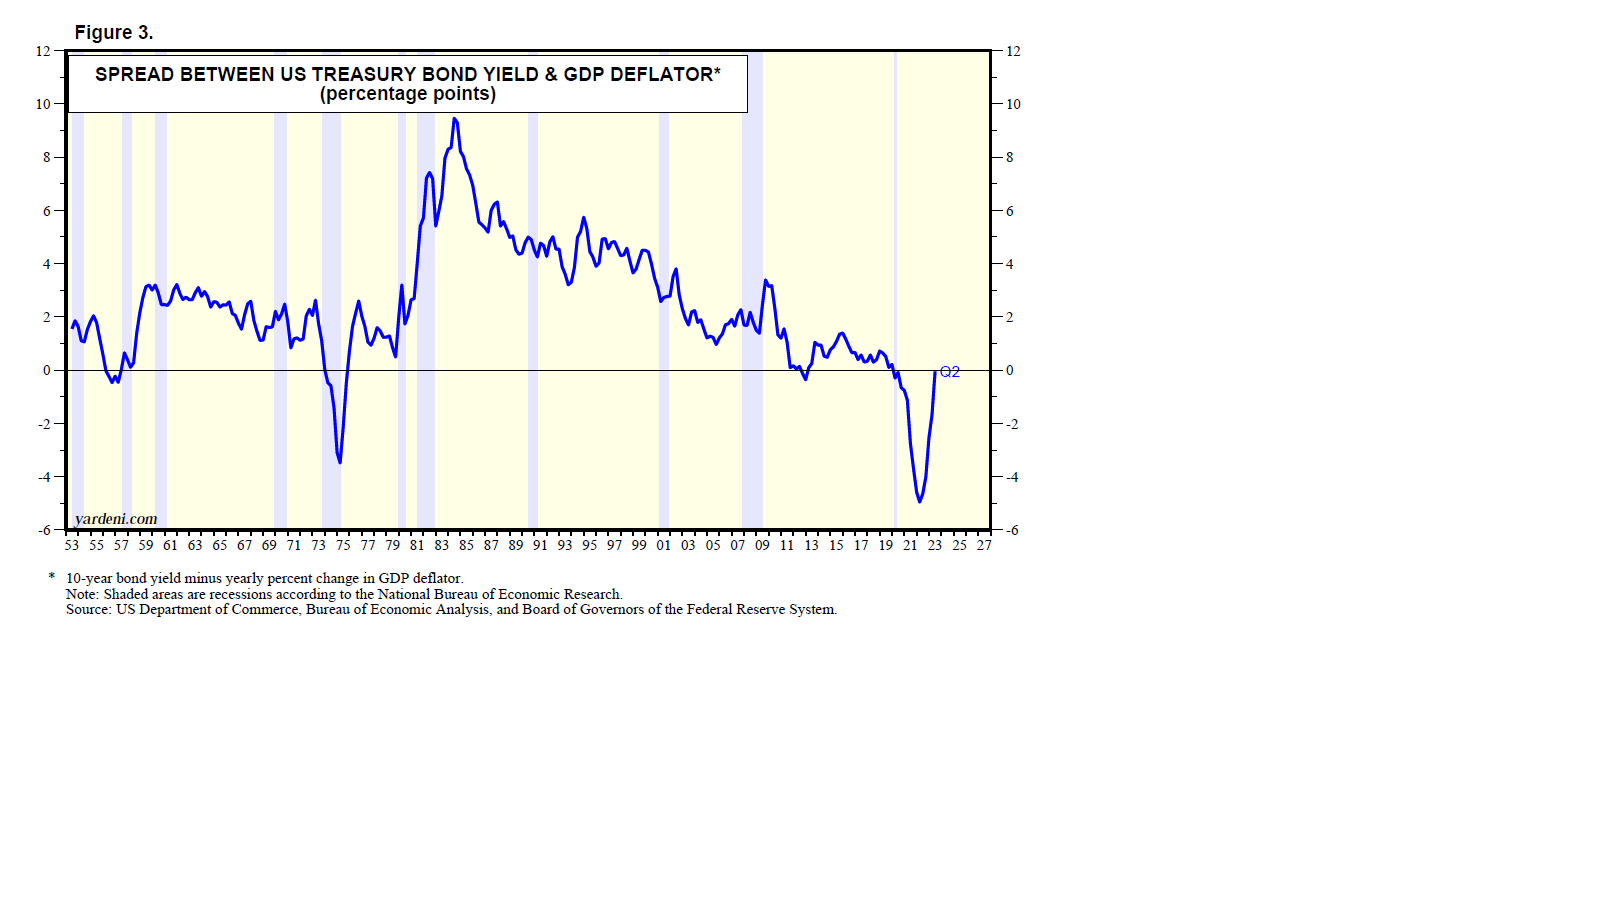
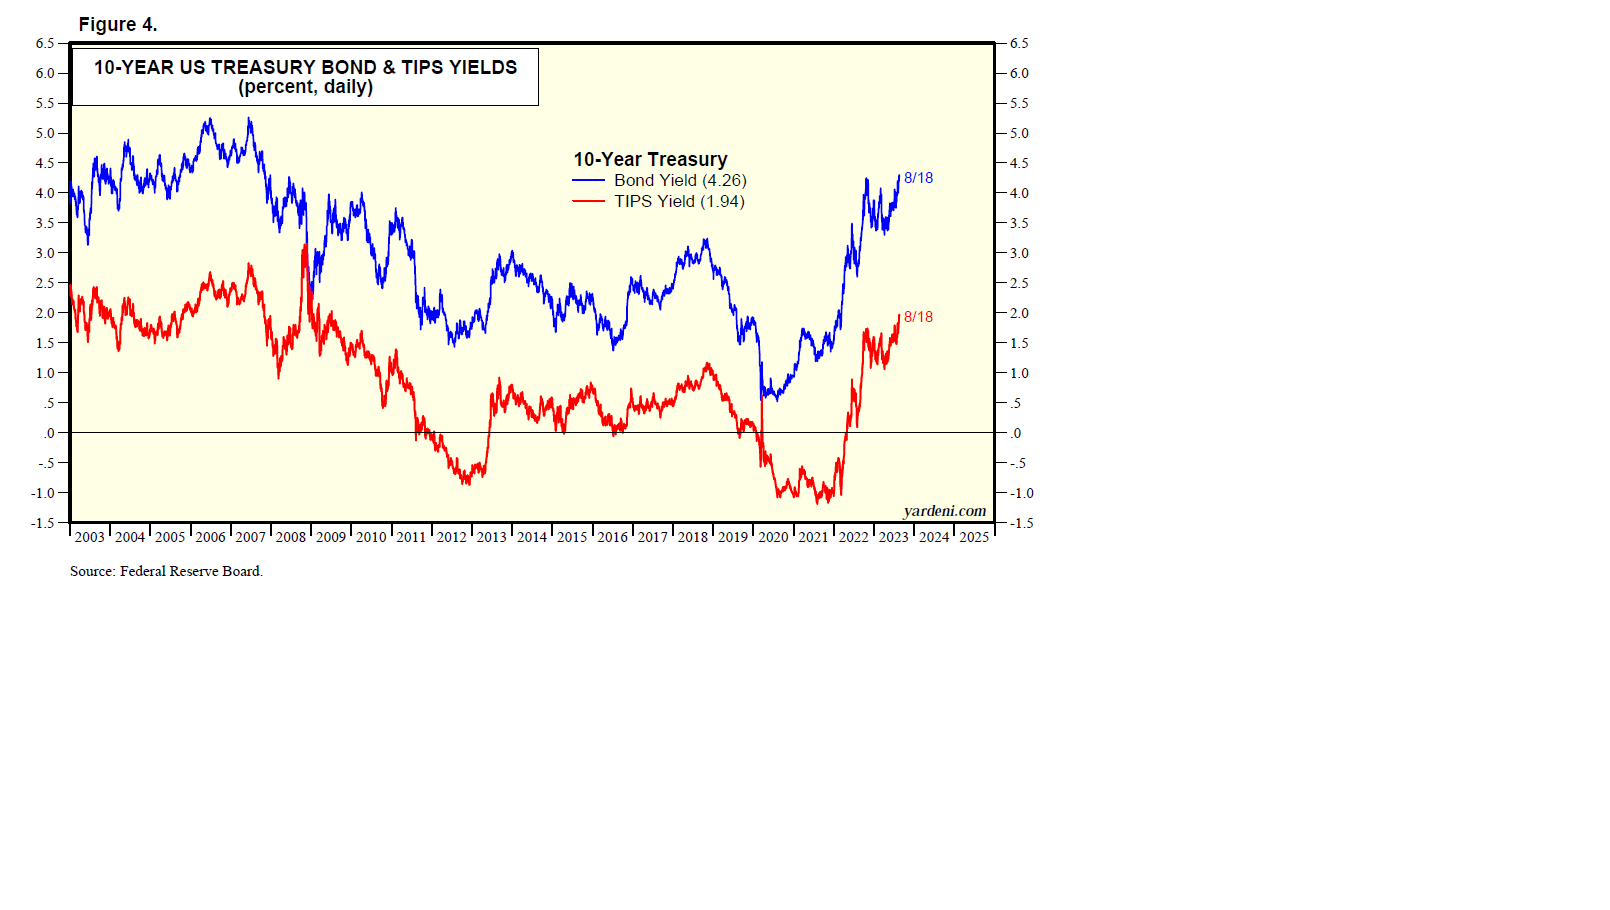
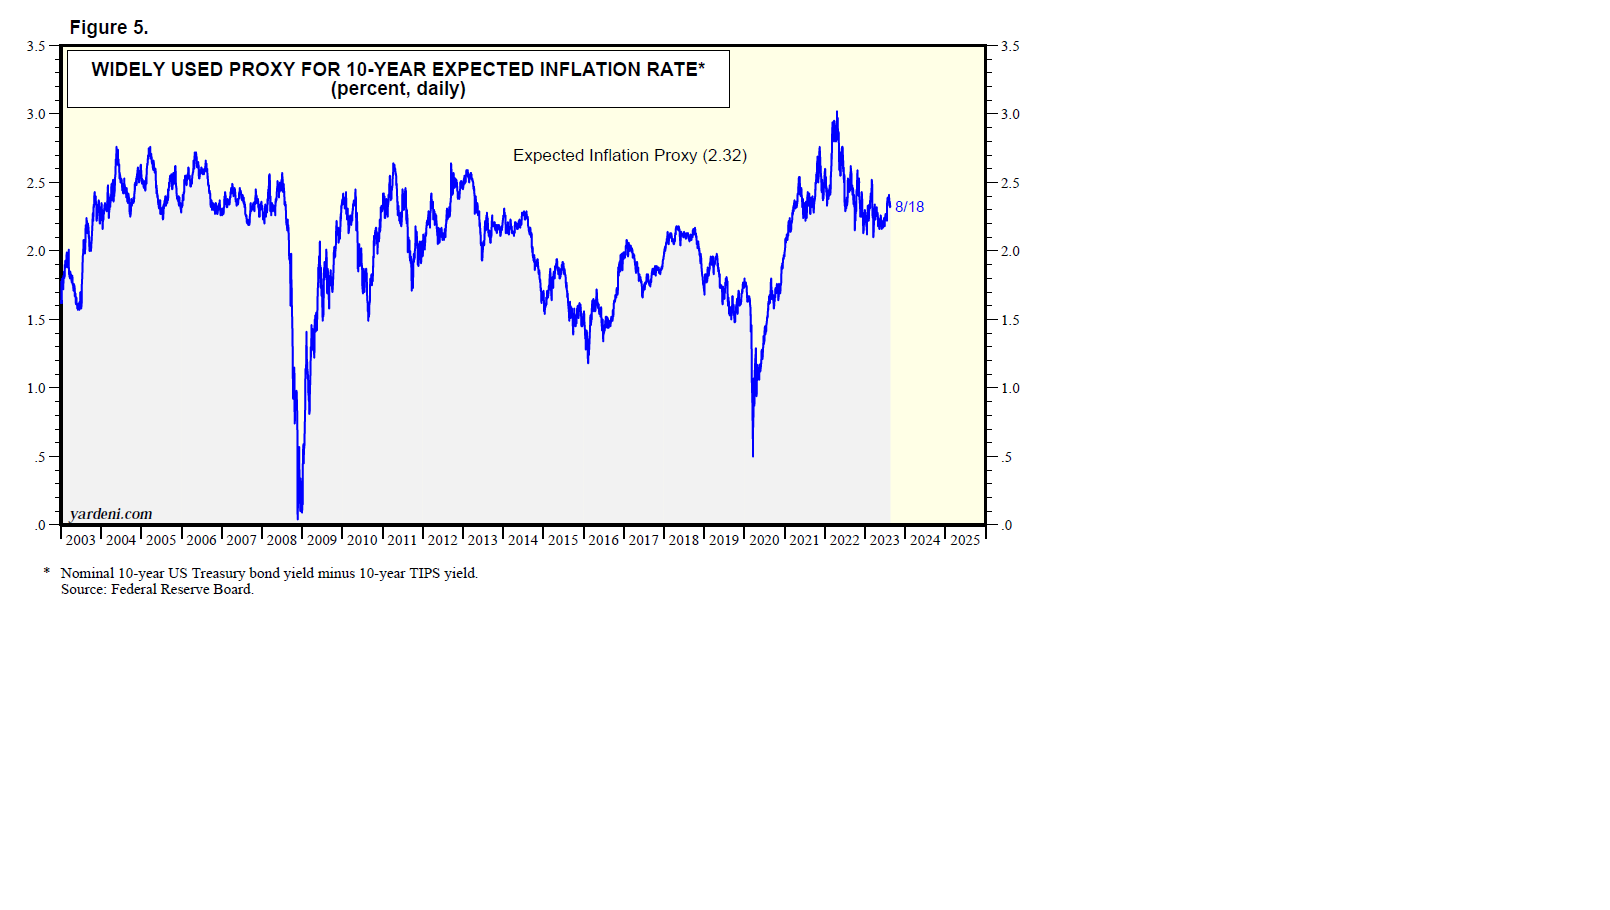
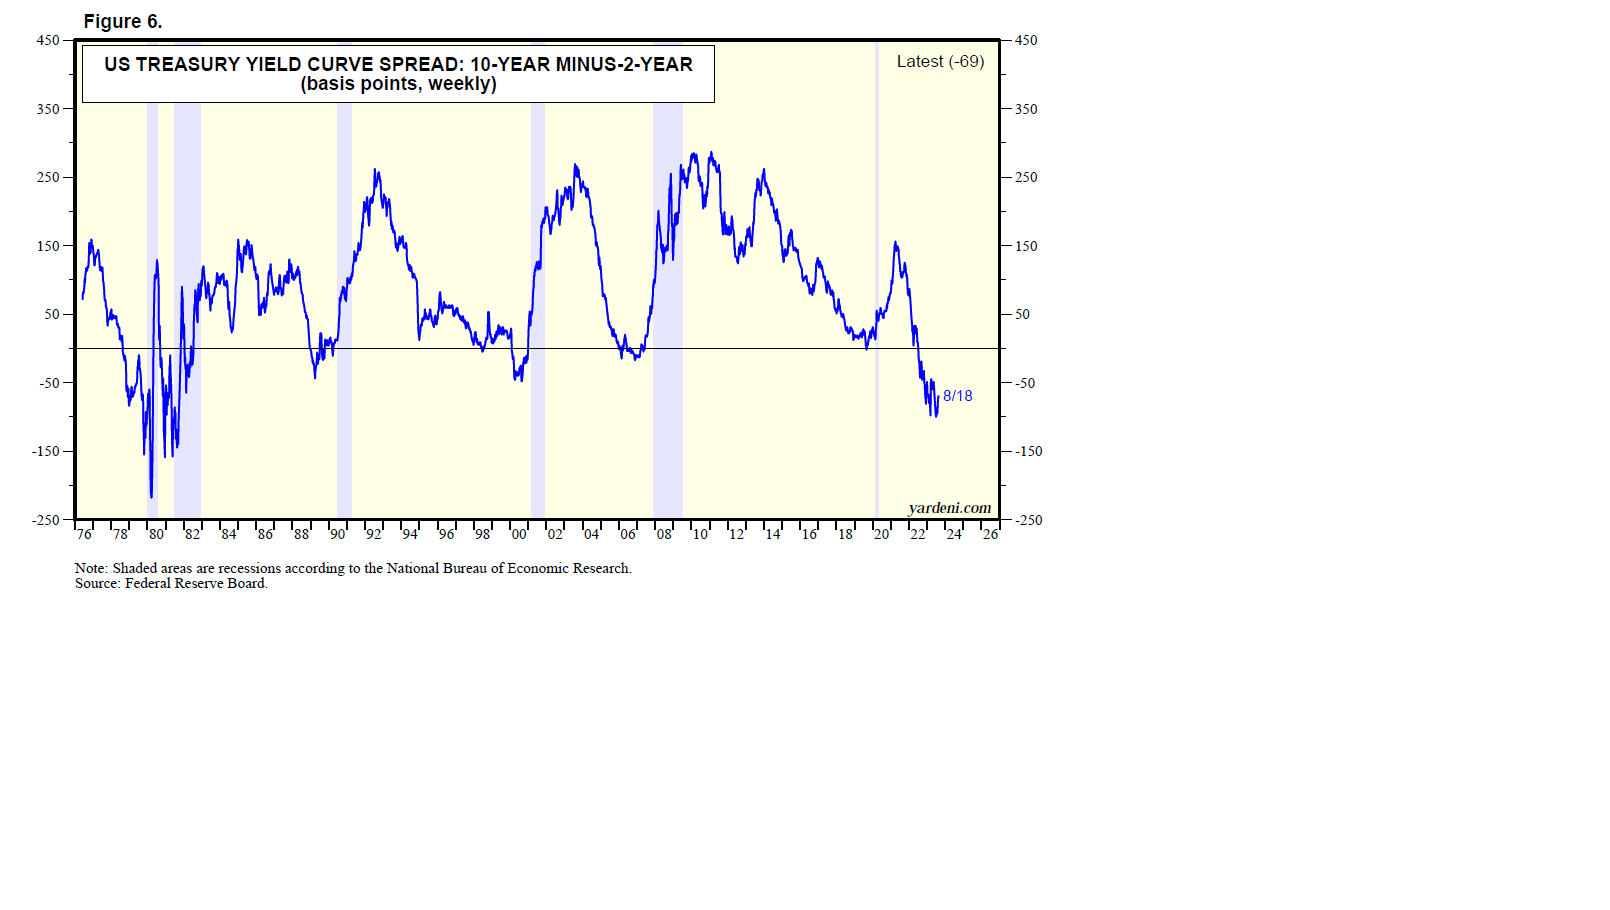
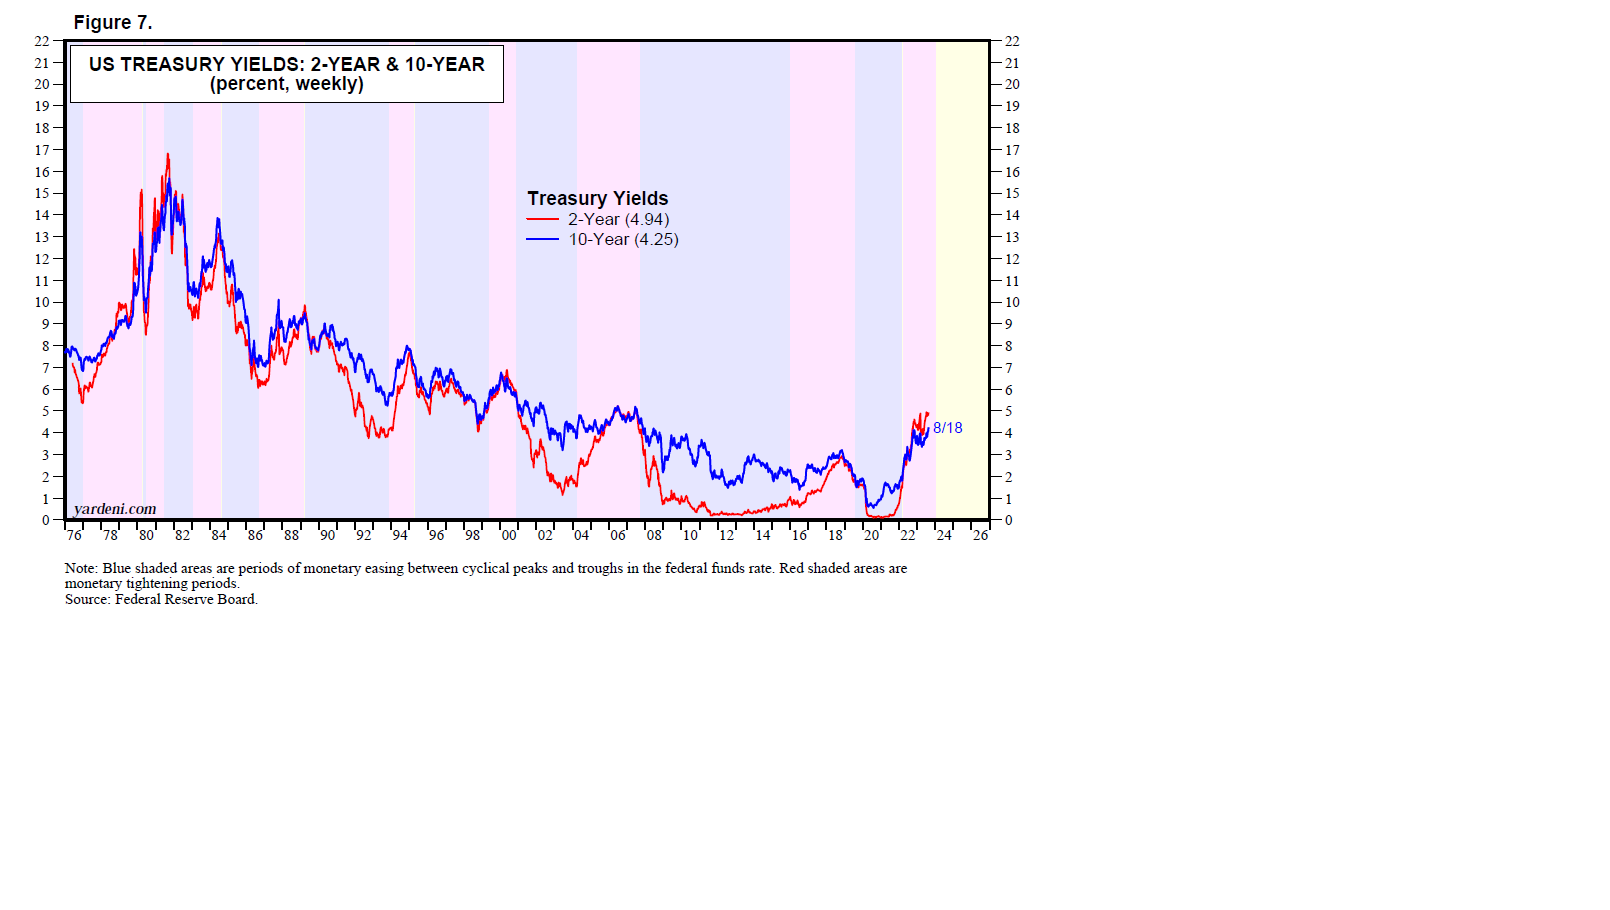
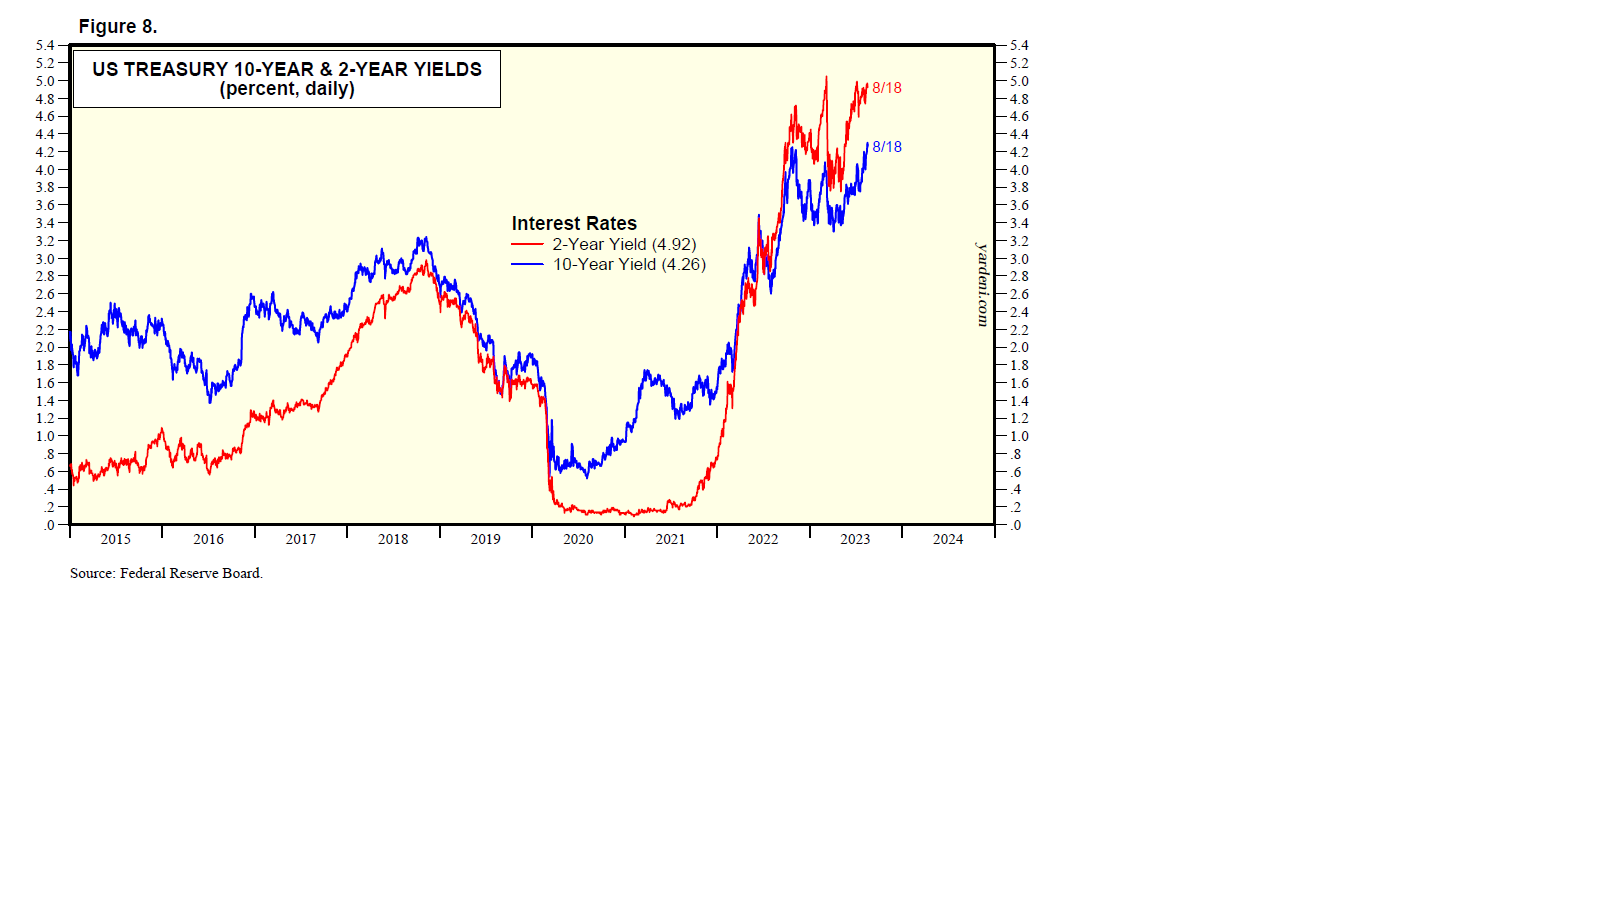
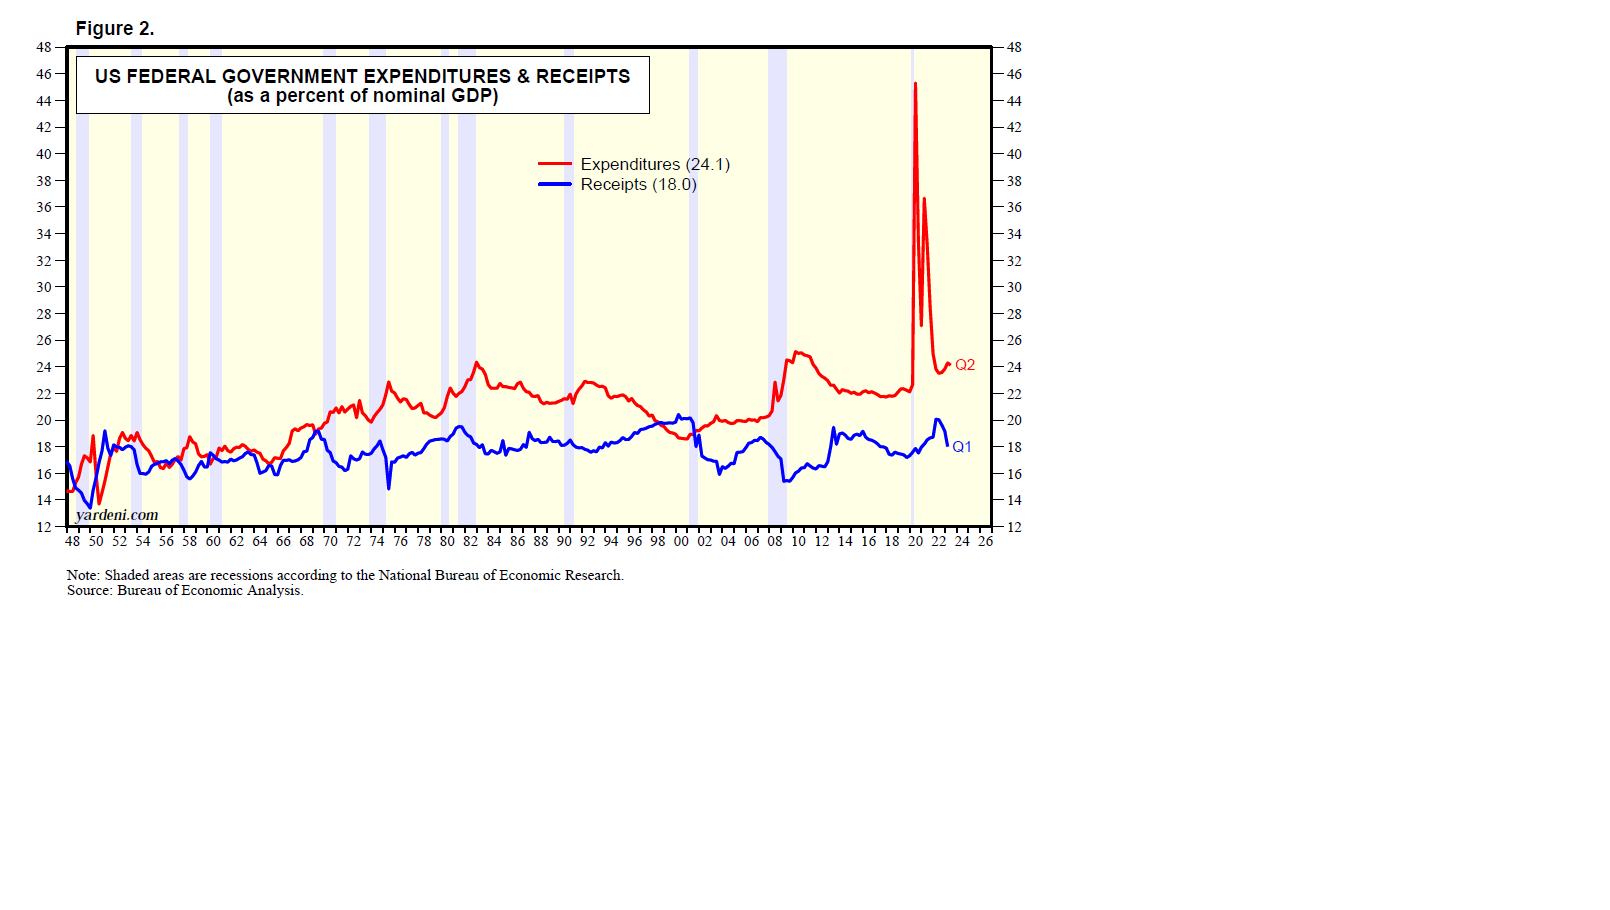
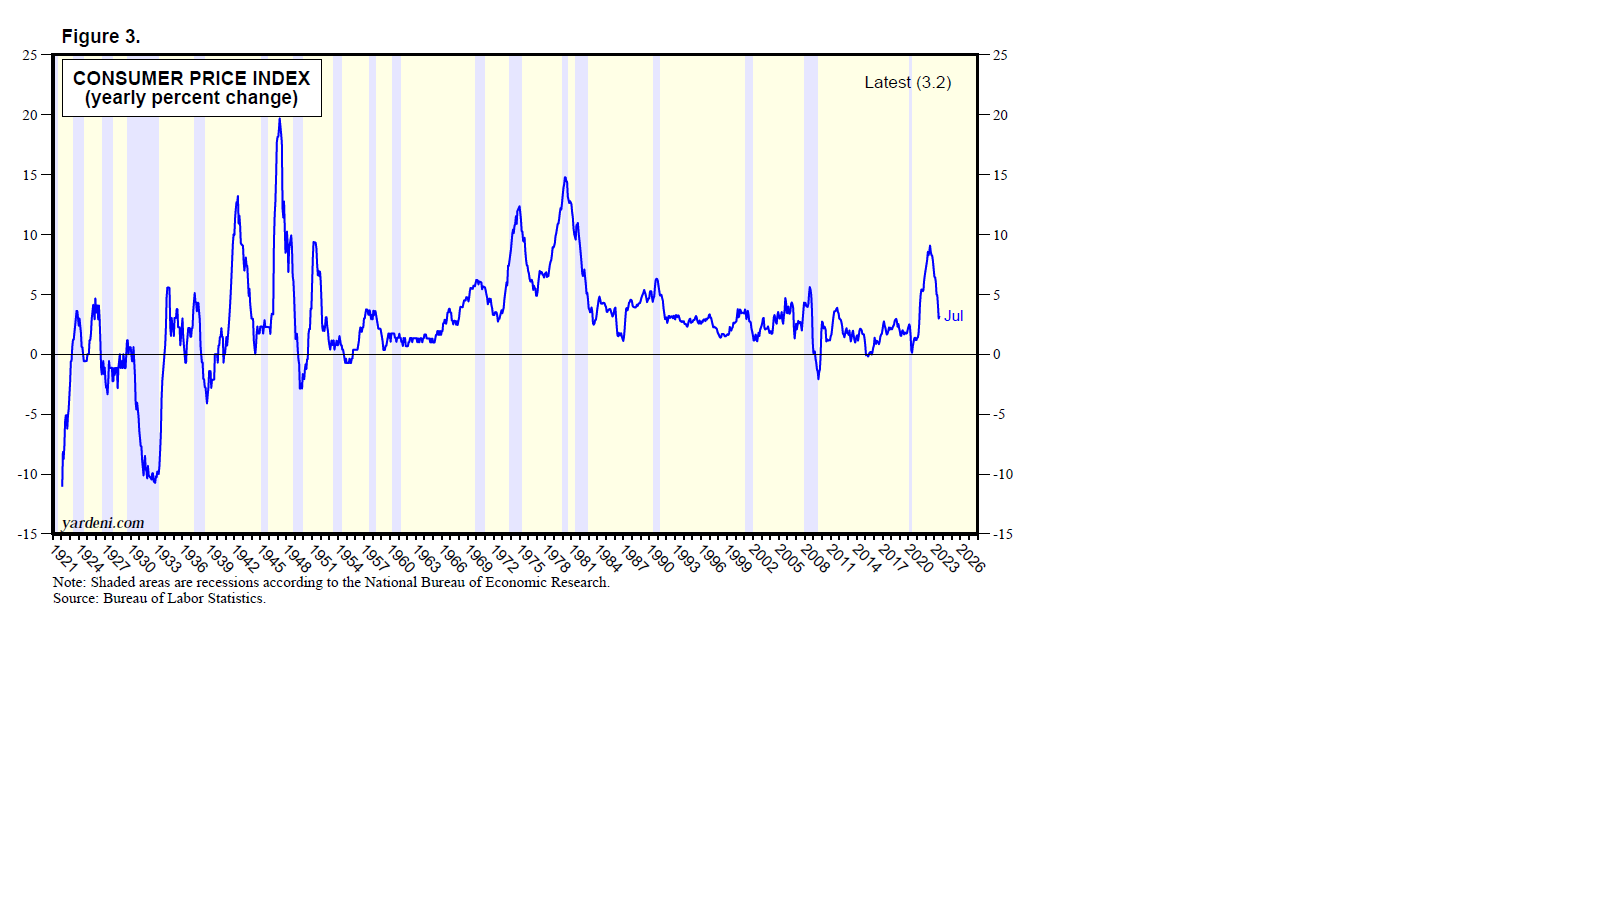
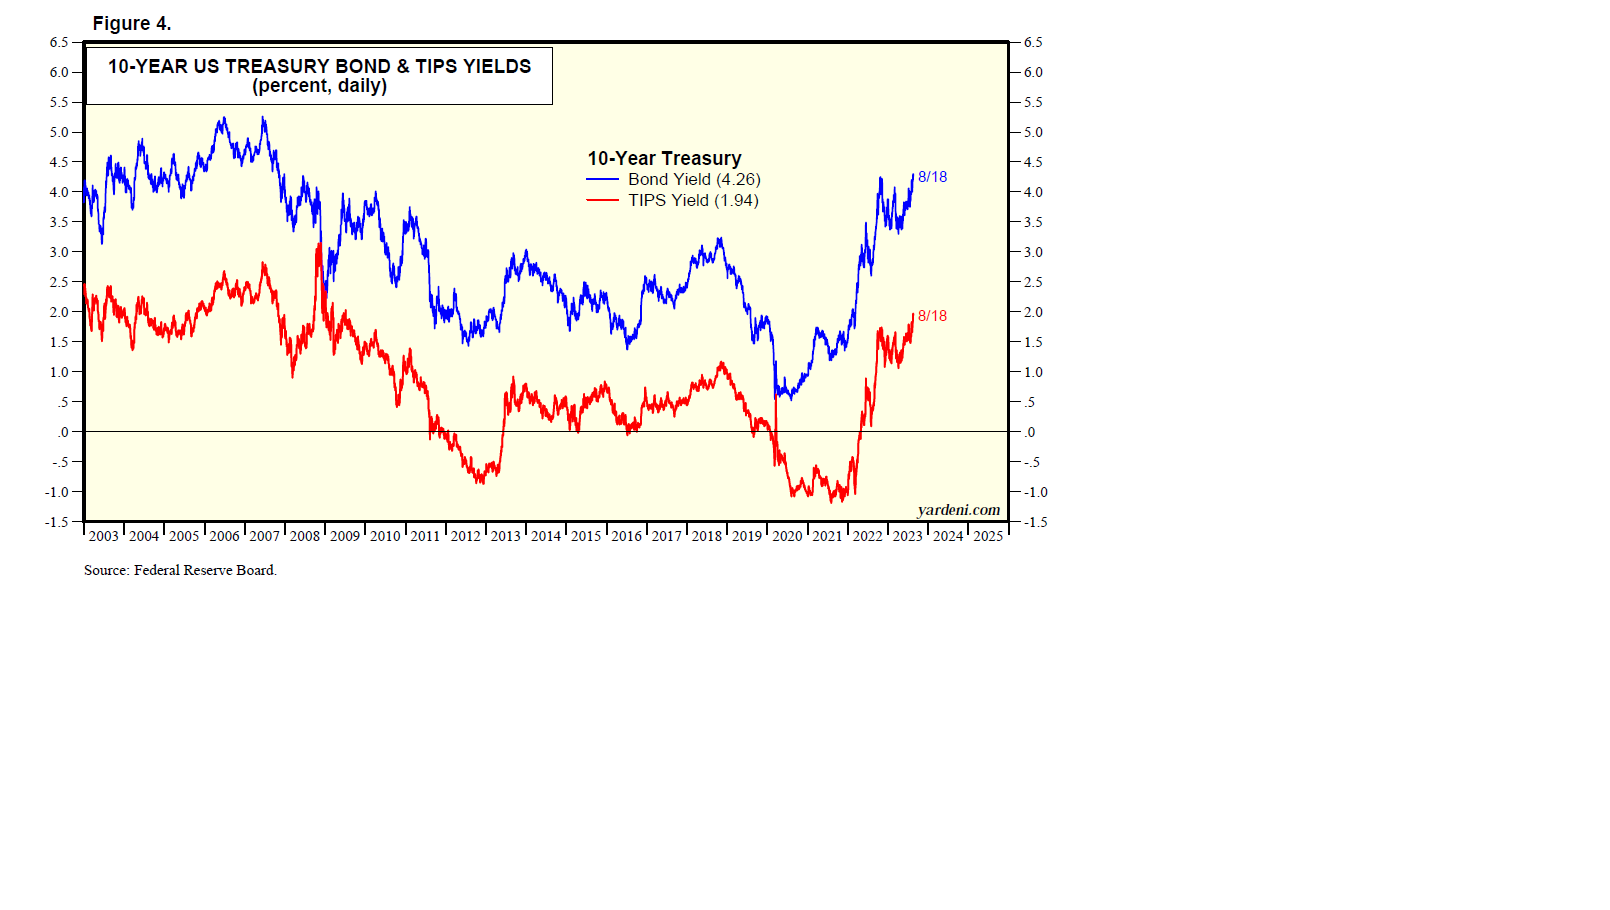
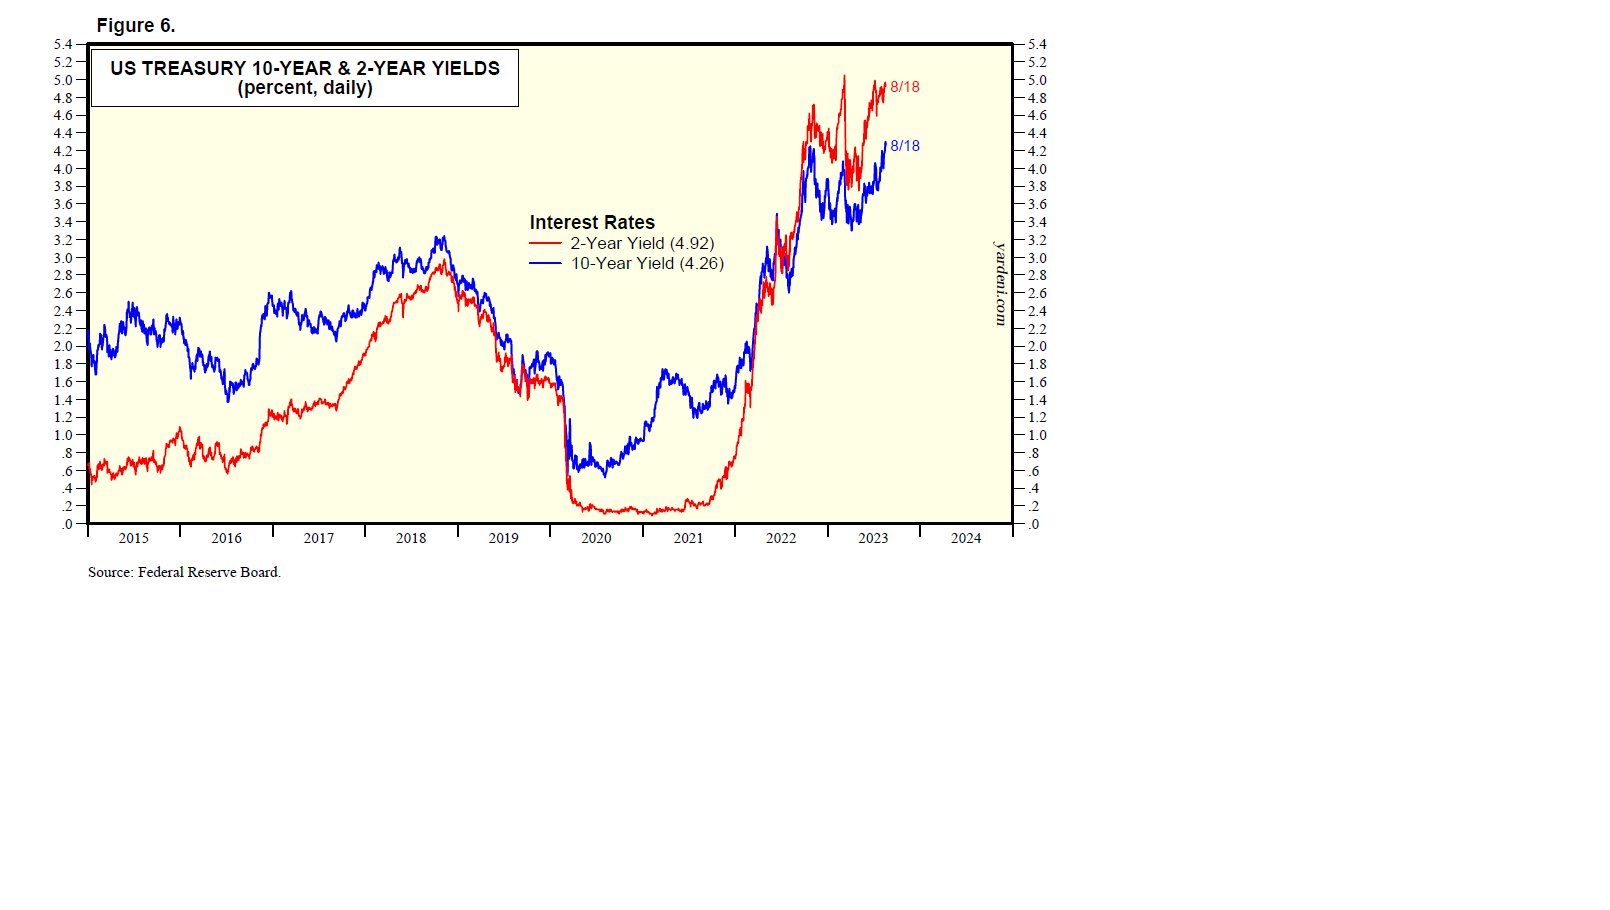
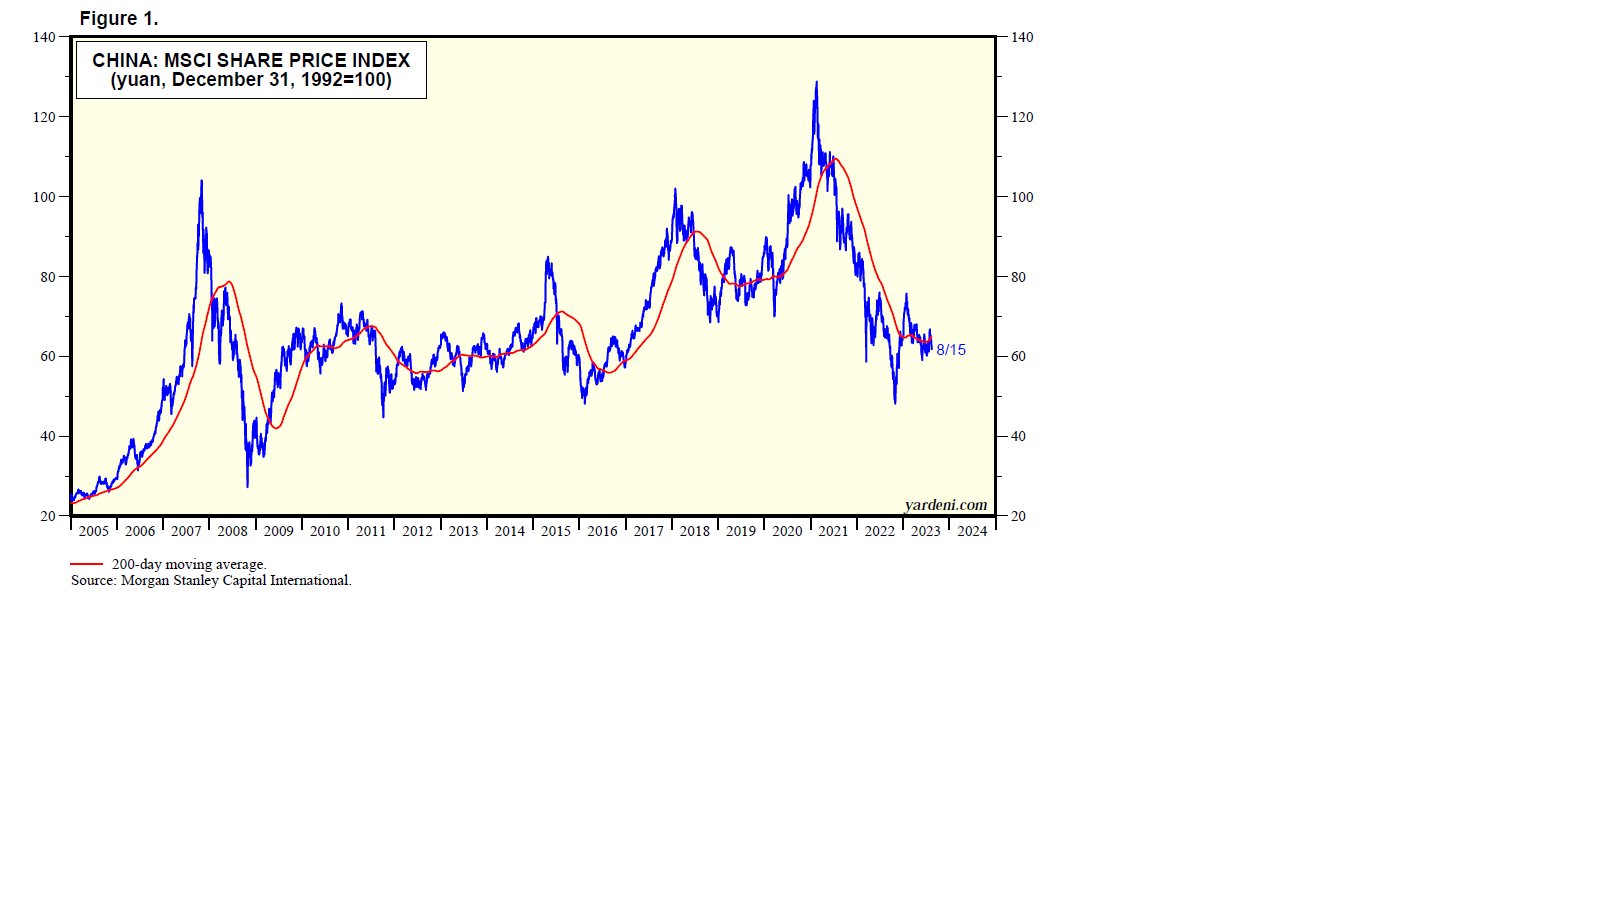
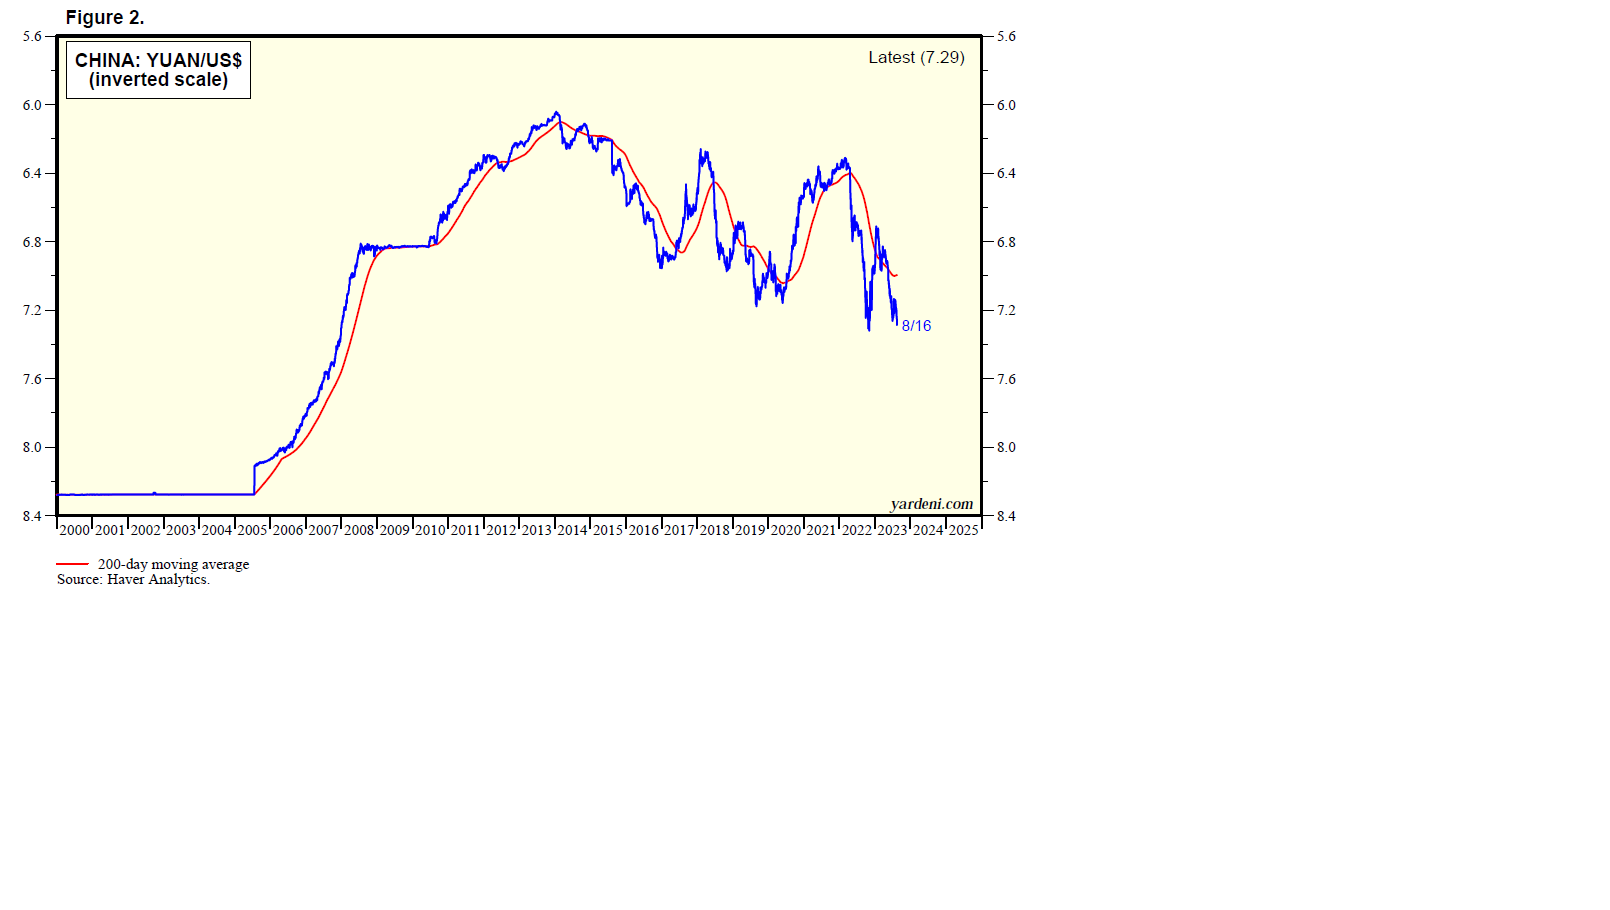
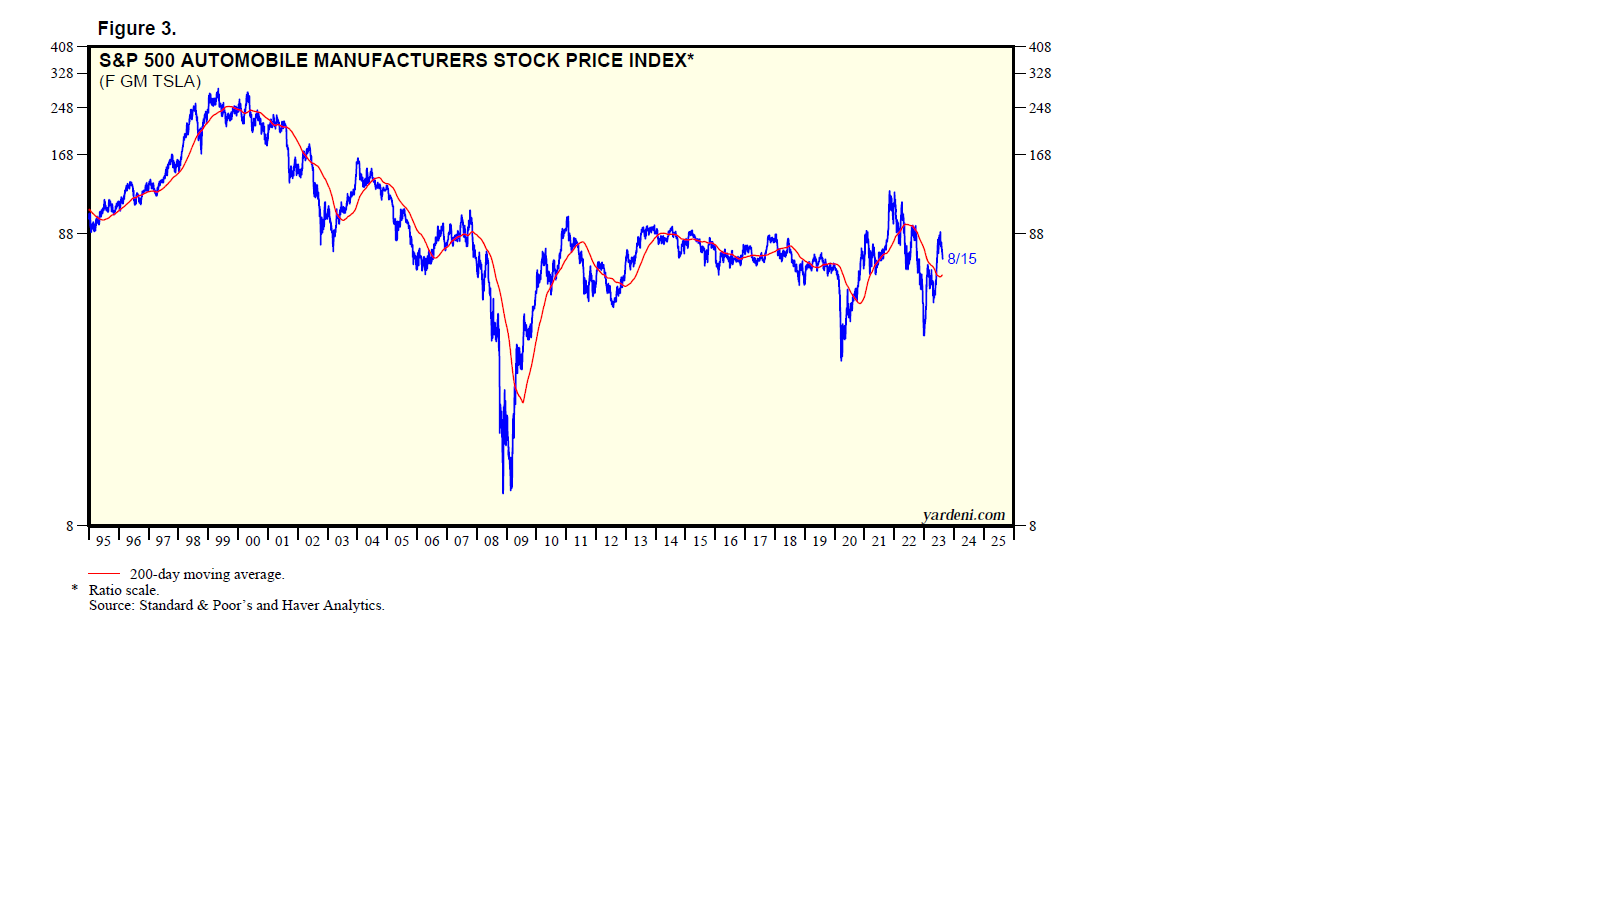
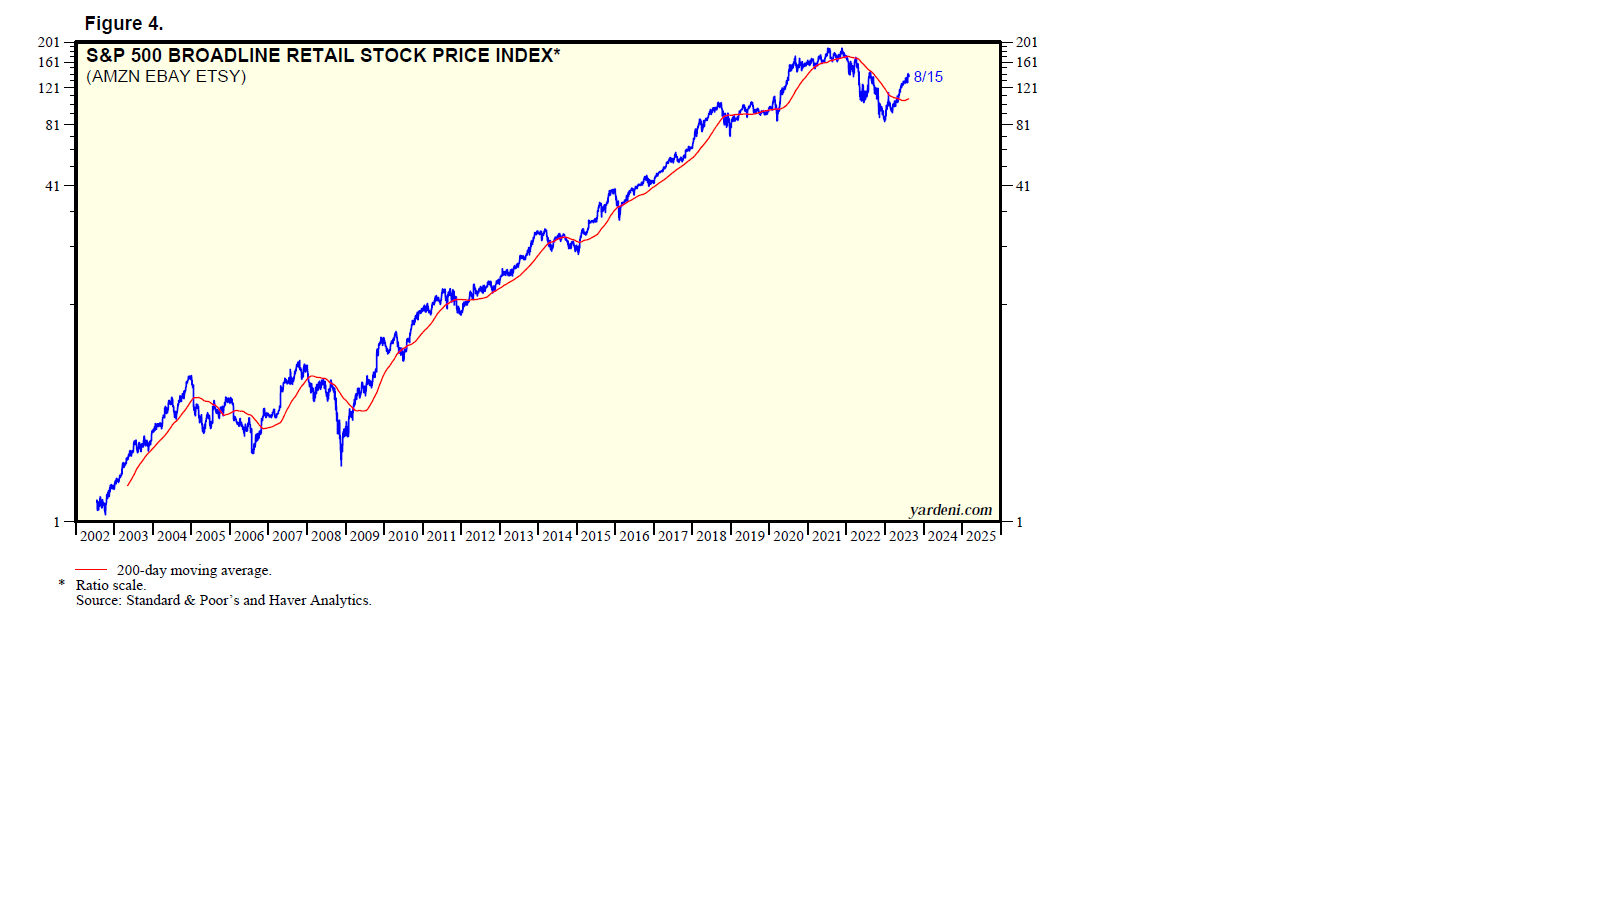
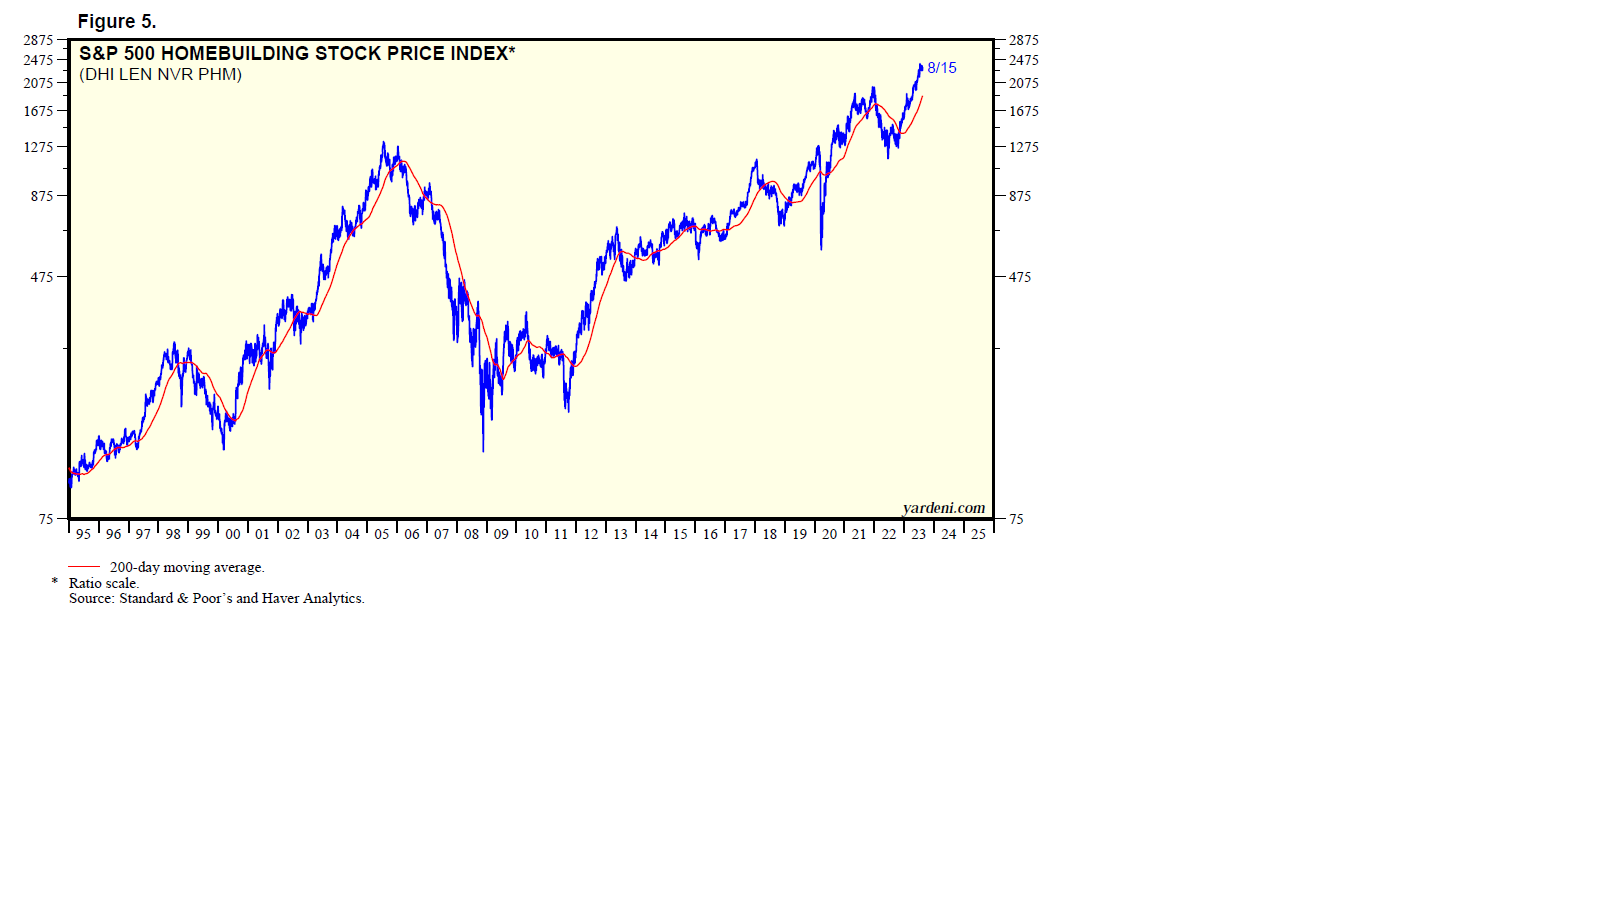
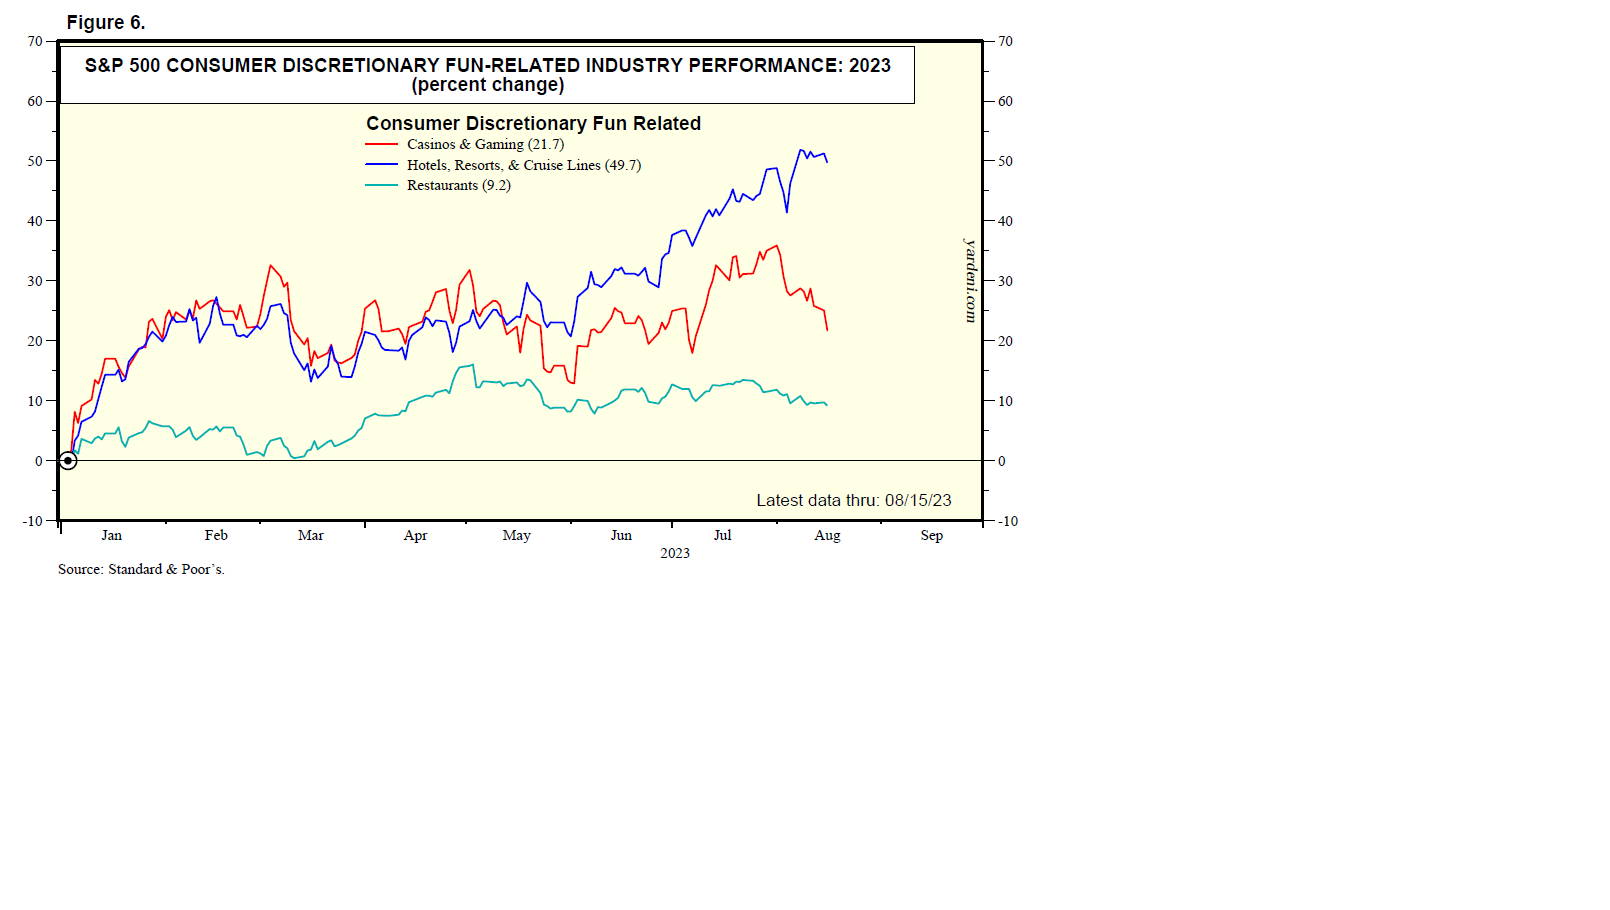
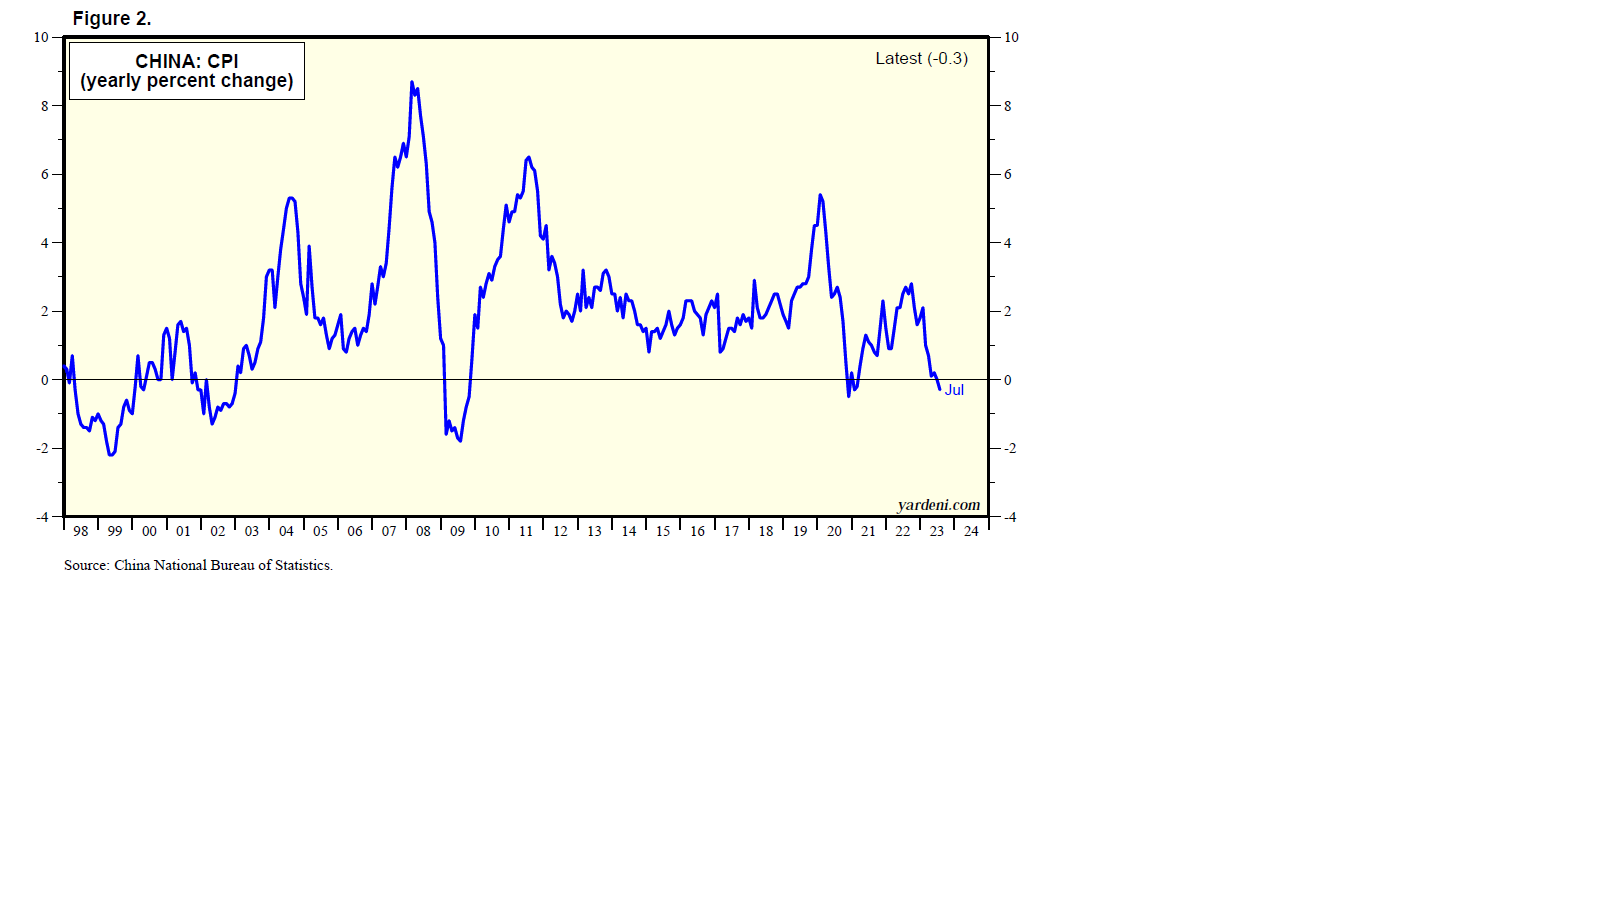
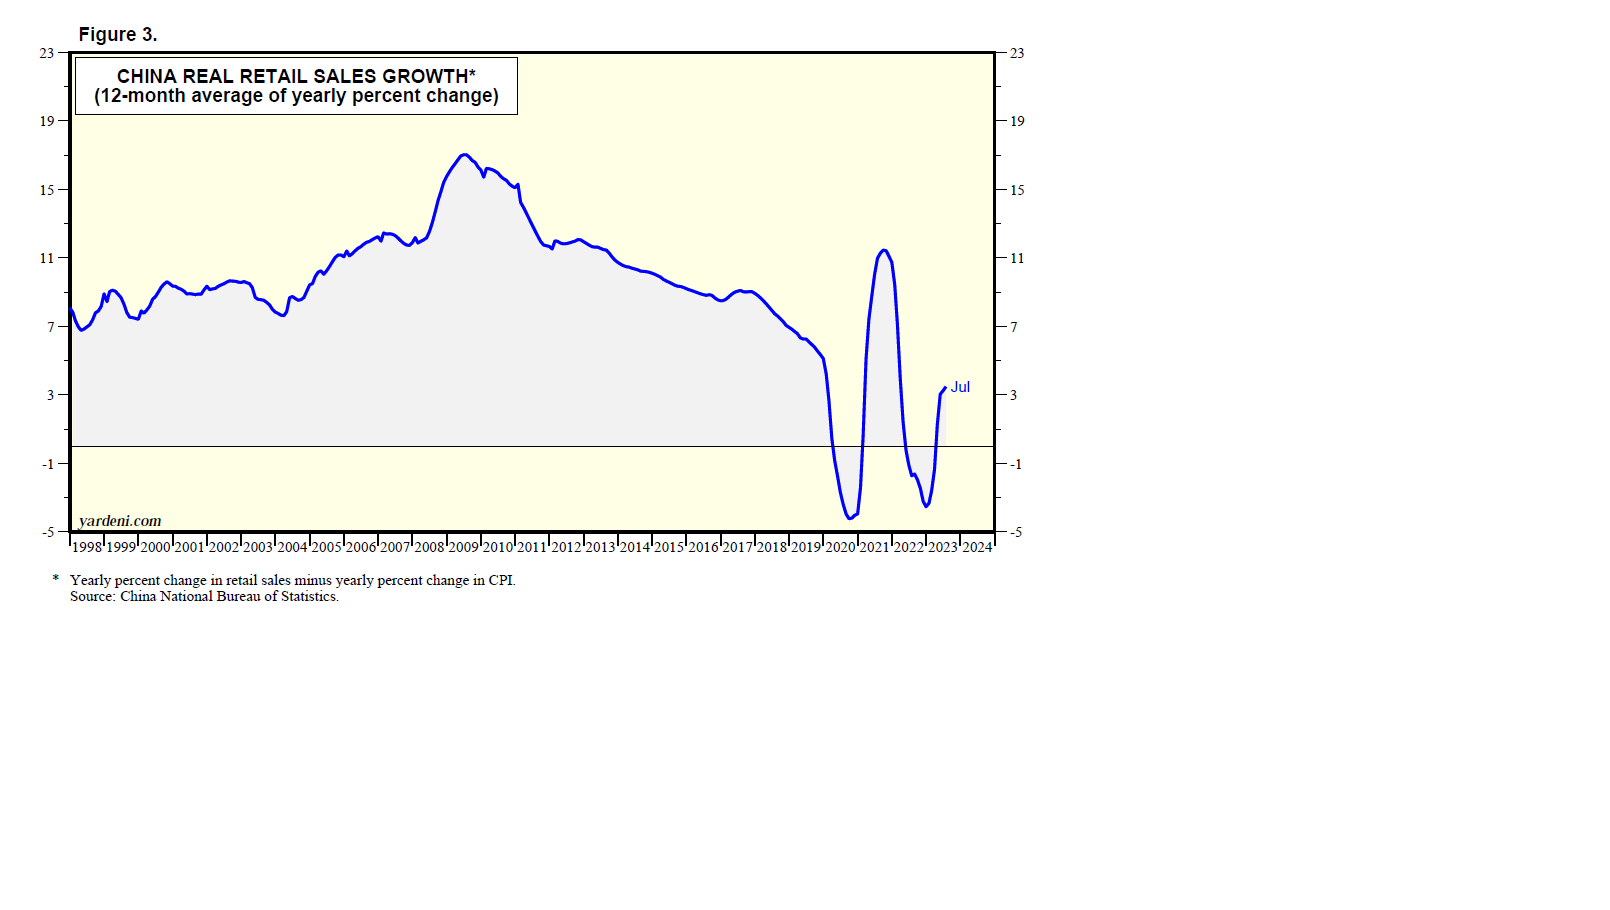
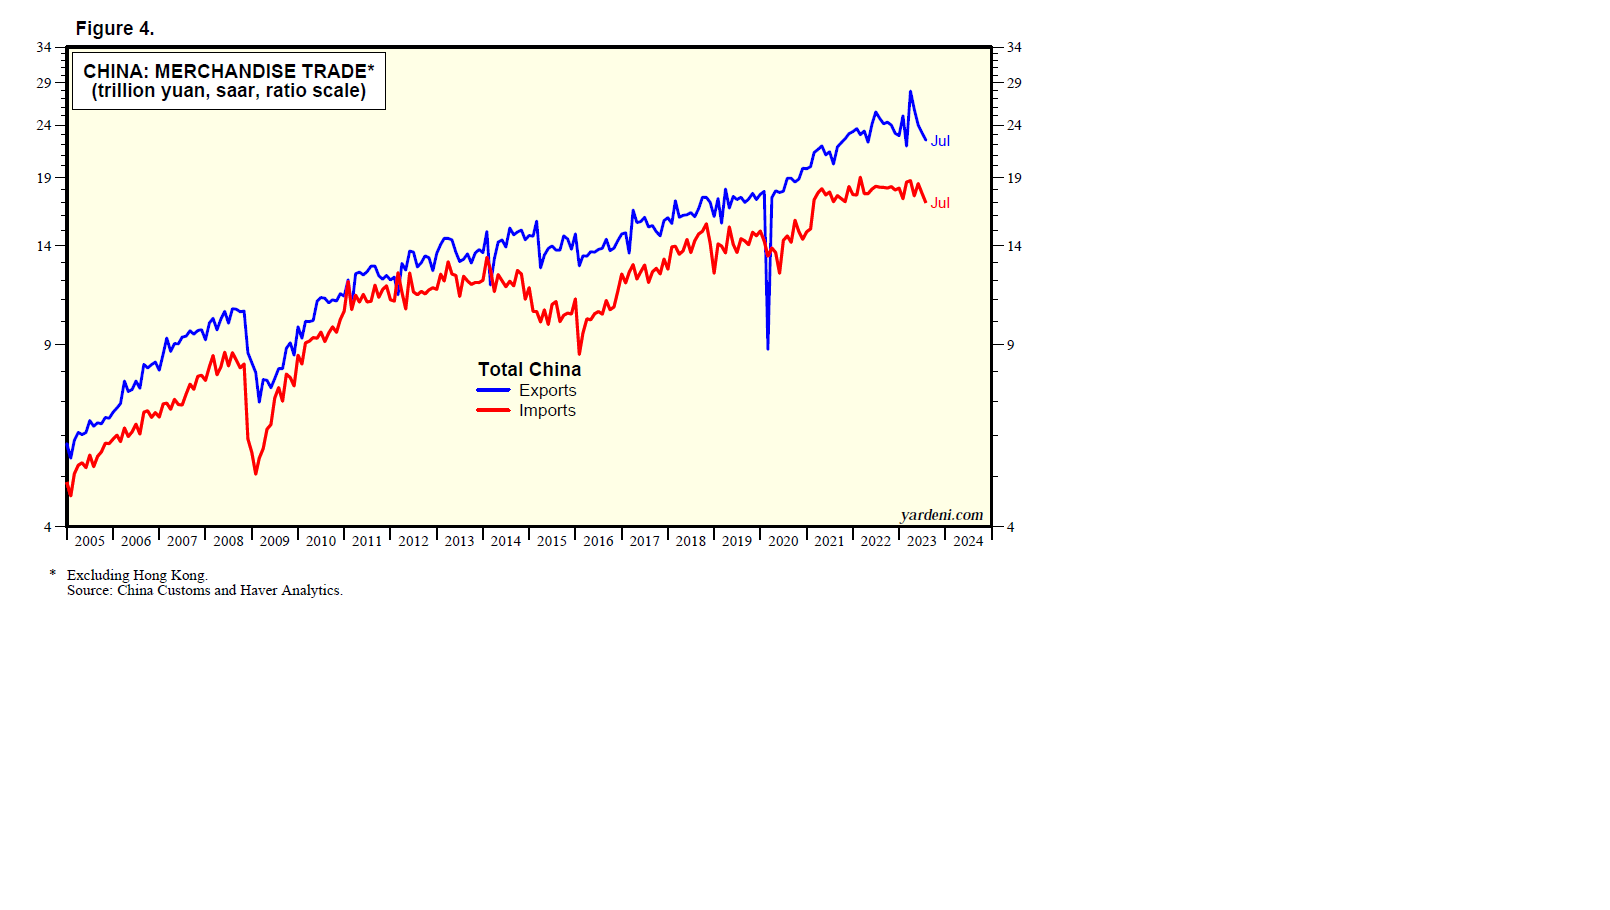
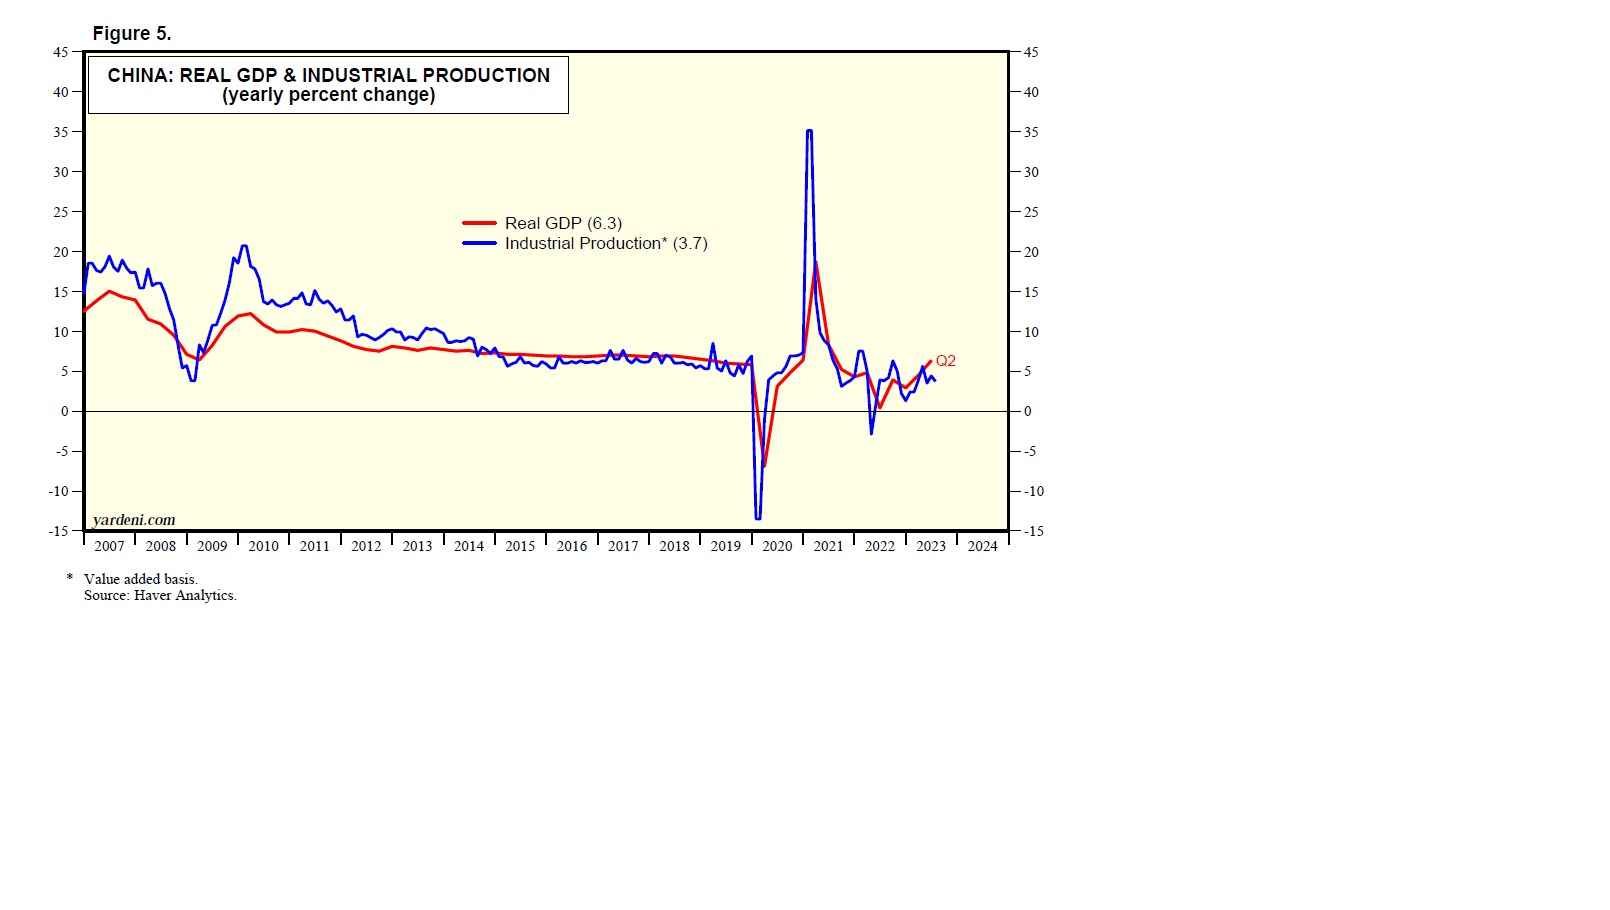
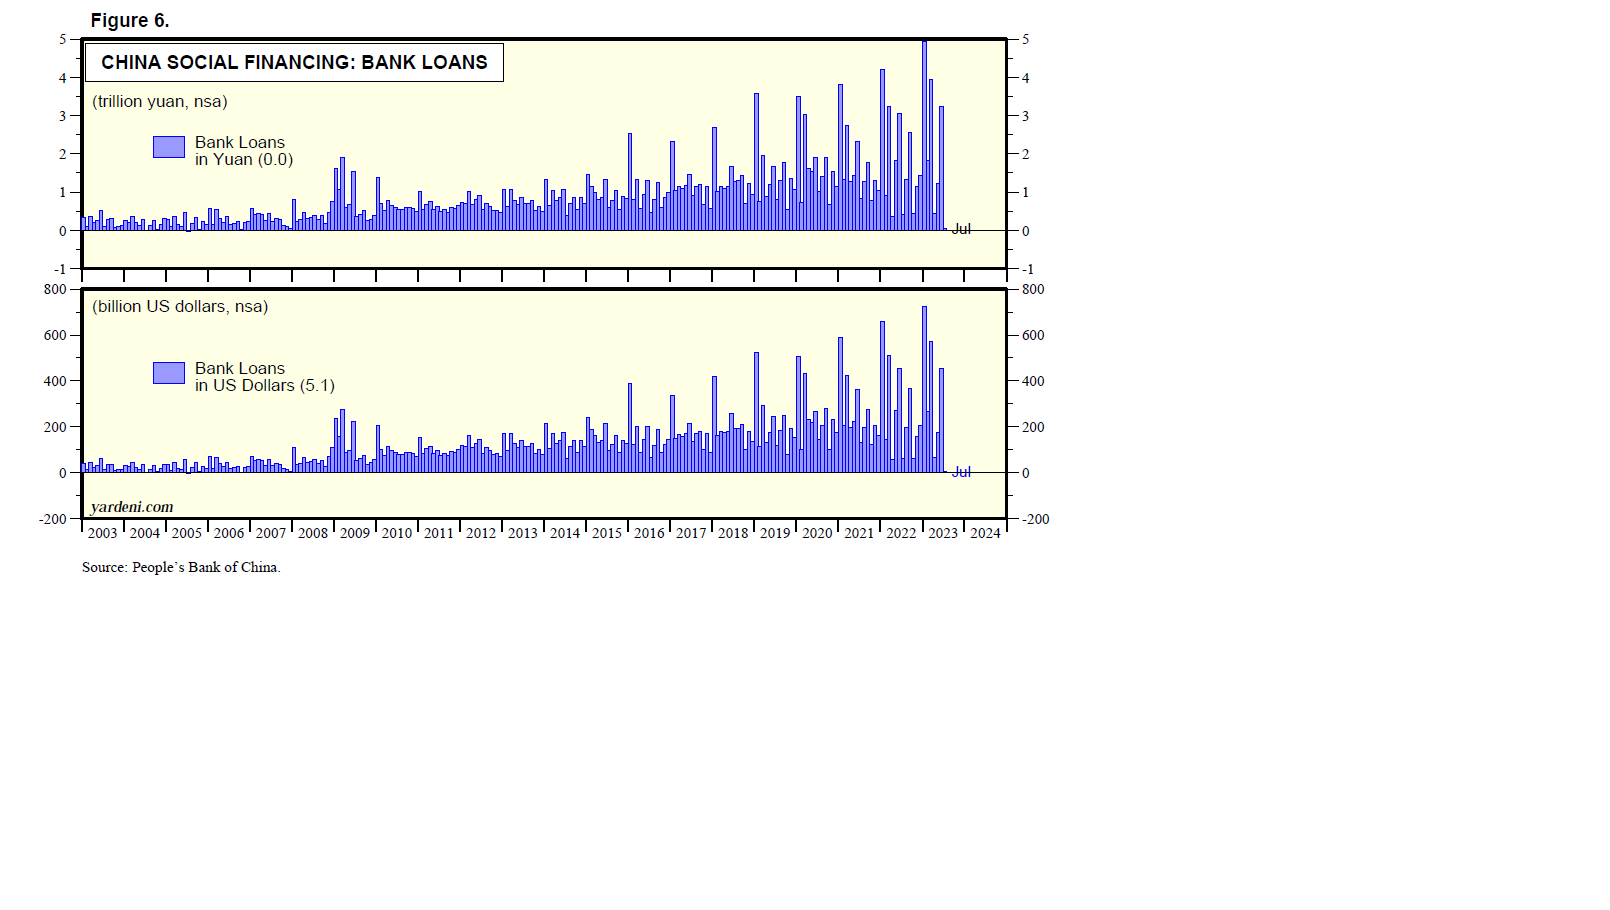
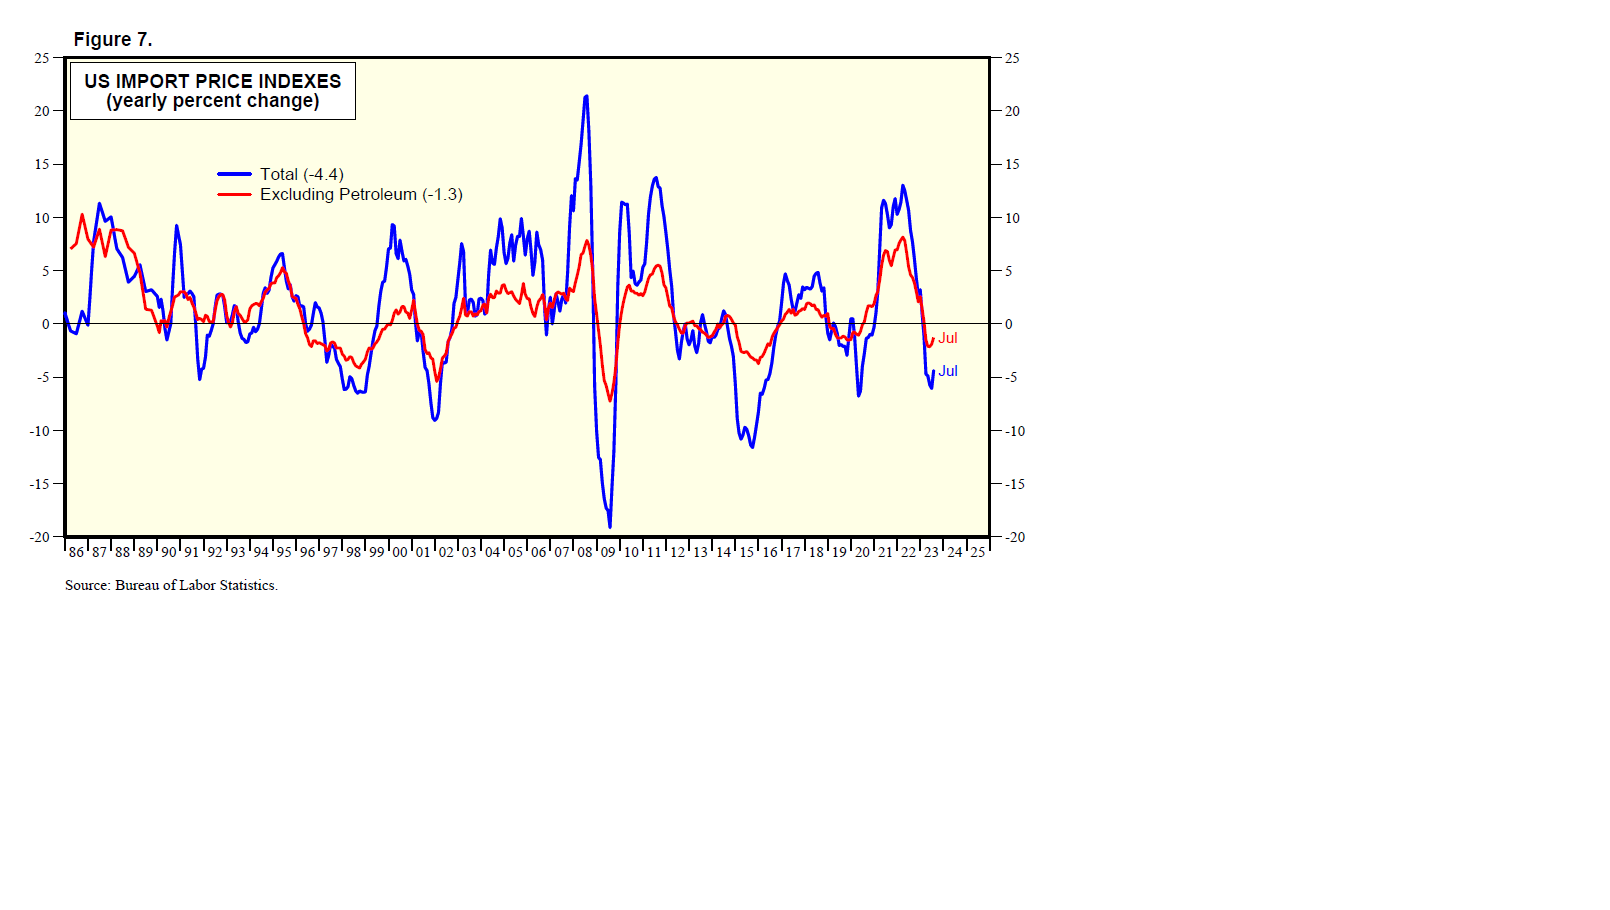
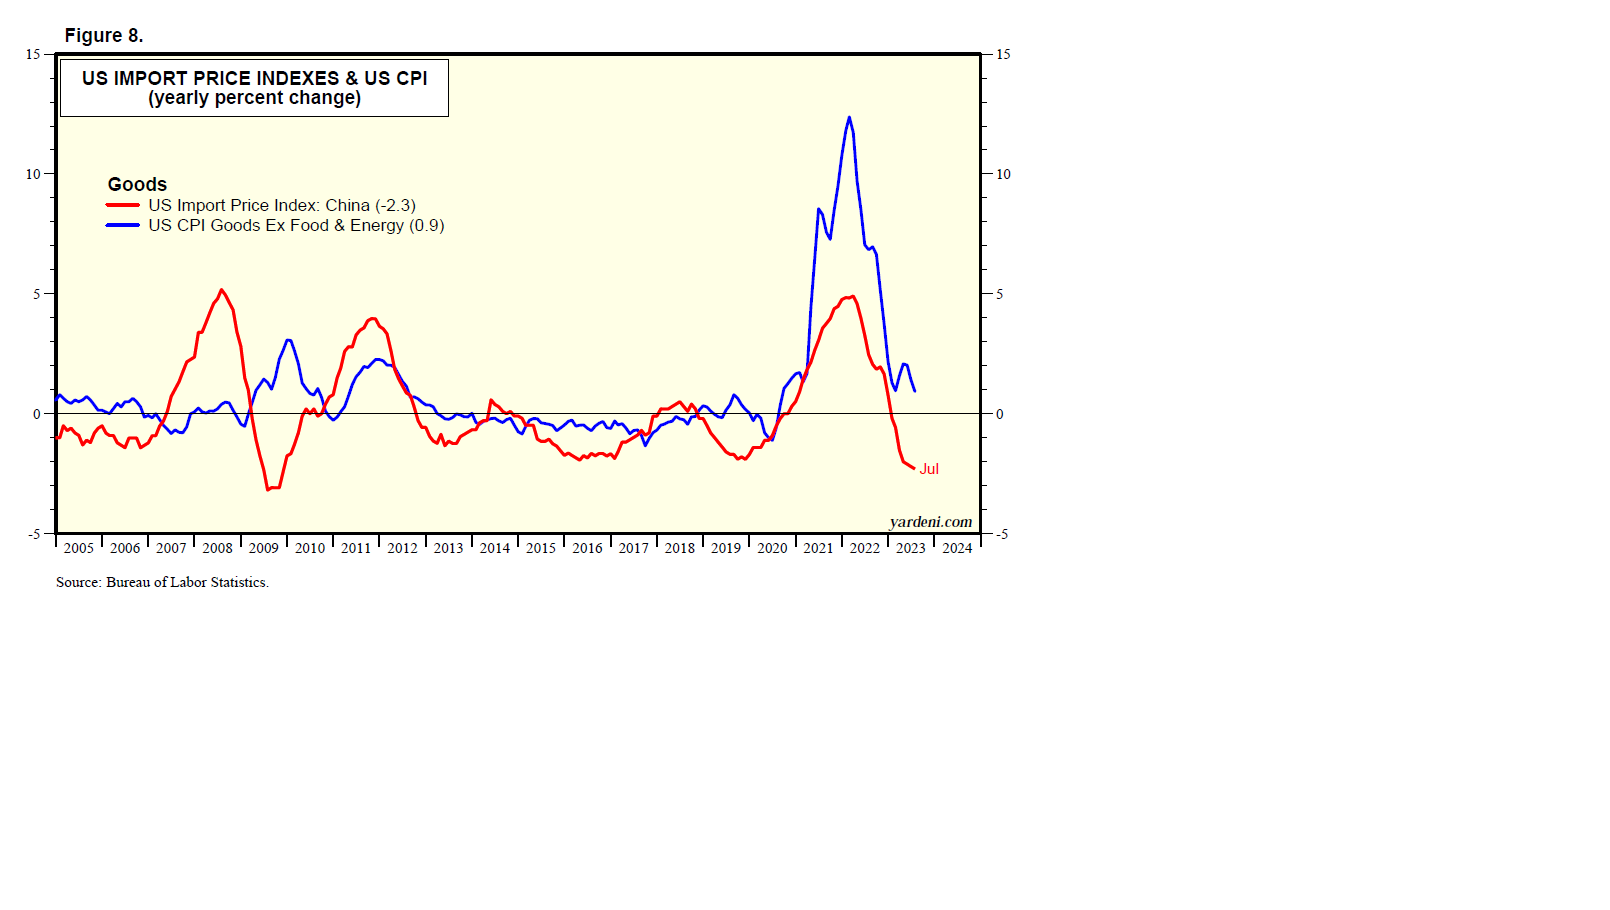
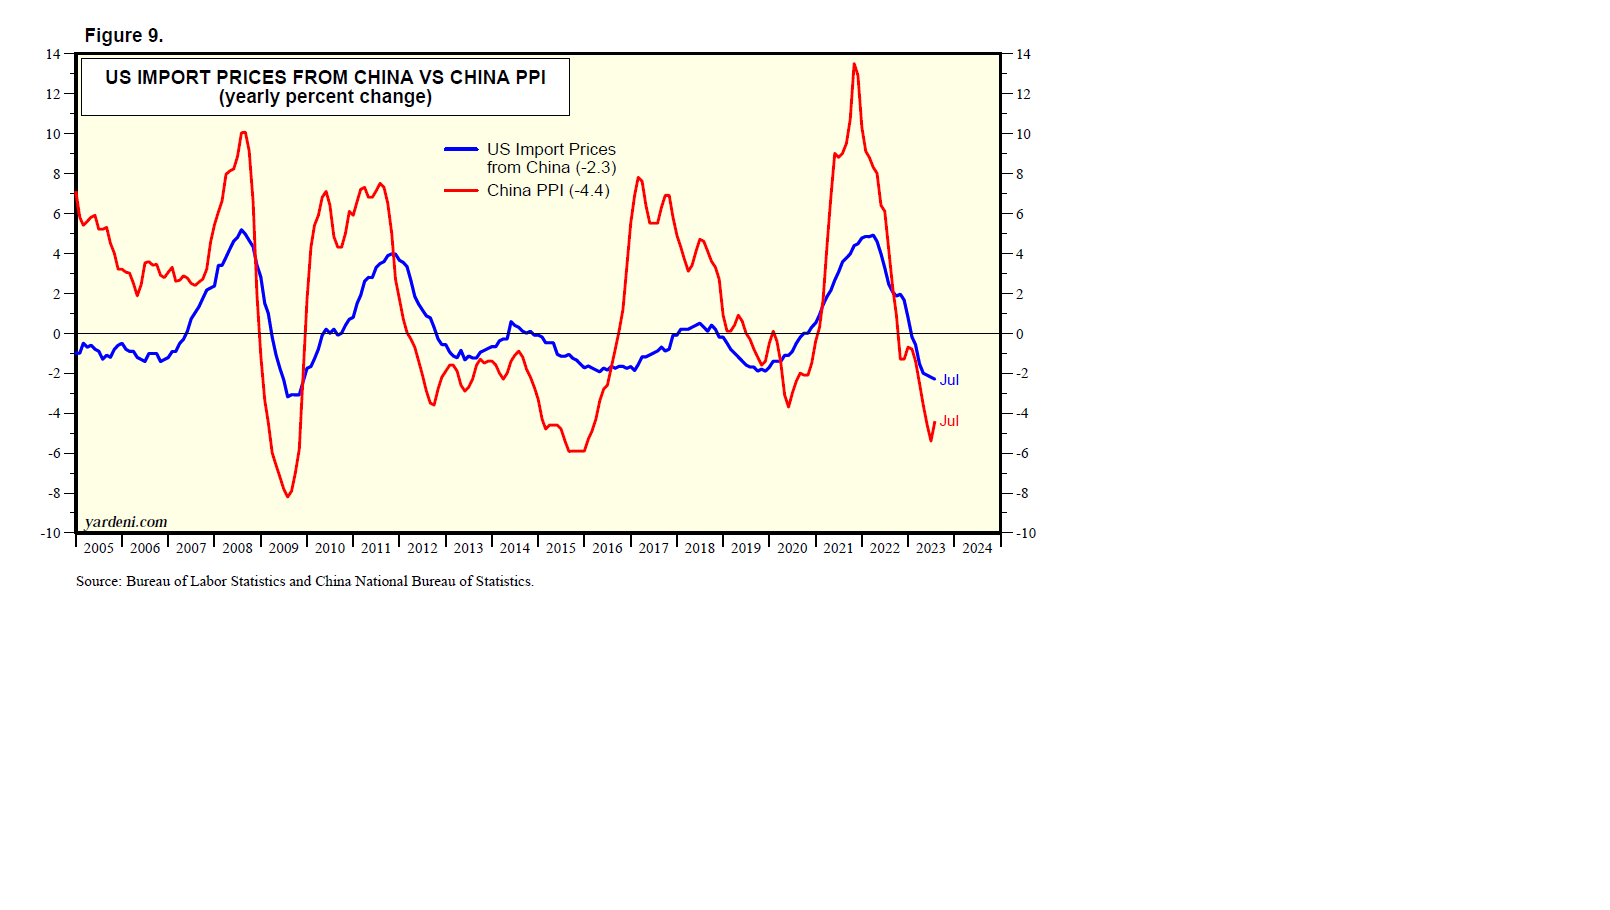
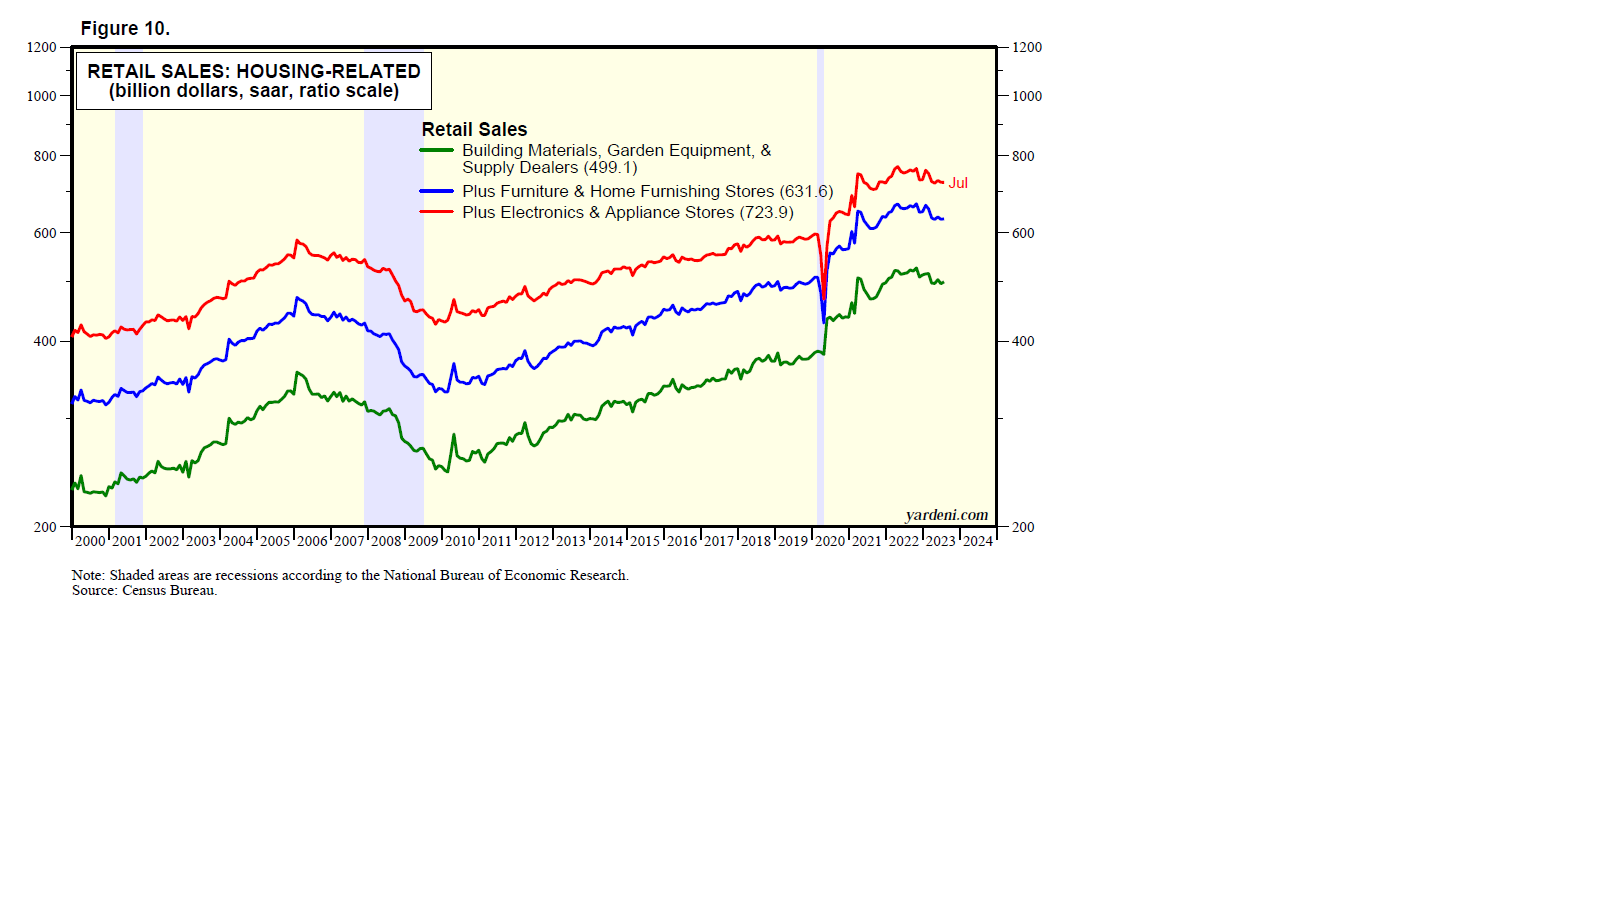
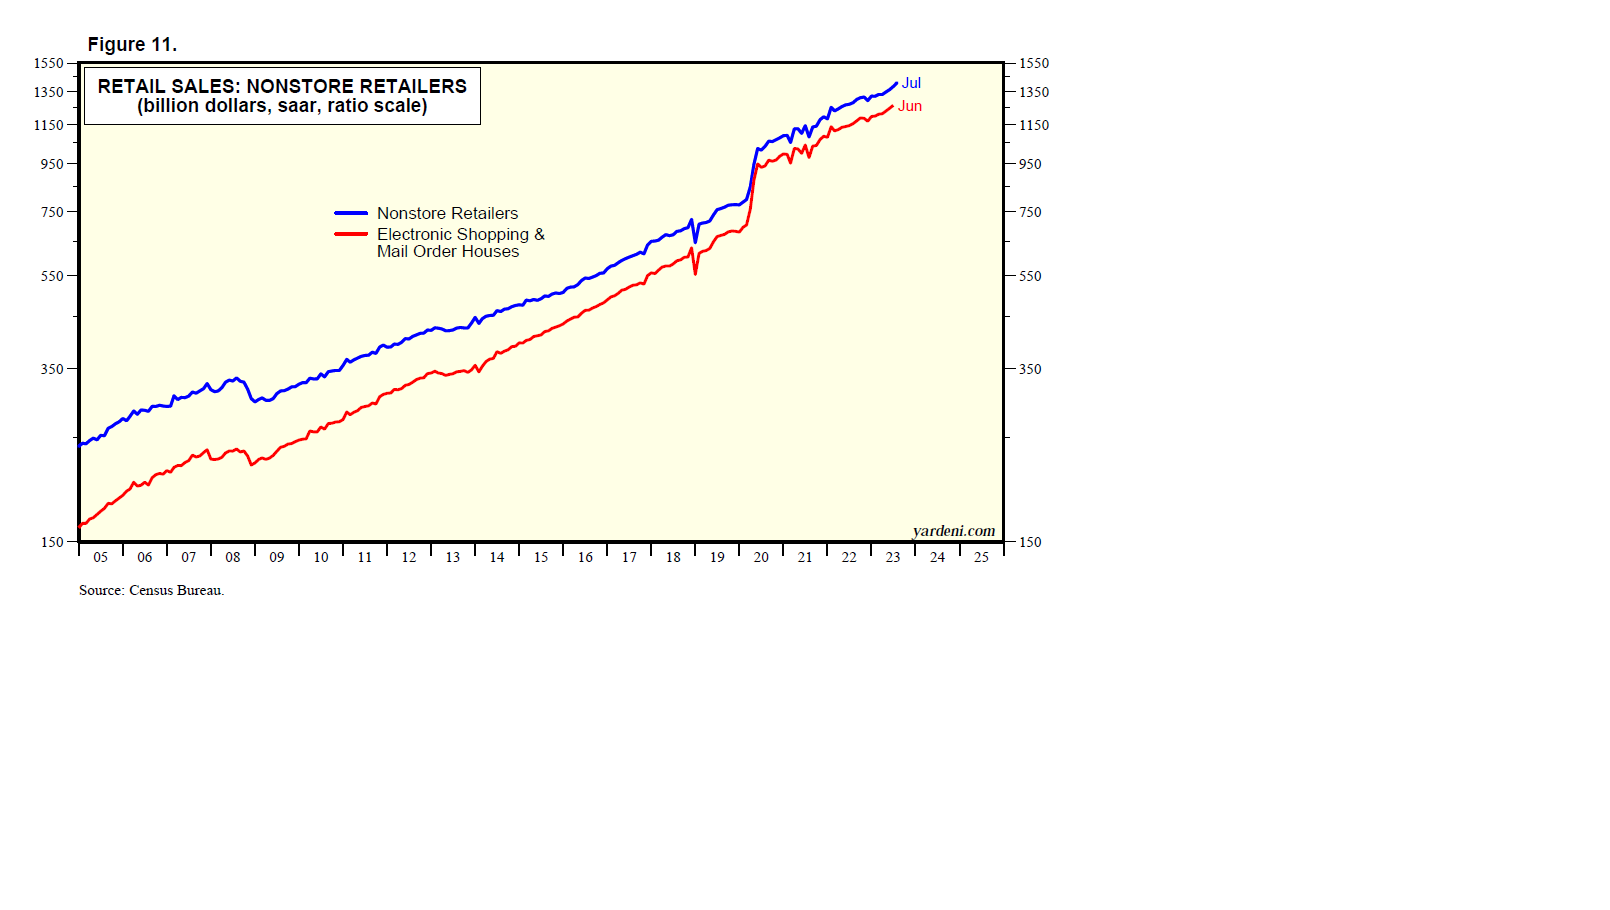
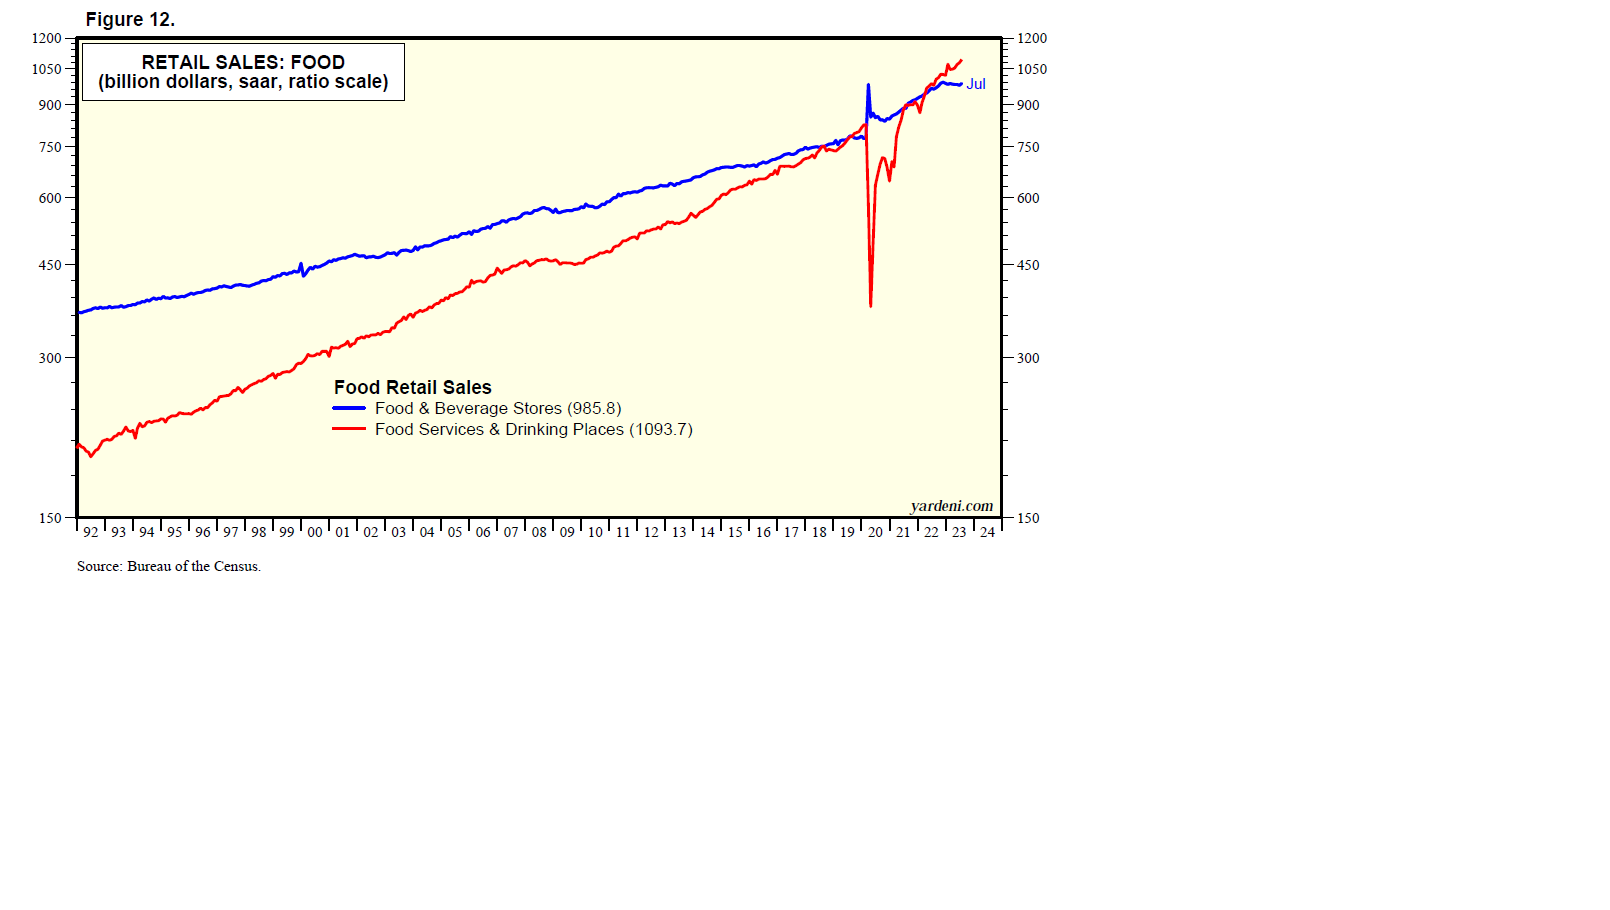
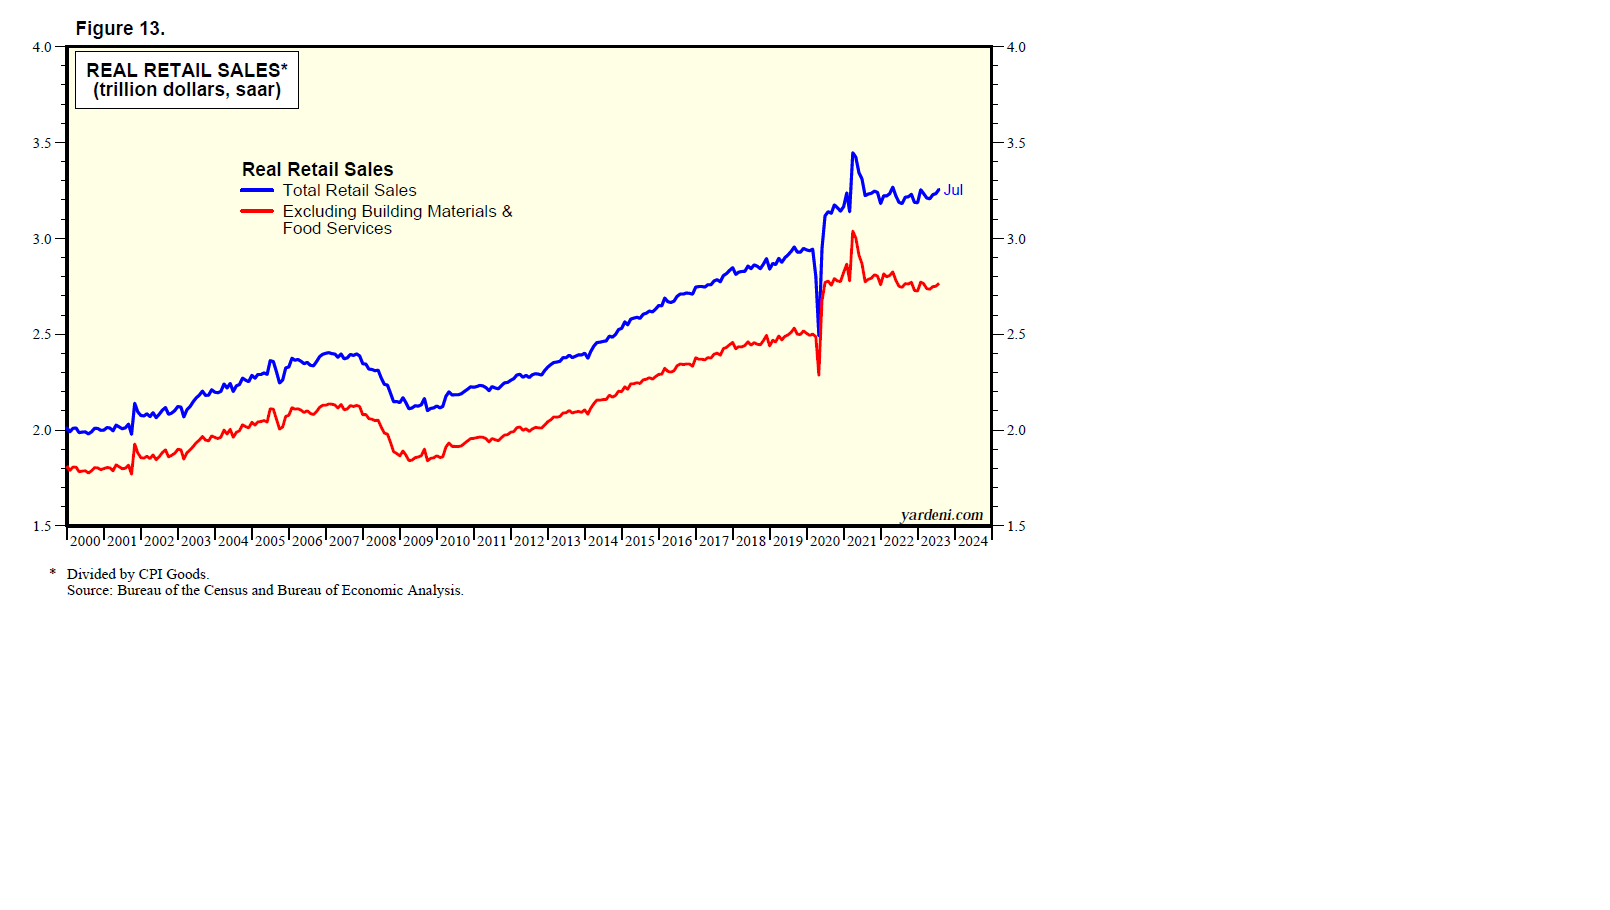
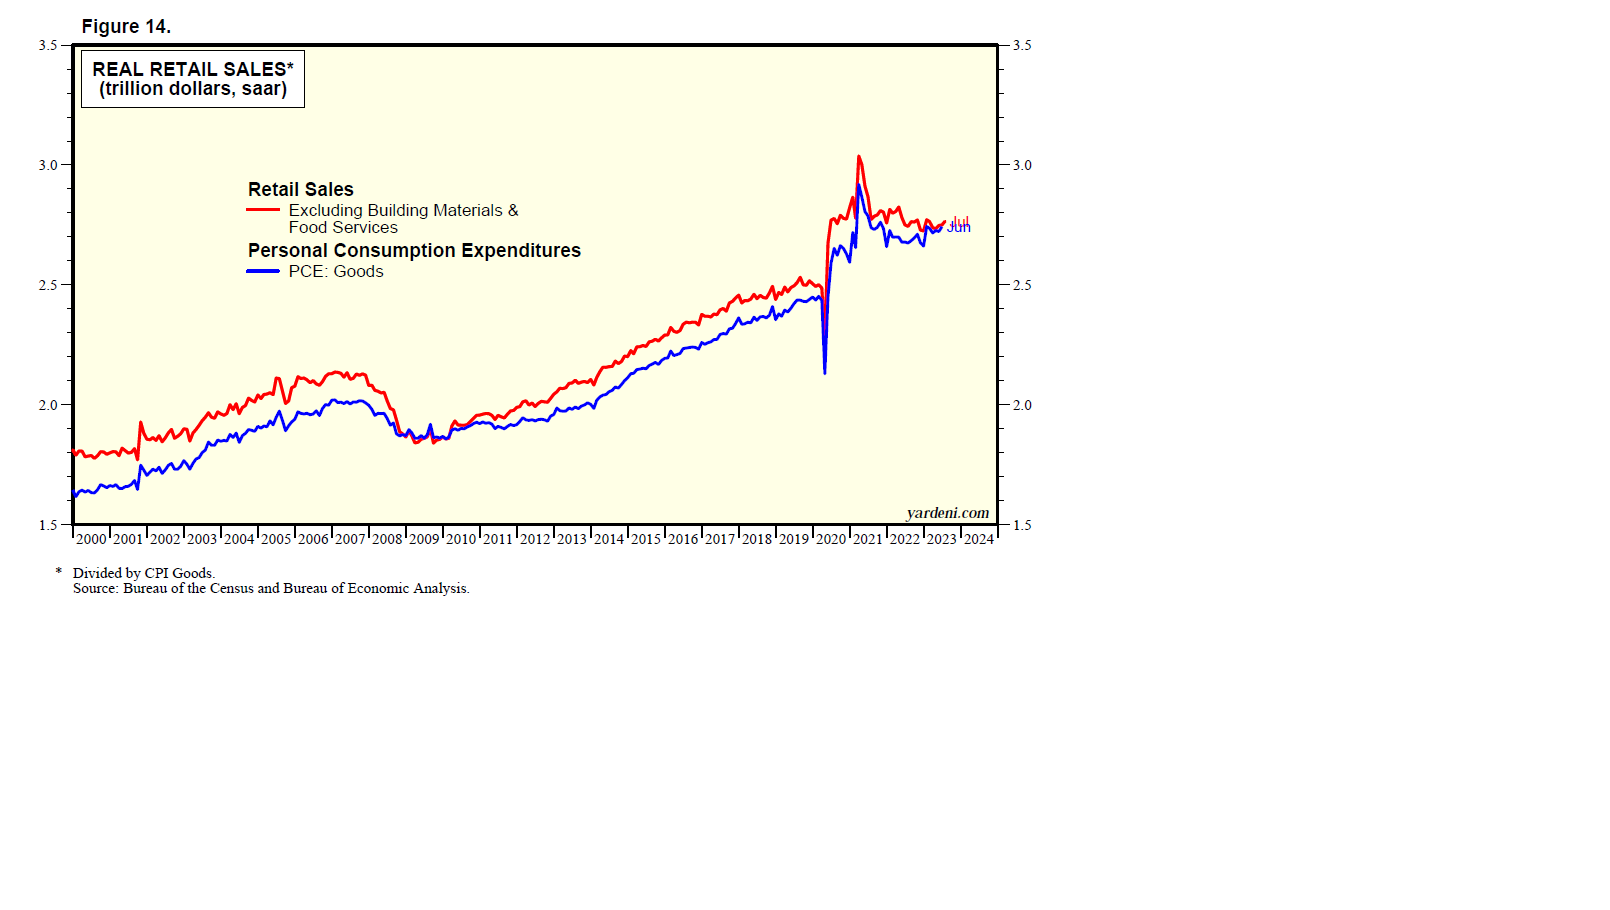
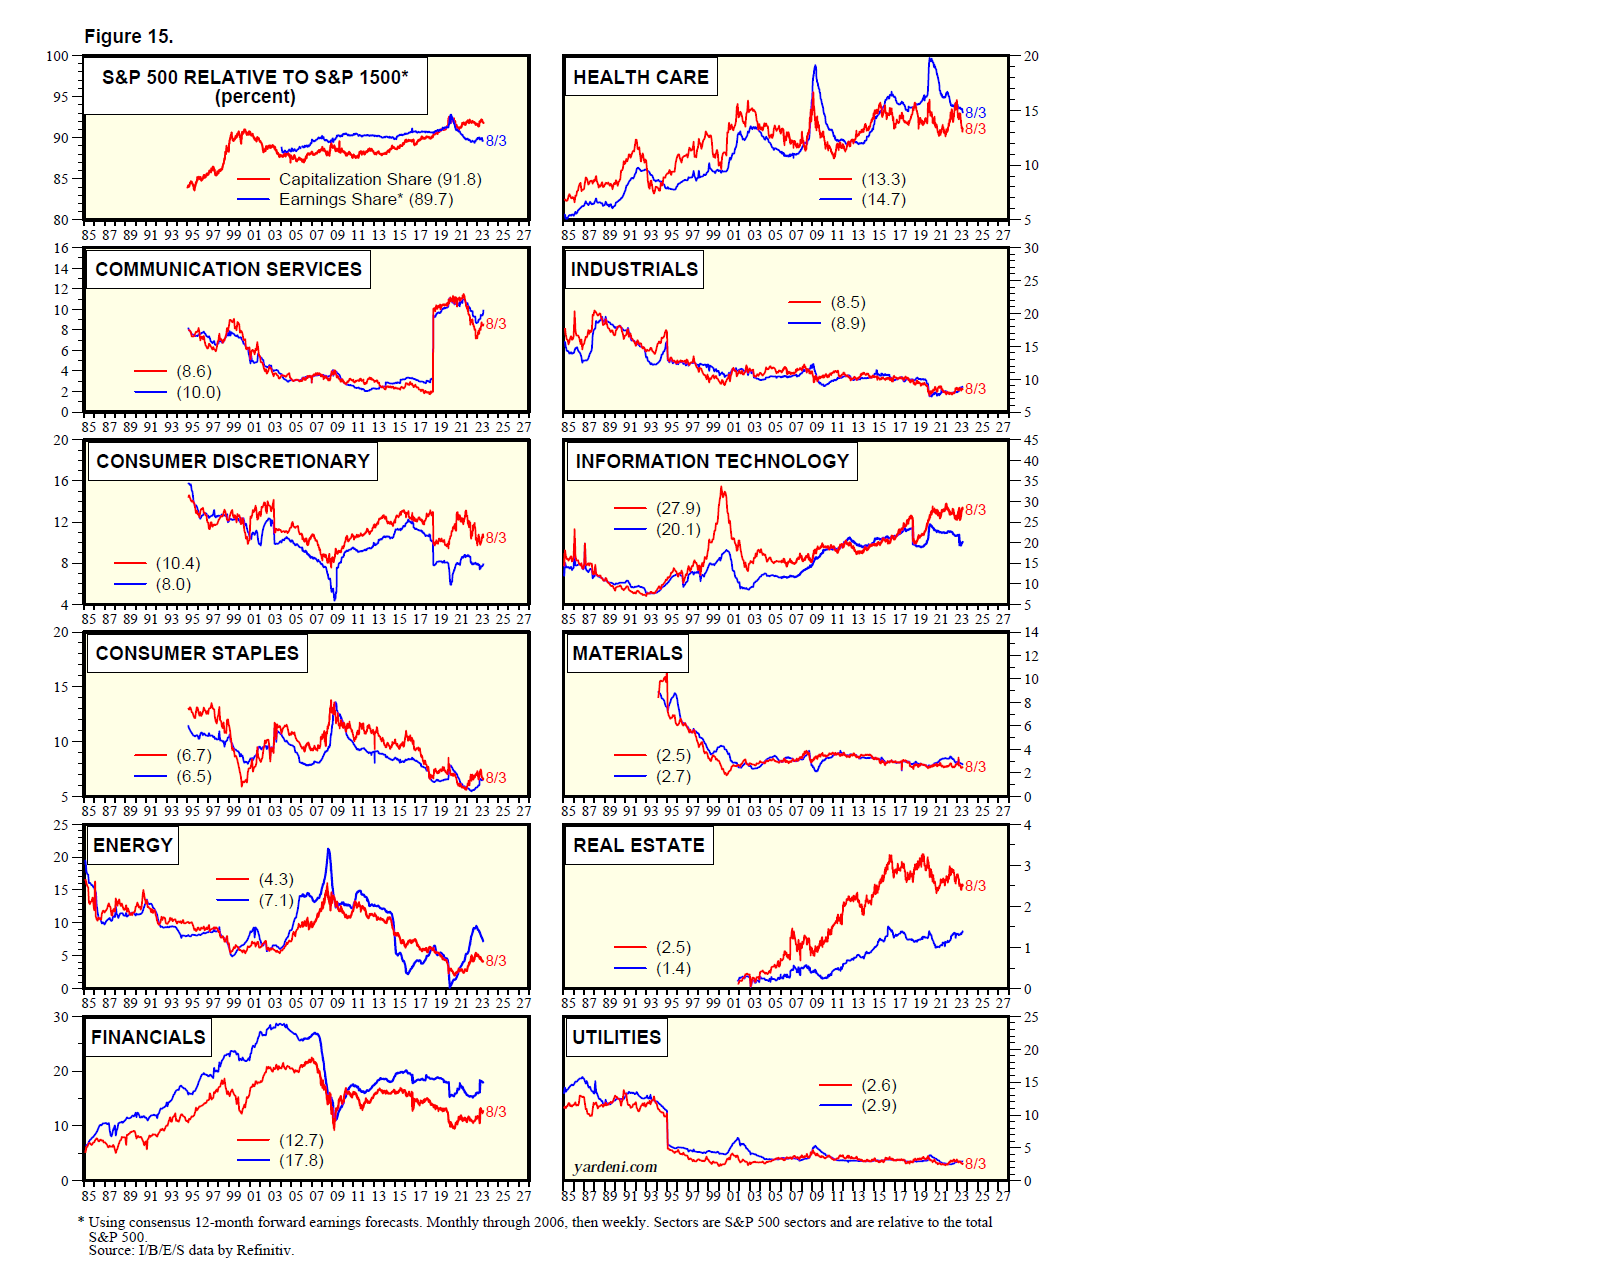
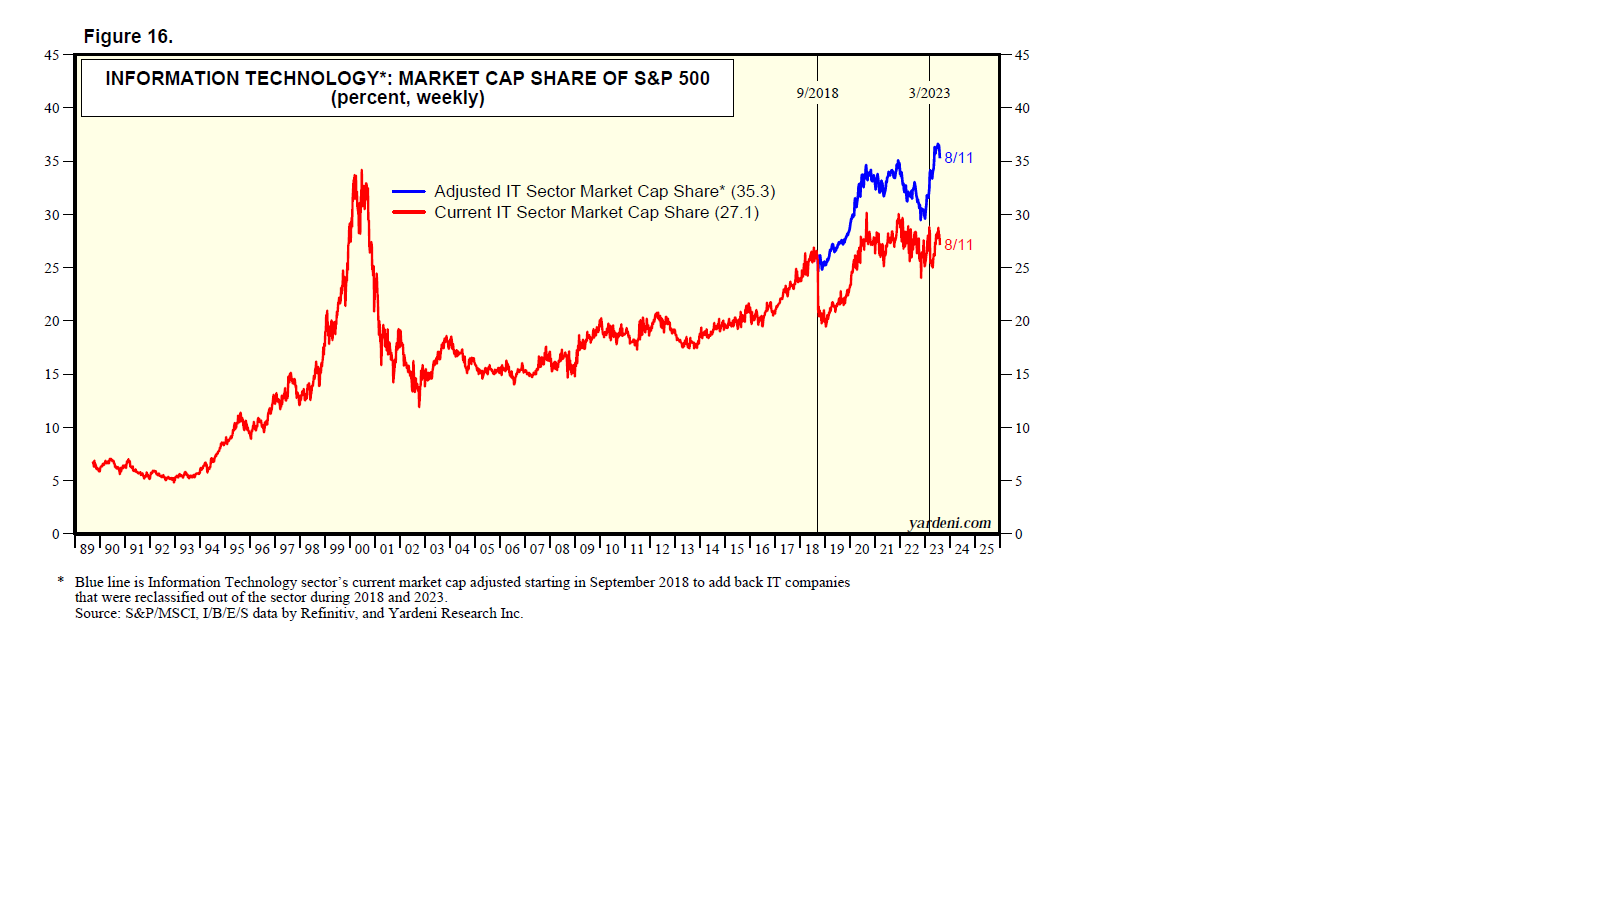